Iowa Park: Fire Incidents, Texas (TX)
Where are fire incidents reported in Iowa Park, TX
Something went wrong! Please refresh the page.
|
| |||||||||||||||||||||||||||||||||||||||||||||||||||||||||||||||||||||||||||||||||||||||||||||||||||||||||||||
2005 - 2018 National Fire Incident Reporting System (NFIRS) incidents
- Incident types reported to NFIRS in Iowa Park, TX
- 1,25757.2%Fire
- 46020.9%Hazardous Condition
- 1908.6%Rescue & EMS
- 1567.1%Good Intent Call
- 462.1%False Alarm
- 421.9%Severe Weather
- 331.5%Service Call
- 130.6%Overpressure Rupture
- Fire incident types reported to NFIRS in Iowa Park, TX
- 91072.4%Outside Fires
- 19115.2%Structure Fires
- 977.7%Mobile Property/Vehicle Fires
- 594.7%Other
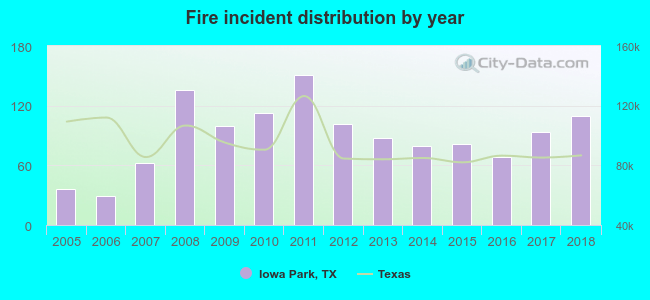 Based on the data from the years 2005 - 2018 the average number of fires per year is 89. The highest number of reported fire incidents - 151 took place in 2011, and the least - 29 in 2006. The data has an increasing trend.
The average number of yearly fire incidents per 10k residents in Iowa Park, TX compared to nearest cities:
(Note: Based on data for the last 3 years, including only cities with population 5,000 and above)
| Iowa Park: | 141.9 |
| Wichita Falls: | 49.7 |
| Burkburnett: | 73.3 |
| Vernon: | 115.2 |
| Bowie: | 40.1 |
| Graham: | 46.3 |
 The median response time based on all reported fire incidents is 7 minutes. This is close to the state median value.
The median response time in Iowa Park, TX compared to nearest cities:
(Note: Based on data for all years, including only cities with at least 500 fire incidents)
| Iowa Park: | 7 minutes |
| Wichita Falls: | 4 minutes |
| Burkburnett: | 6 minutes |
| Walters: | 9 minutes |
| Vernon: | 7 minutes |
| Cache: | 10 minutes |
| Lawton: | 4 minutes |
| Bowie: | 6 minutes |
| Nocona: | 9 minutes |
 25.1% incidents where reported in the morning and 74.9% in the evening. The most fires (15.5%) took place on Sunday, and the least (12.6%) on Friday.
 According to the 1,257 fire incidents from years 2005 - 2018 most fires (13.8%) took place during July, and the least (5.2%) in November.
 Out of all 2,197 cases reported during the years 2005 - 2018, the most belonged to the categories: Fire (57.2%), Hazardous Condition (20.9%), and Rescue & EMS (8.6%).
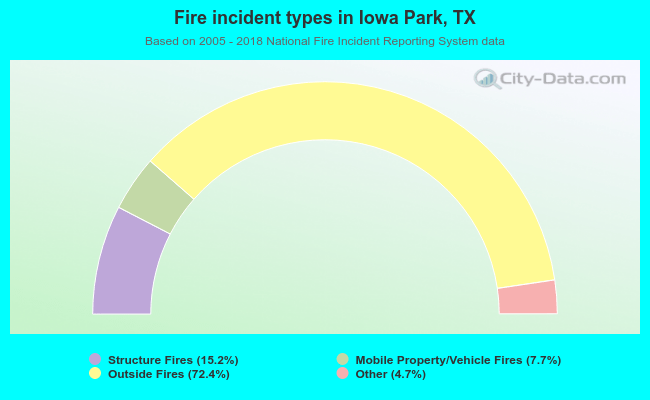 When looking into fire subcategories, the most reports belonged to: Outside Fires (72.4%), and Structure Fires (15.2%).