Ione: Fire Incidents, California (CA)
Where are fire incidents reported in Ione, CA
Something went wrong! Please refresh the page.
|
| |||||||||||||||||||||||||||||||||||||||||||||||||||||||||||||||||||||||||||||||||||||||||||||||||||||||||||||
2005 - 2018 National Fire Incident Reporting System (NFIRS) incidents
- Incident types reported to NFIRS in Ione, CA
- 16536.7%Rescue & EMS
- 12928.7%Fire
- 7316.2%Service Call
- 5712.7%Good Intent Call
- 153.3%False Alarm
- 81.8%Hazardous Condition
- 30.7%Overpressure Rupture
- Fire incident types reported to NFIRS in Ione, CA
- 10077.5%Outside Fires
- 2519.4%Structure Fires
- 32.3%Mobile Property/Vehicle Fires
- 10.8%Other
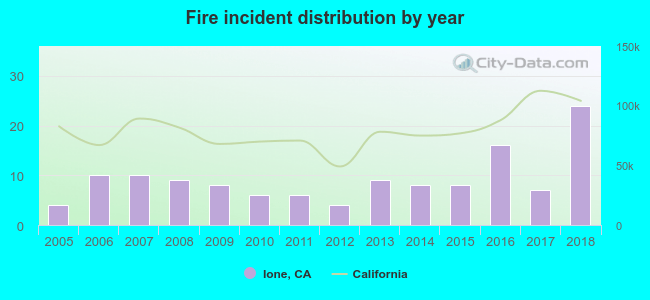 According to the data from the years 2005 - 2018 the average number of fire incidents per year is 9. The highest number of reported fire incidents - 24 took place in 2018, and the least - 4 in 2005. The data has a rising trend.
The average number of yearly fire incidents per 10k residents in Ione, CA compared to nearest cities:
(Note: Based on data for the last 3 years, including only cities with population 5,000 and above)
| Ione: | 22.4 |
| Rancho Murieta: | 34.6 |
| Sloughhouse: | 25.9 |
| Wilton: | 19.6 |
| Rancho Calaveras: | 20.7 |
| Galt: | 2.3 |
| Cameron Park: | 17.6 |
| Diamond Springs: | 11.8 |
| Lodi: | 46.5 |

 29.5% incidents where reported in the morning and 70.5% in the evening. The most fires (20.2%) took place on Saturday, and the least (7.8%) on Tuesday.
 Based on the 129 fires from years 2005 - 2018 most fires (17.1%) took place during June, and the least (3.1%) in November.
 Out of all 450 cases reported during the years 2005 - 2018, the most belonged to the categories: Rescue & EMS (36.7%), Fire (28.7%), and Service Call (16.2%).
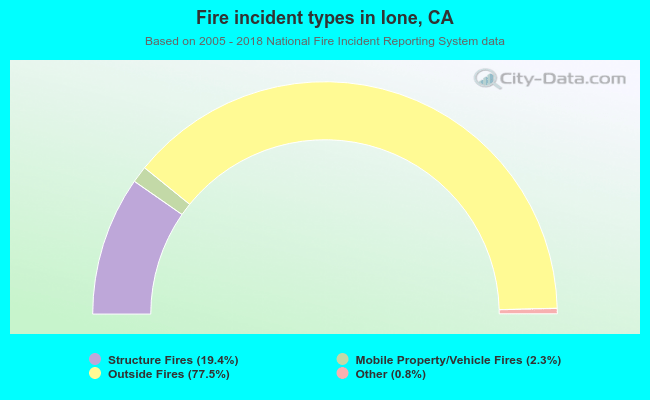 When looking into fire subcategories, the most reports belonged to: Outside Fires (77.5%), and Structure Fires (19.4%).