Hazelwood: Fire Incidents, Missouri (MO)
Where are fire incidents reported in Hazelwood, MO
Something went wrong! Please refresh the page.
| Fire incidents reported | |
|---|---|
| Sreet name | Count |
| HAZELCREST DR | 60 |
| SANTA MARIA CT | 52 |
| HWY 270 | 48 |
| CAMPUS PARKWAY DR | 46 |
| BYASSEE DR | 42 |
| CHAPEL RIDGE DR | 38 |
| MCDONNELL BLVD | 36 |
| LINDBERGH BLVD | 34 |
| MISSOURI BOTTOM RD | 32 |
| MO. BOTTOM RD | 30 |
| PHANTOM | 30 |
| SIELOFF DR | 30 |
| CAMPUS PARKWAY DR | 28 |
| FOREST CREEK DR | 28 |
| ST. LOUIS MILLS BLVD | 28 |
| ST LOUIS MILLS BLVD | 26 |
| PHANTOM DR | 22 |
| DUNN RD | 20 |
| NORMANDIE CT | 20 |
| SERENITY CIR | 20 |
| BYASSEE | 18 |
| HWY 67 | 18 |
| I 270 NB | 18 |
| VILLE ROSA | 18 |
| VILLE ROSA LN | 18 |
| HIGHWAY 270 NORTH BOUND | 16 |
| HIGHWAY 270 SOUTH BOUND | 16 |
| HOWDERSHELL RD | 16 |
| KNOLLCREEK DR | 16 |
| TESON RD | 16 |
| Other | 87 |
2002 - 2018 National Fire Incident Reporting System (NFIRS) incidents
- Incident types reported to NFIRS in Hazelwood, MO
- 2,38037.4%Rescue & EMS
- 1,12317.6%Good Intent Call
- 92714.6%Fire
- 73211.5%Service Call
- 5919.3%Hazardous Condition
- 5889.2%False Alarm
- 160.3%Overpressure Rupture
- 100.2%Special Incident
- Fire incident types reported to NFIRS in Hazelwood, MO
- 40343.5%Structure Fires
- 23024.8%Outside Fires
- 16517.8%Other
- 12913.9%Mobile Property/Vehicle Fires
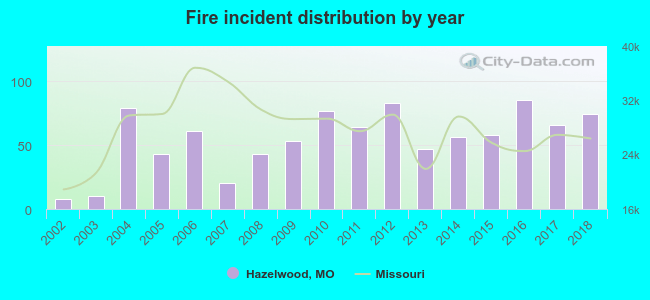 Based on the data from the years 2002 - 2018 the average number of fires per year is 55. The highest number of fires - 85 took place in 2016, and the least - 8 in 2002. The data has an increasing trend.
The average number of yearly fire incidents per 10k residents in Hazelwood, MO compared to nearest cities:
(Note: Based on data for the last 3 years, including only cities with population 5,000 and above)
| Hazelwood: | 29.2 |
| Florissant: | 45.0 |
| Berkeley: | 76.3 |
| Bridgeton: | 76.7 |
| Ferguson: | 75.6 |
| Dellwood: | 51.9 |
| Overland: | 19.6 |
| Black Jack: | 7.2 |
| Maryland Heights: | 36.6 |
 The median response time based on all reported fire incidents is 6 minutes. This is comparable to the state median value.
The median response time in Hazelwood, MO compared to nearest cities:
(Note: Based on data for all years, including only cities with at least 500 fire incidents)
| Hazelwood: | 6 minutes |
| Florissant: | 5 minutes |
| Berkeley: | 4 minutes |
| Bridgeton: | 5 minutes |
| Ferguson: | 4 minutes |
| Overland: | 5 minutes |
| Normandy: | 6 minutes |
| Maryland Heights: | 5 minutes |
| Jennings: | 4 minutes |
 31.9% incidents where reported in the morning and 68.1% in the evening. The most fires (15.7%) took place on Friday, and the least (12.8%) on Wednesday.
 Based on the 927 fire incident reports from years 2002 - 2018 most fires (10.4%) took place during December, and the least (6.6%) in February.
 Out of all 6,369 cases reported during the years 2002 - 2018, the most belonged to the categories: Rescue & EMS (37.4%), Good Intent Call (17.6%), and Fire (14.6%).
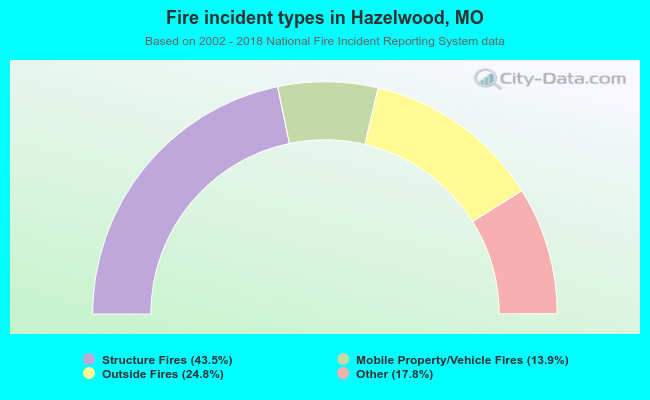 When looking into fire subcategories, the most reports belonged to: Structure Fires (43.5%), and Outside Fires (24.8%).