Groveland: Fire Incidents, Massachusetts (MA)
Where are fire incidents reported in Groveland, MA
Something went wrong! Please refresh the page.
|
| |||||||||||||||||||||||||||||||||||||||||||||||||||||||||||||||||||||||||||||||||||||||||||||||||||||||||||||
2002 - 2018 National Fire Incident Reporting System (NFIRS) incidents
- Incident types reported to NFIRS in Groveland, MA
- 1,25254.9%Rescue & EMS
- 29312.8%False Alarm
- 29012.7%Service Call
- 1546.7%Fire
- 1486.5%Good Intent Call
- 1325.8%Hazardous Condition
- 70.3%Severe Weather
- 40.2%Special Incident
- Fire incident types reported to NFIRS in Groveland, MA
- 6944.8%Structure Fires
- 5334.4%Outside Fires
- 1811.7%Other
- 149.1%Mobile Property/Vehicle Fires
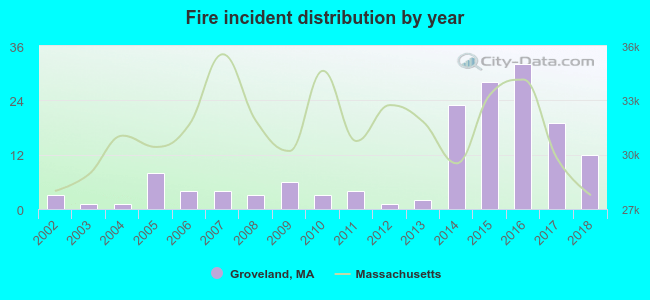 Based on the data from the years 2002 - 2018 the average number of fire incidents per year is 9. The highest number of reported fires - 32 took place in 2016, and the least - 1 in 2003. The data has a growing trend.
The average number of yearly fire incidents per 10k residents in Groveland, MA compared to nearest cities:
(Note: Based on data for the last 3 years, including only cities with population 5,000 and above)
| Groveland: | 32.5 |
| Georgetown: | 55.4 |
| Haverhill: | 33.9 |
| Merrimac: | 68.9 |
| North Andover: | 38.9 |
| Lawrence: | 26.0 |
| Methuen: | 26.7 |
| Newburyport: | 8.4 |
| Andover: | 113.4 |

 31.8% incidents where reported in the morning and 68.2% in the evening. The most fires (19.5%) took place on Sunday, and the least (9.1%) on Thursday.
 Based on the 154 fire incident reports from years 2002 - 2018 most fires (16.9%) took place during April, and the least (3.9%) in January.
 Out of all 2,282 cases reported during the years 2002 - 2018, the most belonged to the categories: Rescue & EMS (54.9%), False Alarm (12.8%), and Service Call (12.7%).
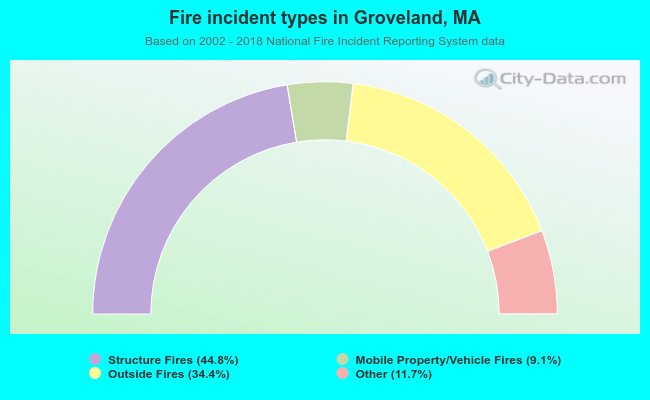 When looking into fire subcategories, the most reports belonged to: Structure Fires (44.8%), and Outside Fires (34.4%).