Griffith: Fire Incidents, Indiana (IN)
Where are fire incidents reported in Griffith, IN
Something went wrong! Please refresh the page.
|
| |||||||||||||||||||||||||||||||||||||||||||||||||||||||||||||||||||||||||||||||||||||||||||||||||||||||||||||
2003 - 2017 National Fire Incident Reporting System (NFIRS) incidents
- Incident types reported to NFIRS in Griffith, IN
- 38248.4%Fire
- 17221.8%Hazardous Condition
- 9612.2%Rescue & EMS
- 8410.6%Service Call
- 283.5%False Alarm
- 162.0%Good Intent Call
- 101.3%Special Incident
- 10.1%Overpressure Rupture
- Fire incident types reported to NFIRS in Griffith, IN
- 16041.9%Structure Fires
- 11329.6%Outside Fires
- 5815.2%Other
- 5113.4%Mobile Property/Vehicle Fires
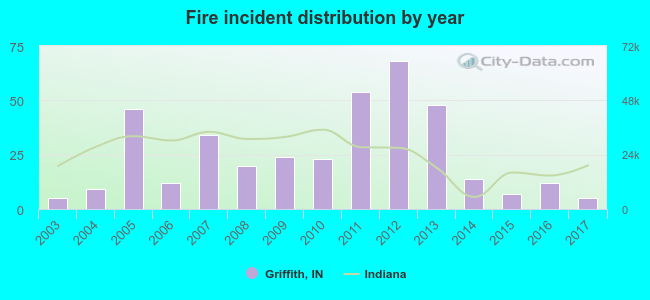 According to the data from the years 2003 - 2017 the average number of fires per year is 25. The highest number of reported fires - 68 took place in 2012, and the least - 5 in 2003. The data has a constant trend.
The average number of yearly fire incidents per 10k residents in Griffith, IN compared to nearest cities:
(Note: Based on data for the last 3 years, including only cities with population 5,000 and above)
| Griffith: | 3.6 |
| Highland: | 16.3 |
| Schererville: | 13.3 |
| Munster: | 15.9 |
| Dyer: | 18.9 |
| Gary: | 11.3 |
| Merrillville: | 23.5 |
| Hammond: | 0.1 |
| East Chicago: | 61.9 |
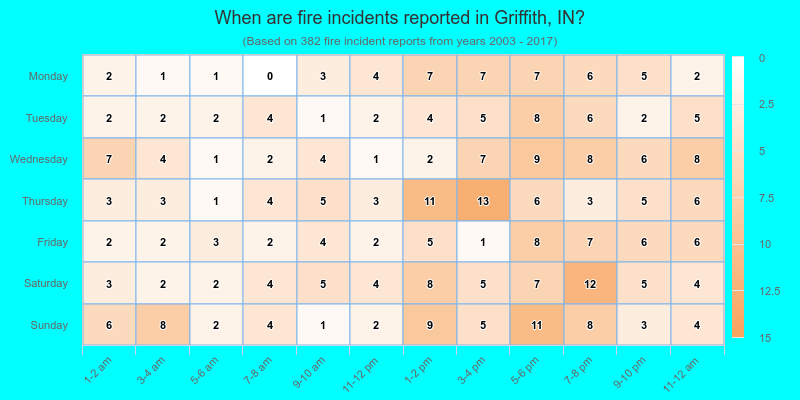
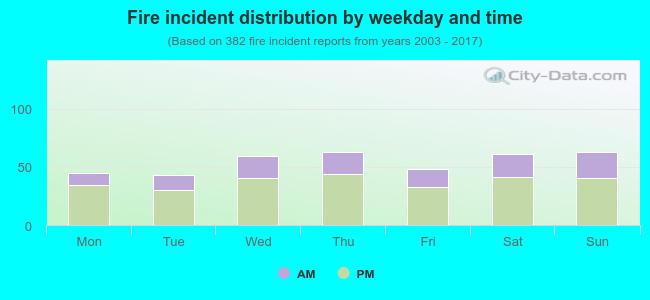 31.4% incidents where reported in the morning and 68.6% in the evening. The most fires (16.5%) took place on Thursday, and the least (11.3%) on Tuesday.
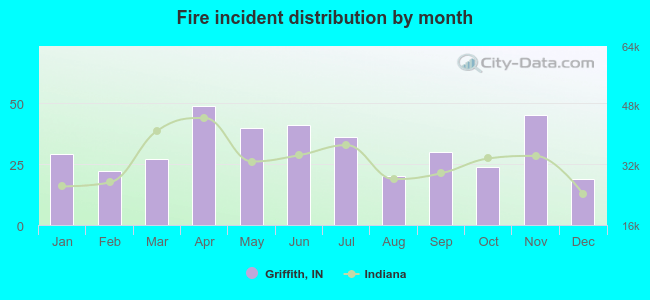 Based on the 382 fire incidents from years 2003 - 2017 most fires (12.8%) took place during April, and the least (5.0%) in December.
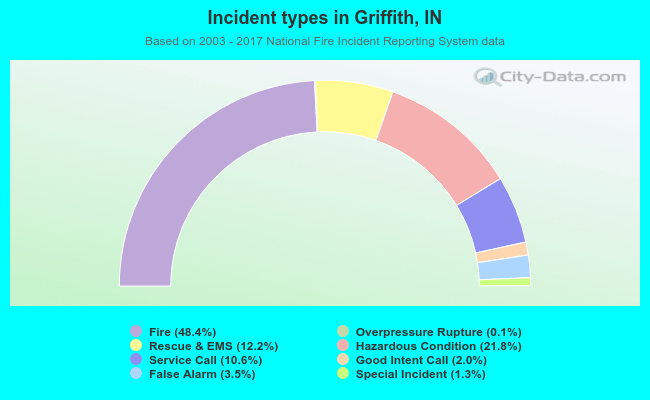 Out of all 789 cases reported during the years 2003 - 2017, the most belonged to the categories: Fire (48.4%), Hazardous Condition (21.8%), and Rescue & EMS (12.2%).
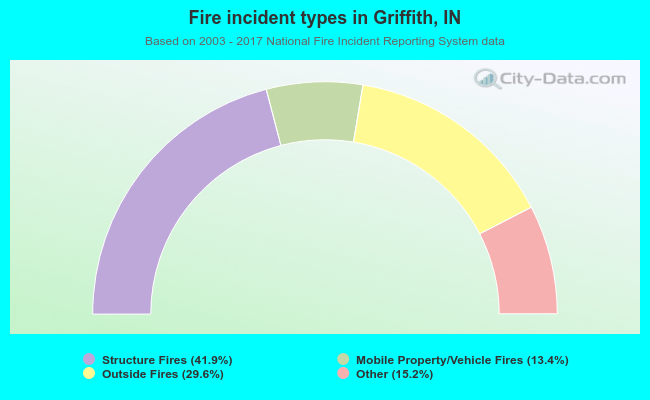 When looking into fire subcategories, the most incidents belonged to: Structure Fires (41.9%), and Outside Fires (29.6%).