Garden City: Fire Incidents, Georgia (GA)
Where are fire incidents reported in Garden City, GA
Something went wrong! Please refresh the page.
| Fire incidents reported | |
|---|---|
| Sreet name | Count |
| AUGUSTA RD | 200 |
| DEAN FOREST RD | 126 |
| MAIN ST | 116 |
| HIGHWAY 80 | 104 |
| CHATHAM VILLA DR | 72 |
| OLD LOUISVILLE RD | 64 |
| BRAMPTON RD | 48 |
| VILLAGE DR | 48 |
| HARLEY DR | 38 |
| OGEECHEE RD | 36 |
| BOURNE AVE | 32 |
| BYCK AVE | 32 |
| SMITH AVE | 30 |
| CHATHAM PKY | 28 |
| AUGUSTA ROAD RD | 26 |
| HIGHWAY 80 HWY | 24 |
| SHADY LN | 24 |
| DEAN FOREST ROAD RD | 22 |
| HIGHWAY 21 | 22 |
| OLD DEAN FOREST RD | 22 |
| MINUS AVE | 20 |
| PROSPERITY DR | 20 |
| SALT CREEK RD | 20 |
| SONNY PERDUE DR | 20 |
| TELFAIR PL | 20 |
| DAVIS AVE | 18 |
| HWY 80 | 18 |
| MAIN STREET ST | 18 |
| NELSON AVE | 18 |
| PORT CALL | 18 |
2002 - 2018 National Fire Incident Reporting System (NFIRS) incidents
- Incident types reported to NFIRS in Garden City, GA
- 4,96955.0%Rescue & EMS
- 1,18413.1%Fire
- 8239.1%Good Intent Call
- 6757.5%Hazardous Condition
- 5906.5%False Alarm
- 5075.6%Service Call
- 2743.0%Severe Weather
- Fire incident types reported to NFIRS in Garden City, GA
- 49942.1%Outside Fires
- 43536.7%Structure Fires
- 23319.7%Mobile Property/Vehicle Fires
- 171.4%Other
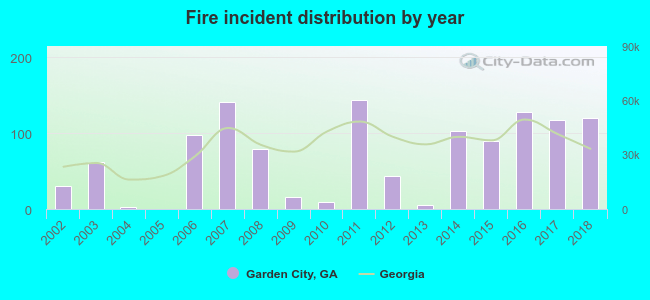 According to the data from the years 2002 - 2018 the average number of fires per year is 70. The highest number of reported fires - 143 took place in 2011, and the least - 0 in 2005. The data has a rising trend.
The average number of yearly fire incidents per 10k residents in Garden City, GA compared to nearest cities:
(Note: Based on data for the last 3 years, including only cities with population 5,000 and above)
| Garden City: | 134.9 |
| Port Wentworth: | 85.2 |
| Savannah: | 85.0 |
| Pooler: | 60.2 |
| Georgetown: | 6.2 |
| Wilmington Island: | 0.7 |
| Rincon: | 63.6 |
| Skidaway Island: | 4.8 |
| Richmond Hill: | 89.6 |
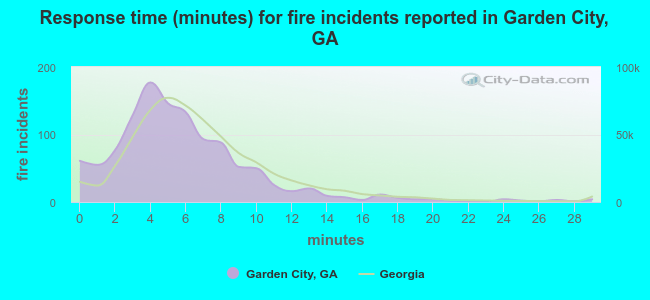 The median response time based on all reported fire incidents is 5 minutes. This is lower than the Georgia median value.
The median response time in Garden City, GA compared to nearest cities:
(Note: Based on data for all years, including only cities with at least 500 fire incidents)
| Garden City: | 5 minutes |
| Port Wentworth: | 5 minutes |
| Savannah: | 4 minutes |
| Pooler: | 6 minutes |
| Bloomingdale: | 6 minutes |
| Rincon: | 6 minutes |
| Richmond Hill: | 6 minutes |
| Springfield: | 7 minutes |
| Guyton: | 8 minutes |
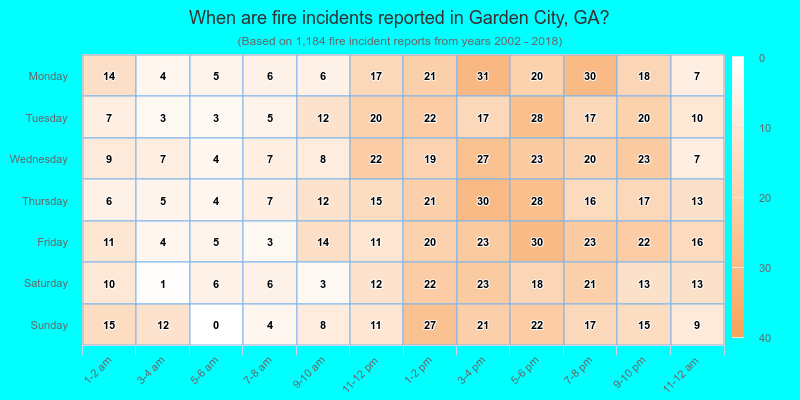
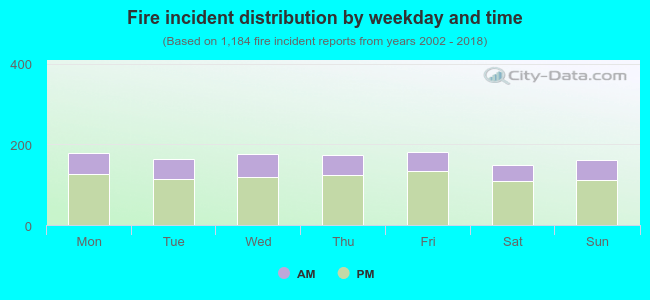 29.1% incidents where reported in the morning and 70.9% in the evening. The most fires (15.4%) took place on Friday, and the least (12.5%) on Saturday.
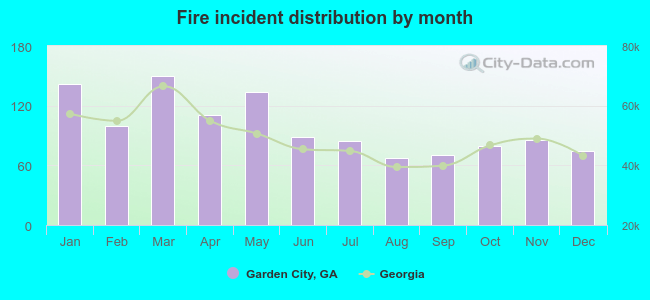 According to the 1,184 fire incident reports from years 2002 - 2018 most fires (12.7%) took place during March, and the least (5.7%) in August.
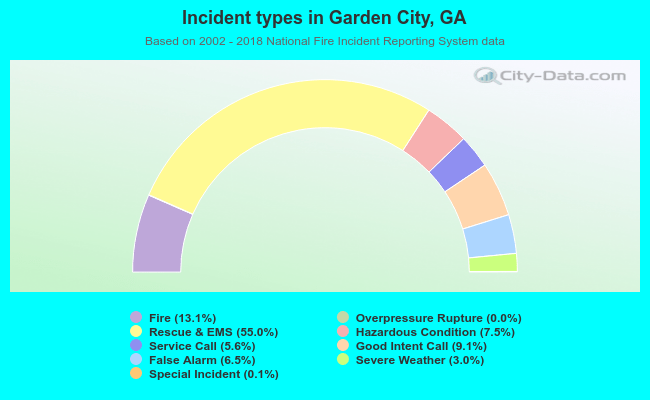 Out of all 9,031 cases reported during the years 2002 - 2018, the most belonged to the categories: Rescue & EMS (55.0%), Fire (13.1%), and Good Intent Call (9.1%).
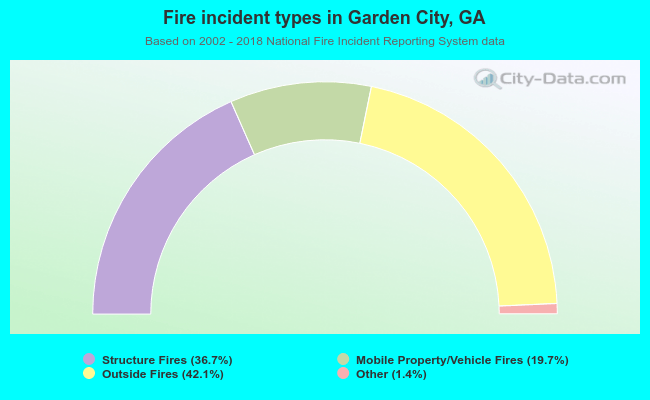 When looking into fire subcategories, the most incidents belonged to: Outside Fires (42.1%), and Structure Fires (36.7%).