Franklin: Fire Incidents, Tennessee (TN)
Where are fire incidents reported in Franklin, TN
Something went wrong! Please refresh the page.
| Fire incidents reported | |
|---|---|
| Sreet name | Count |
| MURFREESBORO RD | 220 |
| COOL SPRINGS BLVD | 182 |
| HILLSBORO RD | 152 |
| INTERSTATE 65 HWY | 146 |
| MALLORY LN | 114 |
| OLD HILLSBORO RD | 94 |
| COLUMBIA AVE | 84 |
| GALLERIA BLVD | 78 |
| FRANKLIN RD | 76 |
| PINEWOOD RD | 66 |
| LEWISBURG PIKE | 64 |
| CAROTHERS PKY | 60 |
| CARTERS CREEK PIKE | 60 |
| MCEWEN DR | 58 |
| GILLESPIE DR | 52 |
| COLUMBIA PIKE | 50 |
| DOWNS BLVD | 48 |
| MAIN ST | 46 |
| CLOVERCROFT RD | 42 |
| ARNO RD | 40 |
| ROYAL OAKS BLVD | 40 |
| SNEED RD | 40 |
| MORAN RD | 36 |
| EDGEWOOD BLVD | 34 |
| NEW HIGHWAY 96 | 34 |
| SOUTHALL RD | 34 |
| COLEMAN RD | 32 |
| DEL RIO PIKE | 32 |
| FRAZIER DR | 32 |
| WEST MAIN ST | 32 |
| Other | 1,518 |
2003 - 2018 National Fire Incident Reporting System (NFIRS) incidents
- Incident types reported to NFIRS in Franklin, TN
- 25,34156.3%Rescue & EMS
- 4,61810.3%False Alarm
- 4,57710.2%Good Intent Call
- 3,5968.0%Fire
- 3,5868.0%Service Call
- 3,1016.9%Hazardous Condition
- 830.2%Overpressure Rupture
- 460.1%Special Incident
- 450.1%Severe Weather
- Fire incident types reported to NFIRS in Franklin, TN
- 1,64145.6%Outside Fires
- 1,30536.3%Structure Fires
- 60616.9%Mobile Property/Vehicle Fires
- 441.2%Other
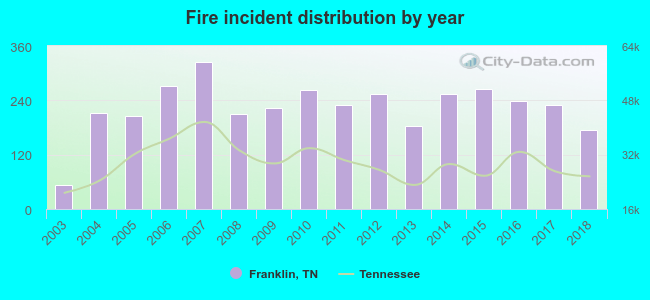 According to the data from the years 2003 - 2018 the average number of fires per year is 224. The highest number of fires - 324 took place in 2007, and the least - 53 in 2003. The data has a growing trend.
The average number of yearly fire incidents per 10k residents in Franklin, TN compared to nearest cities:
(Note: Based on data for the last 3 years, including only cities with population 5,000 and above)
| Franklin: | 30.3 |
| Brentwood: | 22.5 |
| Nolensville: | 35.8 |
| Spring Hill: | 17.9 |
| Fairview: | 28.4 |
| La Vergne: | 1.8 |
| Smyrna: | 37.8 |
| Columbia: | 50.7 |
| Murfreesboro: | 42.6 |
 The median response time based on all reported fire incidents is 6 minutes. This is comparable to the Tennessee median value.
The median response time in Franklin, TN compared to nearest cities:
(Note: Based on data for all years, including only cities with at least 500 fire incidents)
| Franklin: | 6 minutes |
| Brentwood: | 6 minutes |
| Spring Hill: | 6 minutes |
| Fairview: | 9 minutes |
| La Vergne: | 3 minutes |
| Smyrna: | 6 minutes |
| Chapel Hill: | 8 minutes |
| White Bluff: | 6 minutes |
| Columbia: | 5 minutes |
 According to the data from the years 2003 - 2018 the average number of fire-related fatalities per year is 1. The highest number of reported deaths - 3 took place in 2017, and the lowest - 0 in 2003. The data has a growing trend.
The average number of deaths per 1,000 fire incidents is 3. This indicator was the highest - 13 in 2017, and the lowest 0 in 2003. The trend for fatalities per 1,000 incidents is rising. Compared to the state value the number of fatalities per 1,000 fire incidents is lower.
According to the data from the years 2003 - 2018 the average number of fire-related fatalities per year is 1. The highest number of reported deaths - 3 took place in 2017, and the lowest - 0 in 2003. The data has a growing trend.
The average number of deaths per 1,000 fire incidents is 3. This indicator was the highest - 13 in 2017, and the lowest 0 in 2003. The trend for fatalities per 1,000 incidents is rising. Compared to the state value the number of fatalities per 1,000 fire incidents is lower.Deaths per 1,000 incidents in Franklin, TN compared to nearest cities:
(Note: Based on data for all years, including only cities with at least 2,500 fire incidents)
| Franklin: | 2.5 |
| Columbia: | 3.1 |
| Murfreesboro: | 3.8 |
| Dickson: | 1.0 |
| Lebanon: | 2.9 |
| Shelbyville: | 2.0 |
 According to the reports from the years 2003 - 2018 the average number of fire-related casualties per year is 3. The highest number of reported injuries - 7 took place in 2007, and the lowest - 0 in 2003. The data has an increasing trend.
The average number of casualties per 1,000 fire incidents is 12. This indicator was the highest - 27 in 2013, and the lowest 0 in 2003. The trend for injuries per 1,000 fires is increasing. Compared to the Tennessee value the number of injuries per 1,000 fires is higher.
According to the reports from the years 2003 - 2018 the average number of fire-related casualties per year is 3. The highest number of reported injuries - 7 took place in 2007, and the lowest - 0 in 2003. The data has an increasing trend.
The average number of casualties per 1,000 fire incidents is 12. This indicator was the highest - 27 in 2013, and the lowest 0 in 2003. The trend for injuries per 1,000 fires is increasing. Compared to the Tennessee value the number of injuries per 1,000 fires is higher.Casualties per 1,000 incidents in Franklin, TN compared to nearest cities:
(Note: Based on data for all years, including only cities with at least 500 fire incidents)
| Franklin: | 12.8 |
| Brentwood: | 8.9 |
| Spring Hill: | 3.6 |
| Fairview: | 5.4 |
| La Vergne: | 3.2 |
| Smyrna: | 48.9 |
| Chapel Hill: | 1.8 |
| White Bluff: | 0.0 |
| Columbia: | 12.1 |
 28.7% incidents where reported in the morning and 71.3% in the evening. The most fires (15.3%) took place on Saturday, and the least (13.5%) on Tuesday.
 Based on the 3,596 incident reports from years 2003 - 2018 most fires (10.2%) took place during March, and the least (6.8%) in September.
 Out of all 44,993 cases reported during the years 2003 - 2018, the most belonged to the categories: Rescue & EMS (56.3%), False Alarm (10.3%), and Good Intent Call (10.2%).
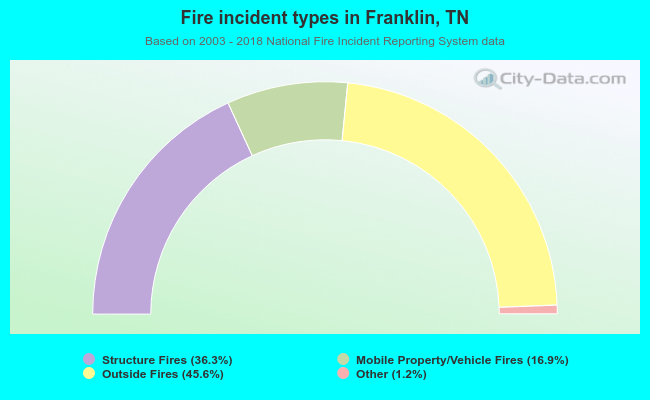 When looking into fire subcategories, the most incidents belonged to: Outside Fires (45.6%), and Structure Fires (36.3%).