Fairfield: Fire Incidents, Ohio (OH)
Where are fire incidents reported in Fairfield, OH
Something went wrong! Please refresh the page.
| Fire incidents reported | |
|---|---|
| Sreet name | Count |
| DIXIE HWY | 312 |
| MACK RD | 82 |
| RIVER RD | 74 |
| PLEASANT AVE | 68 |
| SEWARD RD | 68 |
| NILLES RD | 66 |
| CAMELOT DR | 64 |
| WESSEL DR | 58 |
| WOODRIDGE BLVD | 58 |
| PORT UNION RD | 56 |
| SOUTHGATE BLVD | 46 |
| PLEASANT (4441 TO 57 AVE | 40 |
| SYMMES RD | 40 |
| WINTON RD | 40 |
| BENT TREE DR | 32 |
| CORYDALE DR | 28 |
| SOUTH GILMORE RD | 28 |
| BOYMEL DR | 26 |
| ROESCH BLVD | 26 |
| MACK (2310 TO 3174) RD | 24 |
| ROSS RD | 24 |
| BOBMEYER RD | 22 |
| FAIRFIELD BUSINESS DR | 22 |
| WOODTRAIL DR | 22 |
| GROH LN | 20 |
| PROVIDENCE DR | 20 |
| SHERWOOD DR | 20 |
| FAIRFIELD AVE | 18 |
| HUNTER RD | 18 |
| NILLES (311 TO 1111) RD | 18 |
| Other | 318 |
2004 - 2018 National Fire Incident Reporting System (NFIRS) incidents
- Incident types reported to NFIRS in Fairfield, OH
- 18,28075.7%Rescue & EMS
- 1,7587.3%Fire
- 1,5226.3%Hazardous Condition
- 1,0324.3%Good Intent Call
- 9784.1%False Alarm
- 5242.2%Service Call
- 250.1%Special Incident
- Fire incident types reported to NFIRS in Fairfield, OH
- 79145.0%Structure Fires
- 69339.4%Outside Fires
- 26515.1%Mobile Property/Vehicle Fires
- 90.5%Other
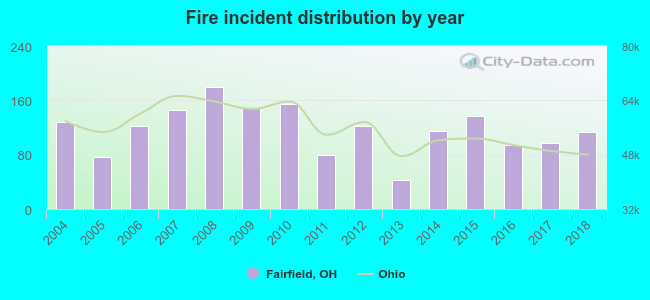 Based on the data from the years 2004 - 2018 the average number of fires per year is 117. The highest number of reported fires - 179 took place in 2008, and the least - 43 in 2013. The data has a declining trend.
The average number of yearly fire incidents per 10k residents in Fairfield, OH compared to nearest cities:
(Note: Based on data for the last 3 years, including only cities with population 5,000 and above)
| Fairfield: | 23.7 |
| Forest Park: | 42.0 |
| Springdale: | 78.8 |
| Hamilton: | 65.6 |
| Mount Healthy: | 2.7 |
| North College Hill: | 23.5 |
| Wyoming: | 21.0 |
| Sharonville: | 65.8 |
| Reading: | 56.7 |
 The median response time based on all reported fire incidents is 5 minutes. This is lower than the Ohio median value.
The median response time in Fairfield, OH compared to nearest cities:
(Note: Based on data for all years, including only cities with at least 500 fire incidents)
| Fairfield: | 5 minutes |
| Forest Park: | 5 minutes |
| Springdale: | 5 minutes |
| Hamilton: | 5 minutes |
| Woodlawn: | 5 minutes |
| Lincoln Heights: | 5 minutes |
| Wyoming: | 5 minutes |
| Evendale: | 5 minutes |
| Sharonville: | 6 minutes |
 Based on the data from the years 2004 - 2018 the average number of fire-related casualties per year is 1. The highest number of casualties - 3 took place in 2005, and the lowest - 0 in 2009. The data has a dropping trend.
The average number of injuries per 1,000 fire incidents is 11. This indicator was the highest - 39 in 2005, and the lowest 0 in 2009. The trend for injuries per 1,000 fire incidents is dropping. Compared to the state value the number of casualties per 1,000 incidents is lower.
Based on the data from the years 2004 - 2018 the average number of fire-related casualties per year is 1. The highest number of casualties - 3 took place in 2005, and the lowest - 0 in 2009. The data has a dropping trend.
The average number of injuries per 1,000 fire incidents is 11. This indicator was the highest - 39 in 2005, and the lowest 0 in 2009. The trend for injuries per 1,000 fire incidents is dropping. Compared to the state value the number of casualties per 1,000 incidents is lower.Casualties per 1,000 incidents in Fairfield, OH compared to nearest cities:
(Note: Based on data for all years, including only cities with at least 500 fire incidents)
| Fairfield: | 10.8 |
| Forest Park: | 26.3 |
| Springdale: | 21.1 |
| Hamilton: | 10.6 |
| Woodlawn: | 3.8 |
| Lincoln Heights: | 0.0 |
| Wyoming: | 6.8 |
| Evendale: | 3.7 |
| Sharonville: | 6.8 |
 28.4% incidents where reported in the morning and 71.6% in the evening. The most fires (15.8%) took place on Sunday, and the least (12.4%) on Thursday.
 Based on the 1,758 fire incident reports from years 2004 - 2018 most fires (10.6%) took place during July, and the least (4.8%) in February.
 Out of all 24,138 cases reported during the years 2004 - 2018, the most belonged to the categories: Rescue & EMS (75.7%), Fire (7.3%), and Hazardous Condition (6.3%).
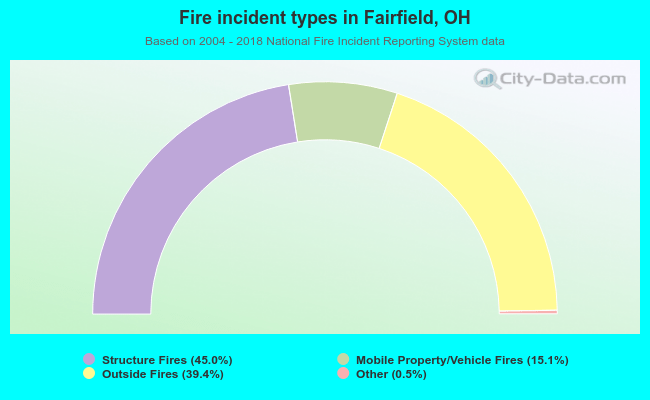 When looking into fire subcategories, the most reports belonged to: Structure Fires (45.0%), and Outside Fires (39.4%).