Elsmere: Fire Incidents, Kentucky (KY)
Where are fire incidents reported in Elsmere, KY
Something went wrong! Please refresh the page.
|
| |||||||||||||||||||||||||||||||||||||||||||||||||||||||||||||||||||||||||||||||||||||||||||||||||||||||||||||
2002 - 2018 National Fire Incident Reporting System (NFIRS) incidents
- Incident types reported to NFIRS in Elsmere, KY
- 1,20738.2%Rescue & EMS
- 56417.9%Hazardous Condition
- 47415.0%Fire
- 34210.8%Service Call
- 32710.4%Good Intent Call
- 2377.5%False Alarm
- 50.2%Special Incident
- Fire incident types reported to NFIRS in Elsmere, KY
- 26656.1%Structure Fires
- 13929.3%Outside Fires
- 5812.2%Mobile Property/Vehicle Fires
- 112.3%Other
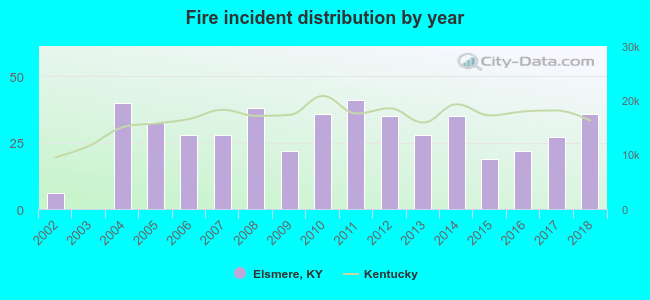 According to the data from the years 2002 - 2018 the average number of fire incidents per year is 28. The highest number of fires - 41 took place in 2011, and the least - 0 in 2003. The data has a growing trend.
The average number of yearly fire incidents per 10k residents in Elsmere, KY compared to nearest cities:
(Note: Based on data for the last 3 years, including only cities with population 5,000 and above)
| Elsmere: | 33.3 |
| Erlanger: | 44.2 |
| Edgewood: | 17.9 |
| Florence: | 68.6 |
| Fort Mitchell: | 26.6 |
| Villa Hills: | 16.2 |
| Independence: | 26.2 |
| Fort Wright: | 20.3 |
| Union: | 36.6 |

 According to the data from the years 2002 - 2018 the average number of fire-related yearly casualties is 1. The highest number of injuries - 5 took place in 2011, and the lowest - 0 in 2002. The data has a growing trend.
 28.7% incidents where reported in the morning and 71.3% in the evening. The most fires (17.3%) took place on Monday, and the least (10.3%) on Thursday.
 Based on the 474 incident reports from years 2002 - 2018 most fires (11.4%) took place during June, and the least (5.5%) in January.
 Out of all 3,159 cases reported during the years 2002 - 2018, the most belonged to the categories: Rescue & EMS (38.2%), Hazardous Condition (17.9%), and Fire (15.0%).
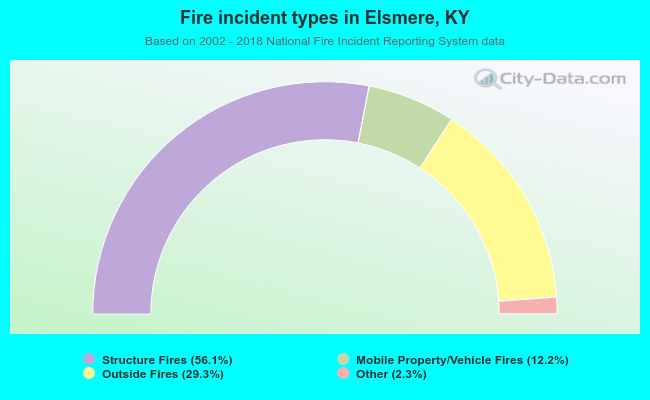 When looking into fire subcategories, the most reports belonged to: Structure Fires (56.1%), and Outside Fires (29.3%).