East Point: Fire Incidents, Georgia (GA)
Where are fire incidents reported in East Point, GA
Something went wrong! Please refresh the page.
| Fire incidents reported | |
|---|---|
| Sreet name | Count |
| WASHINGTON RD | 264 |
| MAIN ST | 140 |
| CLEVELAND AVE | 102 |
| DELOWE DR | 94 |
| STANTON RD | 86 |
| CENTRAL AVE | 84 |
| SYLVAN RD | 80 |
| 285 SB | 78 |
| MCCLELLAND AVE | 64 |
| HEADLAND DR | 62 |
| DODSON DR | 56 |
| CONNALLY DR | 54 |
| LAKEVIEW PL | 54 |
| VIRGINIA AVE | 54 |
| DESERT CIR | 50 |
| BEN HILL RD | 48 |
| DESERT DR | 48 |
| CALHOUN AVE | 46 |
| CAMP CREEK PKW | 46 |
| DUNLAP AVE | 46 |
| STONE RD | 46 |
| POINTVIEW DR | 44 |
| EAST POINT ST | 42 |
| BAYARD ST | 40 |
| COMMERCE DR | 40 |
| NORMAN BERRY DR | 38 |
| OAKLEIGH DR | 38 |
| CHURCH ST | 36 |
| DREXEL LN | 36 |
| HARRIS ST | 34 |
| Other | 448 |
2002 - 2018 National Fire Incident Reporting System (NFIRS) incidents
- Incident types reported to NFIRS in East Point, GA
- 25,09667.2%Rescue & EMS
- 3,6419.8%Good Intent Call
- 2,3986.4%Fire
- 2,1985.9%False Alarm
- 2,1255.7%Service Call
- 1,7764.8%Hazardous Condition
- 670.2%Overpressure Rupture
- Fire incident types reported to NFIRS in East Point, GA
- 90437.7%Outside Fires
- 77632.4%Structure Fires
- 57223.9%Mobile Property/Vehicle Fires
- 1466.1%Other
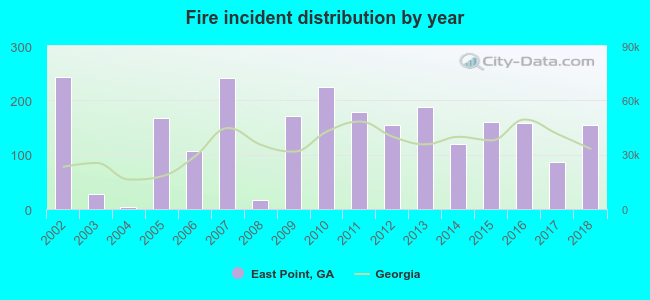 According to the data from the years 2002 - 2018 the average number of fires per year is 141. The highest number of fires - 243 took place in 2002, and the least - 3 in 2004. The data has a decreasing trend.
The average number of yearly fire incidents per 10k residents in East Point, GA compared to nearest cities:
(Note: Based on data for the last 3 years, including only cities with population 5,000 and above)
| East Point: | 37.5 |
| College Park: | 167.6 |
| Hapeville: | 43.0 |
| Forest Park: | 76.9 |
| Atlanta: | 36.1 |
| Conley: | 53.0 |
| Riverdale: | 147.4 |
| Gresham Park: | 5.4 |
| Union City: | 69.7 |
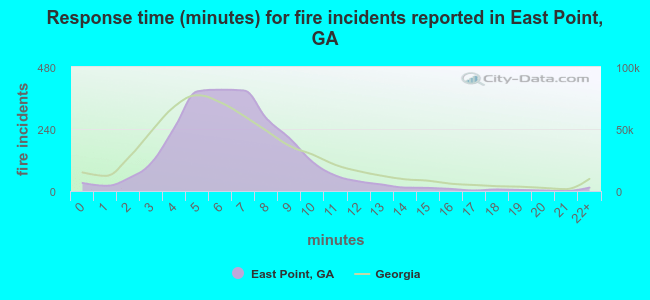 The median response time based on all reported fire incidents is 6 minutes. This is comparable to the Georgia median value.
The median response time in East Point, GA compared to nearest cities:
(Note: Based on data for all years, including only cities with at least 500 fire incidents)
| East Point: | 6 minutes |
| College Park: | 6 minutes |
| Hapeville: | 3 minutes |
| Forest Park: | 6 minutes |
| Atlanta: | 5 minutes |
| Riverdale: | 5 minutes |
| Union City: | 5 minutes |
| Morrow: | 5 minutes |
| Fairburn: | 6 minutes |
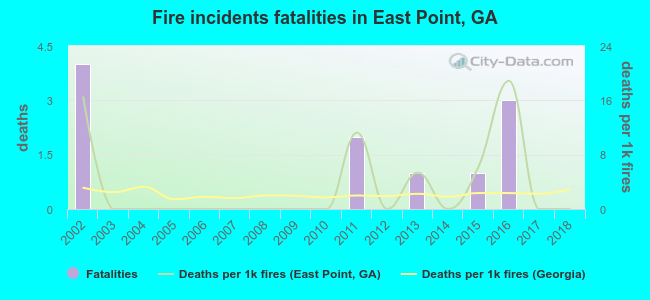 Based on the data from the years 2002 - 2018 the average number of fire-related yearly deaths is 1. The highest number of reported deaths - 4 took place in 2002, and the lowest - 0 in 2003. The data has a dropping trend.
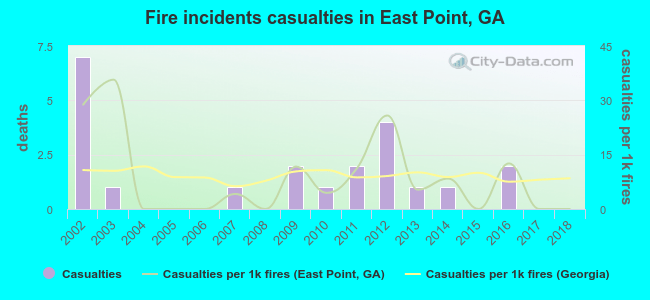 According to the data from the years 2002 - 2018 the average number of fire-related yearly casualties is 1. The highest number of casualties - 7 took place in 2002, and the lowest - 0 in 2004. The data has a declining trend.
The average number of casualties per 1,000 fire incidents is 9. This indicator was the highest - 36 in 2003, and the lowest 0 in 2004. The trend for casualties per 1,000 fire incidents is decreasing. Compared to the Georgia value the number of injuries per 1,000 fire incidents is about the same.
According to the data from the years 2002 - 2018 the average number of fire-related yearly casualties is 1. The highest number of casualties - 7 took place in 2002, and the lowest - 0 in 2004. The data has a declining trend.
The average number of casualties per 1,000 fire incidents is 9. This indicator was the highest - 36 in 2003, and the lowest 0 in 2004. The trend for casualties per 1,000 fire incidents is decreasing. Compared to the Georgia value the number of injuries per 1,000 fire incidents is about the same.Casualties per 1,000 incidents in East Point, GA compared to nearest cities:
(Note: Based on data for all years, including only cities with at least 500 fire incidents)
| East Point: | 9.2 |
| College Park: | 4.6 |
| Hapeville: | 0.0 |
| Forest Park: | 36.9 |
| Atlanta: | 6.7 |
| Riverdale: | 10.6 |
| Union City: | 4.5 |
| Morrow: | 13.0 |
| Fairburn: | 7.5 |
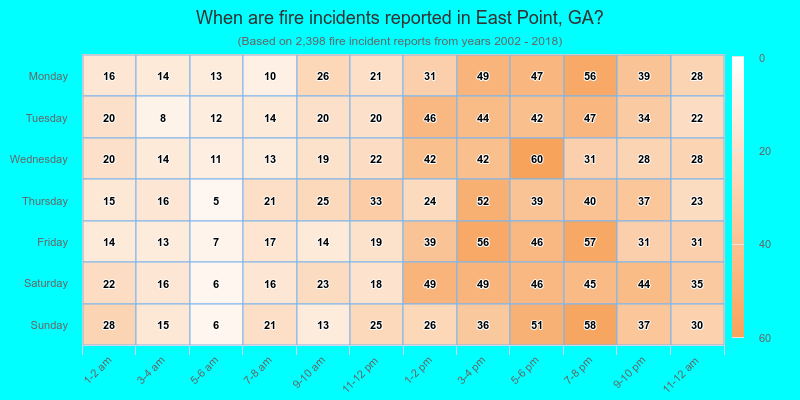
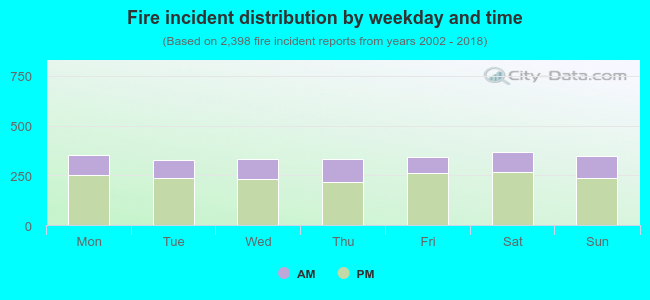 29.2% incidents where reported in the morning and 70.8% in the evening. The most fires (15.4%) took place on Saturday, and the least (13.7%) on Tuesday.
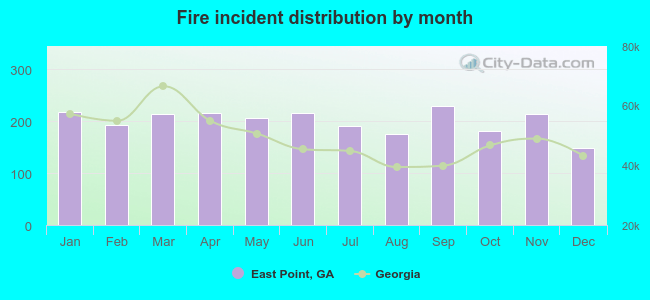 According to the 2,398 reports from years 2002 - 2018 most fires (9.6%) took place during September, and the least (6.2%) in December.
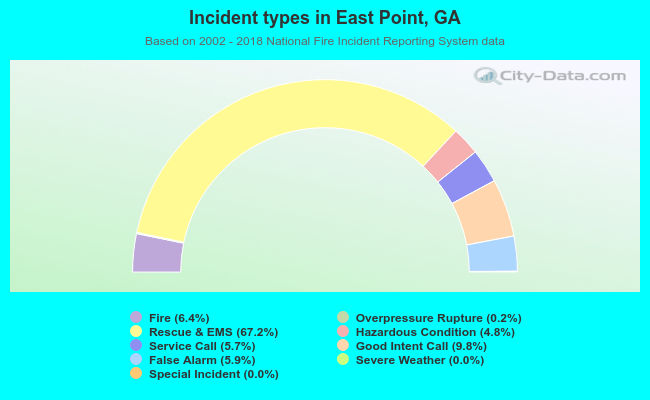 Out of all 37,333 cases reported during the years 2002 - 2018, the most belonged to the categories: Rescue & EMS (67.2%), Good Intent Call (9.8%), and Fire (6.4%).
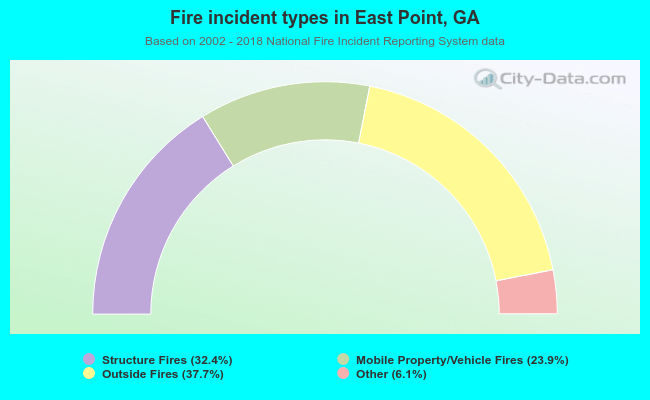 When looking into fire subcategories, the most incidents belonged to: Outside Fires (37.7%), and Structure Fires (32.4%).