Dunbar: Fire Incidents, West Virginia (WV)
Where are fire incidents reported in Dunbar, WV
Something went wrong! Please refresh the page.
|
| |||||||||||||||||||||||||||||||||||||||||||||||||||||||||||||||||||||||||||||||||||||||||||||||||||||||||||||
| Other | 262 | |||||||||||||||||||||||||||||||||||||||||||||||||||||||||||||||||||||||||||||||||||||||||||||||||||||||||||||
2004 - 2018 National Fire Incident Reporting System (NFIRS) incidents
- Incident types reported to NFIRS in Dunbar, WV
- 2,54147.4%Rescue & EMS
- 1,11920.9%Hazardous Condition
- 59211.0%Good Intent Call
- 4708.8%Fire
- 4037.5%False Alarm
- 2374.4%Service Call
- Fire incident types reported to NFIRS in Dunbar, WV
- 25754.7%Structure Fires
- 11624.7%Outside Fires
- 8918.9%Mobile Property/Vehicle Fires
- 81.7%Other
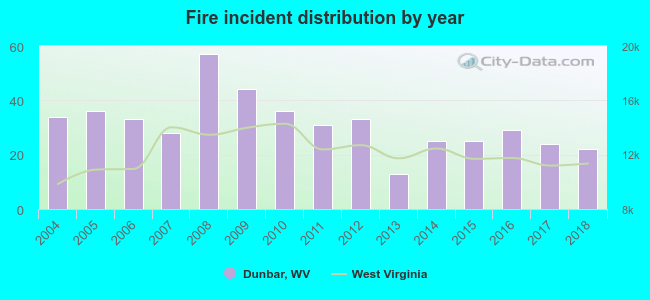 According to the data from the years 2004 - 2018 the average number of fire incidents per year is 31. The highest number of reported fire incidents - 57 took place in 2008, and the least - 13 in 2013. The data has a dropping trend.
The average number of yearly fire incidents per 10k residents in Dunbar, WV compared to nearest cities:
(Note: Based on data for the last 3 years, including only cities with population 5,000 and above)
| Dunbar: | 32.3 |
| South Charleston: | 38.8 |
| Cross Lanes: | 64.7 |
| Charleston: | 174.3 |
| Nitro: | 89.7 |
| Teays Valley: | 4.8 |
| Hurricane: | 93.8 |

 Based on the data from the years 2004 - 2018 the average number of fire-related yearly casualties is 0. The highest number of injuries - 1 took place in 2004, and the lowest - 0 in 2005. The data has a constant trend.
 32.1% incidents where reported in the morning and 67.9% in the evening. The most fires (15.5%) took place on Saturday, and the least (12.3%) on Friday.
 Based on the 470 fire incidents from years 2004 - 2018 most fires (10.2%) took place during May, and the least (5.7%) in July.
 Out of all 5,364 cases reported during the years 2004 - 2018, the most belonged to the categories: Rescue & EMS (47.4%), Hazardous Condition (20.9%), and Good Intent Call (11.0%).
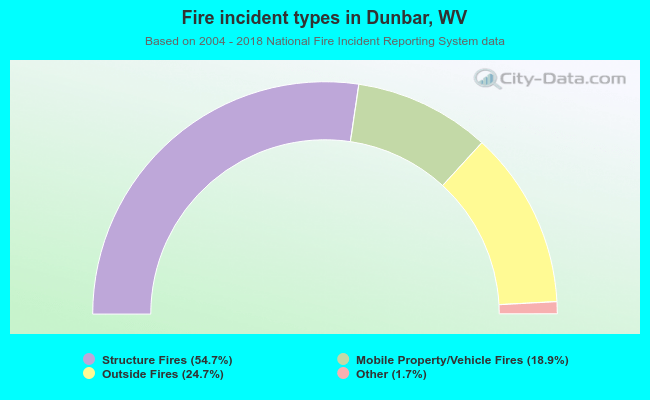 When looking into fire subcategories, the most reports belonged to: Structure Fires (54.7%), and Outside Fires (24.7%).