Dickinson: Fire Incidents, North Dakota (ND)
Where are fire incidents reported in Dickinson, ND
Something went wrong! Please refresh the page.
| Fire incidents reported | |
|---|---|
| Sreet name | Count |
| WEST VILLARD | 68 |
| 3RD AVENUE WEST | 62 |
| 6TH AVENUE WEST | 46 |
| 15TH STREET WEST | 32 |
| 21ST STREET WEST | 30 |
| 4TH AVENUE EAST | 28 |
| WEST BROADWAY | 28 |
| ROUGHRIDER BOULEVARD | 26 |
| 14TH STREET WEST | 24 |
| 26TH STREET WEST | 24 |
| 29TH STREET WEST | 24 |
| 4TH STREET WEST | 24 |
| SIMS | 24 |
| 10TH AVENUE WEST | 22 |
| 2ND AVENUE EAST | 22 |
| EAST BROADWAY | 22 |
| MUSEUM DRIVE | 22 |
| 23RD STREET WEST | 20 |
| 10TH AVENUE EAST | 18 |
| 24TH STREET WEST | 18 |
| 12TH STREET WEST | 16 |
| 5TH AVENUE WEST | 16 |
| I94 BUSINESS LOOP EAST | 16 |
| MIKE STREET | 16 |
| PARK AVENUE | 16 |
| EAST VILLARD | 14 |
| ENERGY DRIVE | 14 |
| STATE AVENUE | 14 |
| 1ST STREET WEST | 12 |
| 4TH AVENUE WEST | 12 |
| Other | 517 |
2002 - 2018 National Fire Incident Reporting System (NFIRS) incidents
- Incident types reported to NFIRS in Dickinson, ND
- 1,81631.0%Good Intent Call
- 1,24721.3%Fire
- 1,17420.0%Hazardous Condition
- 81313.9%False Alarm
- 4097.0%Service Call
- 3365.7%Rescue & EMS
- 530.9%Special Incident
- 80.1%Overpressure Rupture
- Fire incident types reported to NFIRS in Dickinson, ND
- 51441.2%Structure Fires
- 50140.2%Outside Fires
- 18815.1%Mobile Property/Vehicle Fires
- 443.5%Other
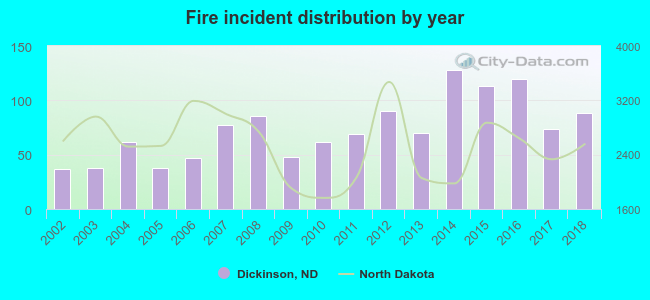 Based on the data from the years 2002 - 2018 the average number of fires per year is 73. The highest number of reported fires - 128 took place in 2014, and the least - 37 in 2002. The data has a rising trend.
The average number of yearly fire incidents per 10k residents in Dickinson, ND compared to nearest cities:
(Note: Based on data for the last 3 years, including only cities with population 5,000 and above)
| Dickinson: | 42.1 |
| Mandan: | 40.0 |
 The median response time based on all reported fire incidents is 7 minutes. This is close to the North Dakota median value.
 31.5% incidents where reported in the morning and 68.5% in the evening. The most fires (15.8%) took place on Wednesday, and the least (13.5%) on Tuesday.
 According to the 1,247 reports from years 2002 - 2018 most fires (14.4%) took place during July, and the least (4.8%) in January.
 Out of all 5,860 cases reported during the years 2002 - 2018, the most belonged to the categories: Good Intent Call (31.0%), Fire (21.3%), and Hazardous Condition (20.0%).
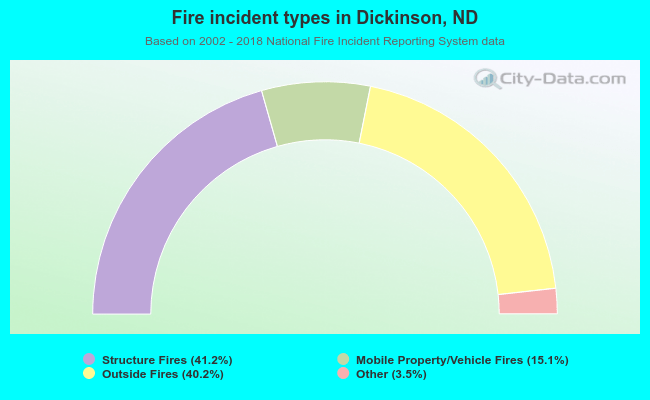 When looking into fire subcategories, the most reports belonged to: Structure Fires (41.2%), and Outside Fires (40.2%).