Colleyville: Fire Incidents, Texas (TX)
Where are fire incidents reported in Colleyville, TX
Something went wrong! Please refresh the page.
| Fire incidents reported | |
|---|---|
| Sreet name | Count |
| MUTUAL AID-COLLEYVILLE | 120 |
| COLLEYVILLE BLVD | 88 |
| GLADE RD | 68 |
| MUTUAL AIDCOLLEYVILLE | 56 |
| HERITAGE AVE | 48 |
| COLLEYVILLE BLVD | 34 |
| BRANSFORD RD | 20 |
| HALL JOHNSON RD | 20 |
| OAK KNOLL DR | 20 |
| EMERALD CT | 16 |
| ZCOLLEYVILLE | 16 |
| PRECINCT LINE RD | 14 |
| BALLANTRAE DR | 12 |
| GLADE RD | 12 |
| HWY 121 | 12 |
| TINKER RD | 12 |
| FALCON CT | 10 |
| HERITAGE AVE | 10 |
| KINGSTON DR | 10 |
| MAIN ST | 10 |
| PLANTATION DR | 10 |
| PLEASANT RUN RD | 10 |
| ALLENDALE ST | 8 |
| BALLANTRAE | 8 |
| CARLISLE | 8 |
| CEDAR CT | 8 |
| CHEEK SPARGER RD | 8 |
| COLLINS PATH | 8 |
| GATEWAY DR | 8 |
| HAWTHORNE AVE | 8 |
| Other | 209 |
2002 - 2018 National Fire Incident Reporting System (NFIRS) incidents
- Incident types reported to NFIRS in Colleyville, TX
- 4,62748.1%Rescue & EMS
- 1,19312.4%Good Intent Call
- 1,11511.6%False Alarm
- 1,01110.5%Hazardous Condition
- 9019.4%Fire
- 7417.7%Service Call
- 170.2%Severe Weather
- Fire incident types reported to NFIRS in Colleyville, TX
- 61468.1%Structure Fires
- 23125.6%Outside Fires
- 455.0%Mobile Property/Vehicle Fires
- 111.2%Other
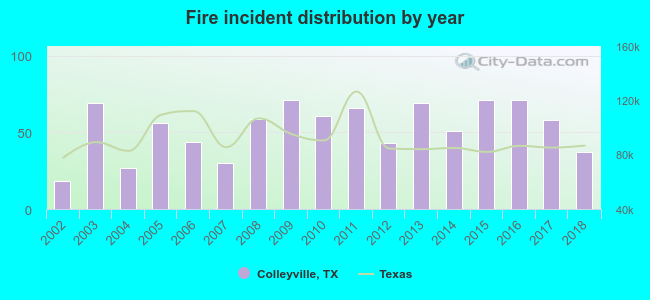 According to the data from the years 2002 - 2018 the average number of fires per year is 53. The highest number of fire incidents - 71 took place in 2009, and the least - 18 in 2002. The data has a rising trend.
The average number of yearly fire incidents per 10k residents in Colleyville, TX compared to nearest cities:
(Note: Based on data for the last 3 years, including only cities with population 5,000 and above)
| Colleyville: | 22.2 |
| Bedford: | 29.2 |
| Hurst: | 28.8 |
| Euless: | 29.7 |
| Southlake: | 28.4 |
| North Richland Hills: | 22.3 |
| Grapevine: | 35.5 |
| Keller: | 24.5 |
| Watauga: | 29.2 |
 The median response time based on all reported fire incidents is 7 minutes. This is close to the state median value.
The median response time in Colleyville, TX compared to nearest cities:
(Note: Based on data for all years, including only cities with at least 500 fire incidents)
| Colleyville: | 7 minutes |
| Bedford: | 4 minutes |
| Hurst: | 5 minutes |
| Euless: | 5 minutes |
| Southlake: | 6 minutes |
| North Richland Hills: | 6 minutes |
| Grapevine: | 5 minutes |
| Keller: | 6 minutes |
| Watauga: | 6 minutes |
 38.8% incidents where reported in the morning and 61.2% in the evening. The most fires (16.3%) took place on Sunday, and the least (10.8%) on Friday.
 According to the 901 fires from years 2002 - 2018 most fires (12.5%) took place during January, and the least (4.3%) in November.
 Out of all 9,618 cases reported during the years 2002 - 2018, the most belonged to the categories: Rescue & EMS (48.1%), Good Intent Call (12.4%), and False Alarm (11.6%).
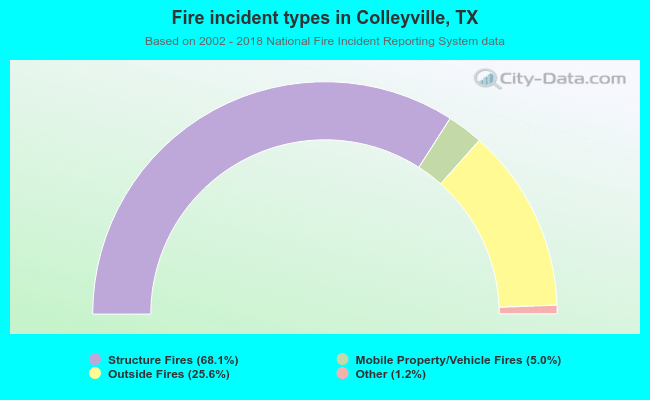 When looking into fire subcategories, the most reports belonged to: Structure Fires (68.1%), and Outside Fires (25.6%).