Chalmette: Fire Incidents, Louisiana (LA)
Where are fire incidents reported in Chalmette, LA
Something went wrong! Please refresh the page.
| Fire incidents reported | |
|---|---|
| Sreet name | Count |
| JUDGE PEREZ DR | 252 |
| PARIS RD | 186 |
| JUDGE PEREZ | 90 |
| ST BERNARD HWY | 68 |
| GOLDEN DR | 48 |
| PARIS | 40 |
| PLANTATION AVE | 40 |
| CHARLES DR | 34 |
| LIVINGSTON AVE | 34 |
| GALLO DR | 30 |
| PATRICIA ST | 30 |
| PLAZA DR | 30 |
| PAKENHAM DR | 28 |
| ST. BERNARD HWY | 28 |
| LAPLACE ST | 26 |
| MUMPHREY RD | 26 |
| VIRTUE ST | 26 |
| JACKSON BLVD | 24 |
| JUPITER DR | 24 |
| LYNDELL DR | 24 |
| GENIE ST | 22 |
| JEAN LAFITTE PKY | 22 |
| JUNO DR | 22 |
| OLD HICKORY AVE | 22 |
| PLANTATION | 22 |
| RIVERLAND DR | 22 |
| CHALMETTE CIR | 20 |
| JACOB DR | 20 |
| KAREN DR | 20 |
| LLOYDS AVE | 20 |
| Other | 304 |
2002 - 2018 National Fire Incident Reporting System (NFIRS) incidents
- Incident types reported to NFIRS in Chalmette, LA
- 5,57158.3%Rescue & EMS
- 1,60416.8%Fire
- 7527.9%Service Call
- 7057.4%False Alarm
- 5225.5%Good Intent Call
- 3904.1%Hazardous Condition
- Fire incident types reported to NFIRS in Chalmette, LA
- 79849.8%Outside Fires
- 52832.9%Structure Fires
- 25916.1%Mobile Property/Vehicle Fires
- 191.2%Other
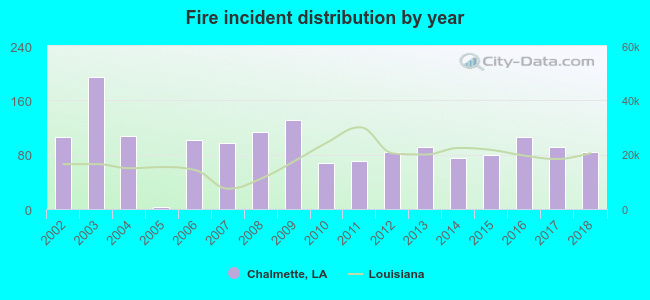 According to the data from the years 2002 - 2018 the average number of fires per year is 94. The highest number of reported fire incidents - 194 took place in 2003, and the least - 3 in 2005. The data has a dropping trend.
The average number of yearly fire incidents per 10k residents in Chalmette, LA compared to nearest cities:
(Note: Based on data for the last 3 years, including only cities with population 5,000 and above)
| Chalmette: | 55.9 |
| Meraux: | 44.7 |
| Terrytown: | 46.7 |
| Gretna: | 38.5 |
| New Orleans: | 17.3 |
| Belle Chasse: | 59.7 |
| Harvey: | 77.3 |
| Marrero: | 60.6 |
| Westwego: | 38.6 |
 The median response time based on all reported fire incidents is 4 minutes. This is lower compared to the Louisiana median value.
The median response time in Chalmette, LA compared to nearest cities:
(Note: Based on data for all years, including only cities with at least 500 fire incidents)
| Chalmette: | 4 minutes |
| Violet: | 4 minutes |
| Terrytown: | 4 minutes |
| Gretna: | 3 minutes |
| New Orleans: | 5 minutes |
| Belle Chasse: | 4 minutes |
| Harvey: | 4 minutes |
| Marrero: | 4 minutes |
| Westwego: | 2 minutes |
 Based on the data from the years 2002 - 2018 the average number of fire-related yearly deaths is 0. The highest number of reported deaths - 3 took place in 2004, and the lowest - 0 in 2003. The data has a constant trend.
 Based on the reports from the years 2002 - 2018 the average number of fire-related casualties per year is 1. The highest number of casualties - 4 took place in 2002, and the lowest - 0 in 2005. The data has a decreasing trend.
The average number of casualties per 1,000 fire incidents is 12. This indicator was the highest - 48 in 2012, and the lowest 0 in 2005. The trend for casualties per 1,000 fires is dropping. Compared to the state value the number of injuries per 1,000 incidents is much higher.
Based on the reports from the years 2002 - 2018 the average number of fire-related casualties per year is 1. The highest number of casualties - 4 took place in 2002, and the lowest - 0 in 2005. The data has a decreasing trend.
The average number of casualties per 1,000 fire incidents is 12. This indicator was the highest - 48 in 2012, and the lowest 0 in 2005. The trend for casualties per 1,000 fires is dropping. Compared to the state value the number of injuries per 1,000 incidents is much higher.Casualties per 1,000 incidents in Chalmette, LA compared to nearest cities:
(Note: Based on data for all years, including only cities with at least 500 fire incidents)
| Chalmette: | 12.5 |
| Violet: | 17.4 |
| Terrytown: | 11.6 |
| Gretna: | 4.7 |
| New Orleans: | 3.7 |
| Belle Chasse: | 8.3 |
| Harvey: | 7.9 |
| Marrero: | 3.4 |
| Westwego: | 7.5 |
 30.1% incidents where reported in the morning and 69.9% in the evening. The most fires (15.2%) took place on Friday, and the least (13.2%) on Sunday.
 Based on the 1,604 fire incidents from years 2002 - 2018 most fires (10.8%) took place during January, and the least (4.9%) in September.
 Out of all 9,553 cases reported during the years 2002 - 2018, the most belonged to the categories: Rescue & EMS (58.3%), Fire (16.8%), and Service Call (7.9%).
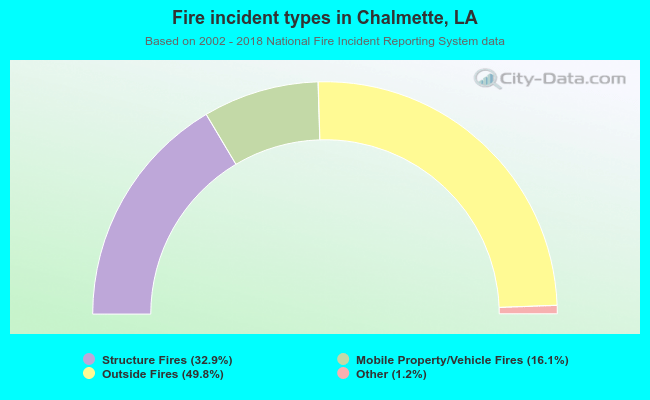 When looking into fire subcategories, the most incidents belonged to: Outside Fires (49.8%), and Structure Fires (32.9%).