Cartersville: Fire Incidents, Georgia (GA)
Where are fire incidents reported in Cartersville, GA
Something went wrong! Please refresh the page.
| Fire incidents reported | |
|---|---|
| Sreet name | Count |
| JOE FRANK HARRIS PKY | 250 |
| INTERSTATE 75 | 218 |
| MAIN ST | 148 |
| TENNESSEE ST | 146 |
| CASSVILLE RD | 140 |
| OLD MILL RD | 132 |
| WEST AVE | 112 |
| ERWIN ST | 104 |
| BURNT HICKORY RD | 72 |
| HIGHWAY 20 | 70 |
| EUHARLEE RD | 68 |
| INTERSTATE 75 NORTH | 60 |
| HIGHWAY 411 NORTH | 58 |
| FELTON RD | 56 |
| JONES MILL RD | 56 |
| MAC JOHNSON RD | 54 |
| UNLISTED STREET | 52 |
| JFH PKWY | 50 |
| MARKET PLACE BLVD | 48 |
| SMILEY INGRAM ROAD | 48 |
| INTERSTATE 75 SOUTH | 46 |
| GRASSDALE RD | 44 |
| PEEPLES VALLEY RD | 44 |
| HIGHWAY 411 | 42 |
| SUGAR VALLEY RD | 40 |
| DOUTHIT FERRY RD | 38 |
| DIXIE AVE | 36 |
| GILREATH RD | 34 |
| MISSION RD | 34 |
| DOUGLAS ST | 32 |
| Other | 1,885 |
2002 - 2018 National Fire Incident Reporting System (NFIRS) incidents
- Incident types reported to NFIRS in Cartersville, GA
- 22,76055.4%Rescue & EMS
- 4,55311.1%Service Call
- 4,21710.3%Fire
- 3,9699.7%Good Intent Call
- 3,3018.0%Hazardous Condition
- 2,1625.3%False Alarm
- 540.1%Overpressure Rupture
- Fire incident types reported to NFIRS in Cartersville, GA
- 2,07149.1%Outside Fires
- 1,26229.9%Structure Fires
- 79818.9%Mobile Property/Vehicle Fires
- 862.0%Other
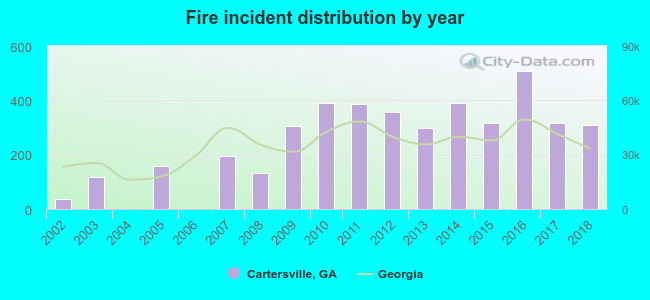 Based on the data from the years 2002 - 2018 the average number of fires per year is 248. The highest number of reported fire incidents - 509 took place in 2016, and the least - 0 in 2004. The data has a growing trend.
The average number of yearly fire incidents per 10k residents in Cartersville, GA compared to nearest cities:
(Note: Based on data for the last 3 years, including only cities with population 5,000 and above)
| Cartersville: | 188.9 |
| Acworth: | 85.7 |
| Kennesaw: | 49.7 |
| Woodstock: | 75.2 |
| Holly Springs: | 34.8 |
| Dallas: | 203.0 |
| Canton: | 94.2 |
| Marietta: | 90.3 |
| Rome: | 120.7 |
 The median response time based on all reported fire incidents is 6 minutes. This is similar to the state median value.
The median response time in Cartersville, GA compared to nearest cities:
(Note: Based on data for all years, including only cities with at least 500 fire incidents)
| Cartersville: | 6 minutes |
| Acworth: | 7 minutes |
| Kennesaw: | 6 minutes |
| Adairsville: | 9 minutes |
| Woodstock: | 7 minutes |
| Dallas: | 7 minutes |
| Canton: | 8 minutes |
| Rockmart: | 8 minutes |
| Hiram: | 7 minutes |
 According to the data from the years 2002 - 2018 the average number of fire-related fatalities per year is 1. The highest number of reported deaths - 3 took place in 2014, and the lowest - 0 in 2002. The data has a rising trend.
The average number of fatalities per 1,000 fire incidents is 2. This indicator was the highest - 9 in 2017, and the lowest 0 in 2002. The trend for deaths per 1,000 fire incidents is increasing. Compared to the state value the number of fatalities per 1,000 fire incidents is higher.
According to the data from the years 2002 - 2018 the average number of fire-related fatalities per year is 1. The highest number of reported deaths - 3 took place in 2014, and the lowest - 0 in 2002. The data has a rising trend.
The average number of fatalities per 1,000 fire incidents is 2. This indicator was the highest - 9 in 2017, and the lowest 0 in 2002. The trend for deaths per 1,000 fire incidents is increasing. Compared to the state value the number of fatalities per 1,000 fire incidents is higher.
 Based on the data from the years 2002 - 2018 the average number of fire-related yearly casualties is 4. The highest number of reported casualties - 10 took place in 2014, and the lowest - 0 in 2004. The data has an increasing trend.
The average number of injuries per 1,000 fire incidents is 14. This indicator was the highest - 54 in 2002, and the lowest 0 in 2004. The trend for casualties per 1,000 incidents is decreasing. Compared to the Georgia value the number of casualties per 1,000 incidents is higher.
Based on the data from the years 2002 - 2018 the average number of fire-related yearly casualties is 4. The highest number of reported casualties - 10 took place in 2014, and the lowest - 0 in 2004. The data has an increasing trend.
The average number of injuries per 1,000 fire incidents is 14. This indicator was the highest - 54 in 2002, and the lowest 0 in 2004. The trend for casualties per 1,000 incidents is decreasing. Compared to the Georgia value the number of casualties per 1,000 incidents is higher.
 27.8% incidents where reported in the morning and 72.2% in the evening. The most fires (15.1%) took place on Saturday, and the least (13.7%) on Monday.
 Based on the 4,217 incident reports from years 2002 - 2018 most fires (10.5%) took place during March, and the least (6.7%) in June.
 Out of all 41,071 cases reported during the years 2002 - 2018, the most belonged to the categories: Rescue & EMS (55.4%), Service Call (11.1%), and Fire (10.3%).
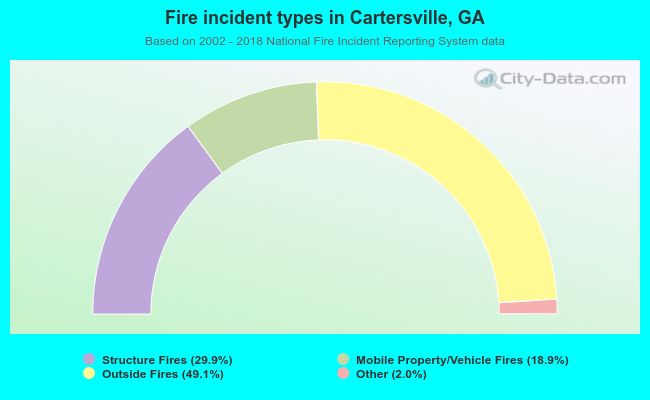 When looking into fire subcategories, the most reports belonged to: Outside Fires (49.1%), and Structure Fires (29.9%).