Calera: Fire Incidents, Alabama (AL)
Where are fire incidents reported in Calera, AL
Something went wrong! Please refresh the page.
|
| |||||||||||||||||||||||||||||||||||||||||||||||||||||||||||||||||||||||||||||||||||||||||||||||||||||||||||||
2005 - 2018 National Fire Incident Reporting System (NFIRS) incidents
- Incident types reported to NFIRS in Calera, AL
- 5,28759.0%Rescue & EMS
- 1,12612.6%Service Call
- 91910.3%Fire
- 8049.0%Good Intent Call
- 4124.6%False Alarm
- 3594.0%Hazardous Condition
- 270.3%Special Incident
- 220.2%Severe Weather
- Fire incident types reported to NFIRS in Calera, AL
- 36840.0%Outside Fires
- 25928.2%Structure Fires
- 21123.0%Mobile Property/Vehicle Fires
- 818.8%Other
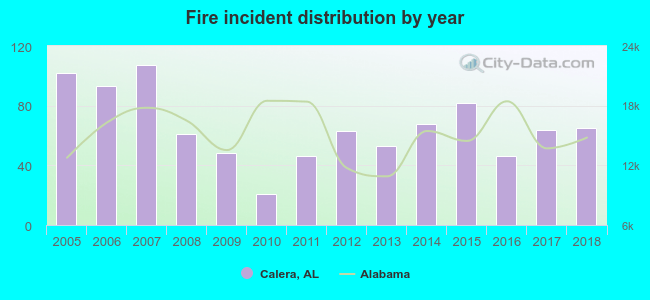 According to the data from the years 2005 - 2018 the average number of fire incidents per year is 66. The highest number of fire incidents - 107 took place in 2007, and the least - 21 in 2010. The data has a dropping trend.
The average number of yearly fire incidents per 10k residents in Calera, AL compared to nearest cities:
(Note: Based on data for the last 3 years, including only cities with population 5,000 and above)
| Calera: | 45.0 |
| Montevallo: | 41.9 |
| Alabaster: | 26.4 |
| Helena: | 3.4 |
| Pelham: | 33.9 |
| Chelsea: | 40.3 |
| Hoover: | 8.0 |
| Clanton: | 160.4 |
| Vestavia Hills: | 20.2 |
 The median response time based on all reported fire incidents is 6 minutes. This is close to the state median value.
The median response time in Calera, AL compared to nearest cities:
(Note: Based on data for all years, including only cities with at least 500 fire incidents)
| Calera: | 6 minutes |
| Alabaster: | 6 minutes |
| Jemison: | 10 minutes |
| Pelham: | 5 minutes |
| Hoover: | 5 minutes |
| Clanton: | 7 minutes |
| Vestavia Hills: | 4 minutes |
| Bessemer: | 5 minutes |
| Homewood: | 6 minutes |
 According to the data from the years 2005 - 2018 the average number of fire-related fatalities per year is 0. The highest number of deaths - 1 took place in 2005, and the lowest - 0 in 2006. The data has a declining trend.
 27.6% incidents where reported in the morning and 72.4% in the evening. The most fires (16.4%) took place on Saturday, and the least (12.3%) on Tuesday.
 According to the 919 fire incidents from years 2005 - 2018 most fires (11.5%) took place during March, and the least (5.9%) in September.
 Out of all 8,960 cases reported during the years 2005 - 2018, the most belonged to the categories: Rescue & EMS (59.0%), Service Call (12.6%), and Fire (10.3%).
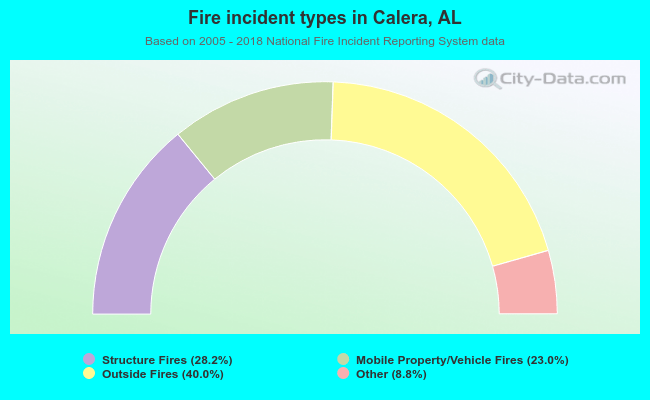 When looking into fire subcategories, the most incidents belonged to: Outside Fires (40.0%), and Structure Fires (28.2%).