Brunswick: Fire Incidents, New York (NY)
Where are fire incidents reported in Brunswick, NY
Something went wrong! Please refresh the page.
|
| |||||||||||||||||||||||||||||||||||||||||||||||||||||||||||||||||||||||||||||||||||||||||||||||||||||||||||||
2003 - 2018 National Fire Incident Reporting System (NFIRS) incidents
- Incident types reported to NFIRS in Brunswick, NY
- 2,14655.6%Rescue & EMS
- 63816.5%Hazardous Condition
- 39910.3%False Alarm
- 3057.9%Service Call
- 2025.2%Good Intent Call
- 1413.7%Fire
- 130.3%Special Incident
- 120.3%Severe Weather
- Fire incident types reported to NFIRS in Brunswick, NY
- 6445.4%Structure Fires
- 4330.5%Outside Fires
- 1913.5%Mobile Property/Vehicle Fires
- 1510.6%Other
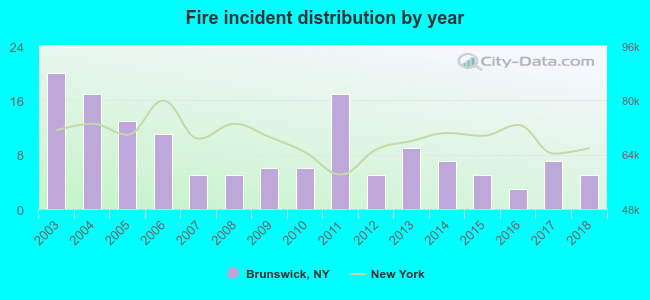 Based on the data from the years 2003 - 2018 the average number of fires per year is 9. The highest number of reported fires - 20 took place in 2003, and the least - 3 in 2016. The data has a dropping trend.
The average number of yearly fire incidents per 10k residents in Brunswick, NY compared to nearest cities:
(Note: Based on data for the last 3 years, including only cities with population 5,000 and above)
| Brunswick: | 4.2 |
| Troy: | 17.2 |
| Watervliet: | 23.5 |
| Cohoes: | 42.8 |
| Sand Lake: | 6.4 |
| Rensselaer: | 136.6 |
| Halfmoon: | 15.6 |
| Albany: | 50.8 |
| Pittstown: | 2.3 |

 30.5% incidents where reported in the morning and 69.5% in the evening. The most fires (19.9%) took place on Monday, and the least (12.1%) on Saturday.
 According to the 141 fire incidents from years 2003 - 2018 most fires (17.0%) took place during April, and the least (3.5%) in August.
 Out of all 3,858 cases reported during the years 2003 - 2018, the most belonged to the categories: Rescue & EMS (55.6%), Hazardous Condition (16.5%), and False Alarm (10.3%).
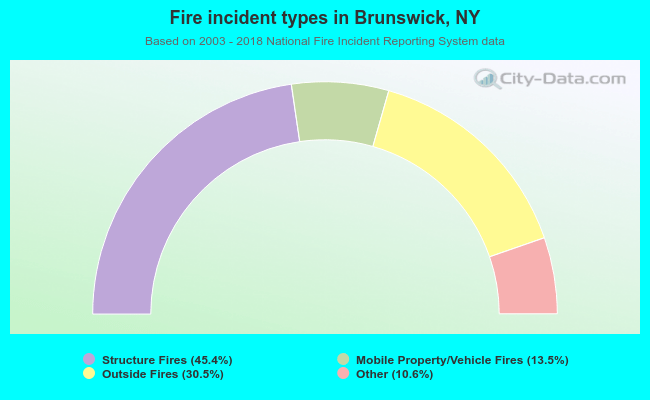 When looking into fire subcategories, the most reports belonged to: Structure Fires (45.4%), and Outside Fires (30.5%).