Bridge City: Fire Incidents, Louisiana (LA)
Where are fire incidents reported in Bridge City, LA
Something went wrong! Please refresh the page.
|
| |||||||||||||||||||||||||||||||||||||||||||||||||||||||||||||||||||||||||||||||||||||||||||||||||||||||||||||
2002 - 2018 National Fire Incident Reporting System (NFIRS) incidents
- Incident types reported to NFIRS in Bridge City, LA
- 28429.6%Fire
- 21322.2%Rescue & EMS
- 16917.6%Hazardous Condition
- 16016.6%Good Intent Call
- 10210.6%False Alarm
- 252.6%Service Call
- 40.4%Special Incident
- 30.3%Overpressure Rupture
- 10.1%Severe Weather
- Fire incident types reported to NFIRS in Bridge City, LA
- 14751.8%Structure Fires
- 7626.8%Outside Fires
- 4917.3%Mobile Property/Vehicle Fires
- 124.2%Other
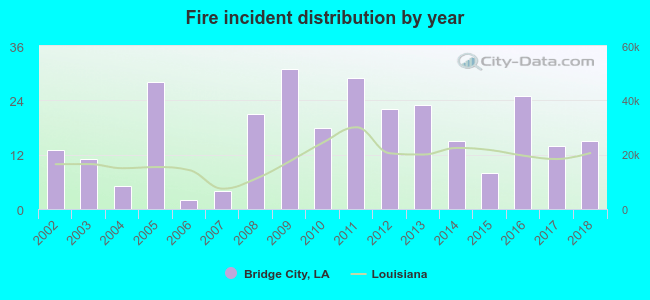 According to the data from the years 2002 - 2018 the average number of fire incidents per year is 17. The highest number of fire incidents - 31 took place in 2009, and the least - 2 in 2006. The data has a growing trend.
The average number of yearly fire incidents per 10k residents in Bridge City, LA compared to nearest cities:
(Note: Based on data for the last 3 years, including only cities with population 5,000 and above)
| Bridge City: | 23.4 |
| Westwego: | 38.6 |
| Harahan: | 3.9 |
| Jefferson: | 47.1 |
| Waggaman: | 26.3 |
| River Ridge: | 15.3 |
| Marrero: | 60.6 |
| Metairie: | 15.6 |
| Harvey: | 77.3 |

 36.6% incidents where reported in the morning and 63.4% in the evening. The most fires (17.6%) took place on Saturday, and the least (12.7%) on Friday.
 Based on the 284 fire incidents from years 2002 - 2018 most fires (12.0%) took place during December, and the least (6.0%) in January.
 Out of all 961 cases reported during the years 2002 - 2018, the most belonged to the categories: Fire (29.6%), Rescue & EMS (22.2%), and Hazardous Condition (17.6%).
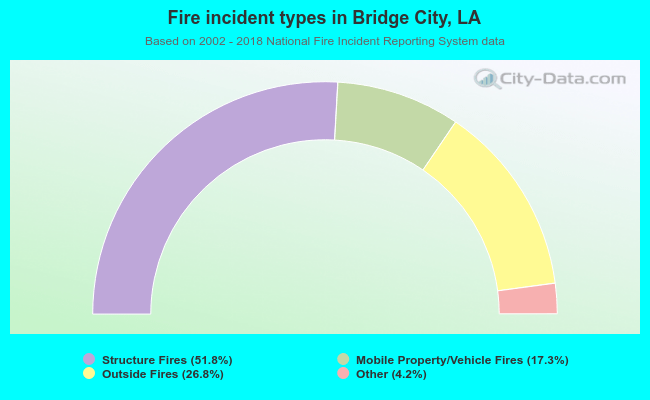 When looking into fire subcategories, the most reports belonged to: Structure Fires (51.8%), and Outside Fires (26.8%).