Brentwood: Fire Incidents, California (CA)
Where are fire incidents reported in Brentwood, CA
Something went wrong! Please refresh the page.
|
| |||||||||||||||||||||||||||||||||||||||||||||||||||||||||||||||||||||||||||||||||||||||||||||||||||||||||||||
2005 - 2018 National Fire Incident Reporting System (NFIRS) incidents
- Incident types reported to NFIRS in Brentwood, CA
- 5,16042.7%Rescue & EMS
- 2,32819.3%Good Intent Call
- 1,62213.4%Fire
- 1,54912.8%False Alarm
- 8977.4%Hazardous Condition
- 4884.0%Service Call
- 140.1%Special Incident
- Fire incident types reported to NFIRS in Brentwood, CA
- 69943.1%Outside Fires
- 55334.1%Structure Fires
- 21713.4%Mobile Property/Vehicle Fires
- 1539.4%Other
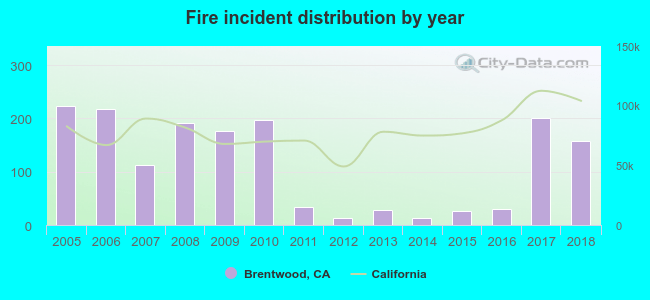 Based on the data from the years 2005 - 2018 the average number of fires per year is 116. The highest number of reported fires - 224 took place in 2005, and the least - 13 in 2014. The data has a decreasing trend.
The average number of yearly fire incidents per 10k residents in Brentwood, CA compared to nearest cities:
(Note: Based on data for the last 3 years, including only cities with population 5,000 and above)
| Brentwood: | 22.6 |
| Oakley: | 18.4 |
| Discovery Bay: | 23.6 |
| Antioch: | 36.2 |
| Tassajara: | 1.3 |
| Pittsburg: | 31.1 |
| Clayton: | 19.4 |
| Blackhawk: | 9.6 |
| Mountain House: | 3.8 |
 The median response time based on all reported fire incidents is 7 minutes. This is about the same as the state median value.
The median response time in Brentwood, CA compared to nearest cities:
(Note: Based on data for all years, including only cities with at least 500 fire incidents)
| Brentwood: | 7 minutes |
| Oakley: | 7 minutes |
| Antioch: | 6 minutes |
| Pittsburg: | 6 minutes |
| Bay Point: | 7 minutes |
| Rio Vista: | 7 minutes |
| Danville: | 6 minutes |
| Concord: | 6 minutes |
| Livermore: | 6 minutes |
 30.6% incidents where reported in the morning and 69.4% in the evening. The most fires (17.6%) took place on Saturday, and the least (12.5%) on Thursday.
 According to the 1,622 incident reports from years 2005 - 2018 most fires (13.6%) took place during July, and the least (5.3%) in February.
 Out of all 12,073 cases reported during the years 2005 - 2018, the most belonged to the categories: Rescue & EMS (42.7%), Good Intent Call (19.3%), and Fire (13.4%).
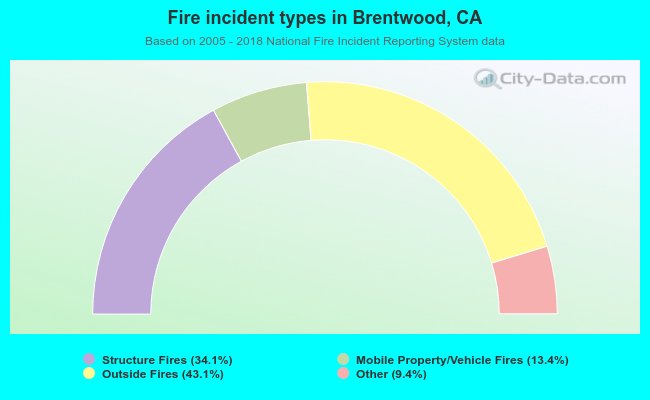 When looking into fire subcategories, the most reports belonged to: Outside Fires (43.1%), and Structure Fires (34.1%).