Bonita: Fire Incidents, California (CA)
Where are fire incidents reported in Bonita, CA
Something went wrong! Please refresh the page.
|
| |||||||||||||||||||||||||||||||||||||||||||||||||||||||||||||||||||||||||||||||||||||||||||||||||||||||||||||
2005 - 2018 National Fire Incident Reporting System (NFIRS) incidents
- Incident types reported to NFIRS in Bonita, CA
- 3,51775.5%Rescue & EMS
- 3517.5%Good Intent Call
- 3026.5%Service Call
- 1914.1%Fire
- 1453.1%Hazardous Condition
- 1372.9%False Alarm
- 70.2%Special Incident
- 60.1%Overpressure Rupture
- Fire incident types reported to NFIRS in Bonita, CA
- 6835.6%Structure Fires
- 6634.6%Outside Fires
- 4523.6%Mobile Property/Vehicle Fires
- 126.3%Other
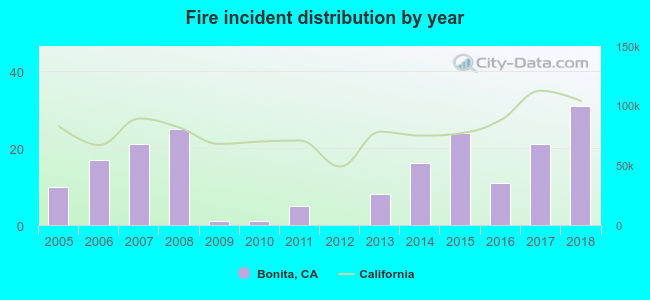 According to the data from the years 2005 - 2018 the average number of fires per year is 14. The highest number of reported fires - 31 took place in 2018, and the least - 0 in 2012. The data has a growing trend.
The average number of yearly fire incidents per 10k residents in Bonita, CA compared to nearest cities:
(Note: Based on data for the last 3 years, including only cities with population 5,000 and above)
| Bonita: | 16.7 |
| Chula Vista: | 9.6 |
| National City: | 27.8 |
| Lemon Grove: | 8.2 |
| Spring Valley: | 11.8 |
| Imperial Beach: | 14.2 |
| La Mesa: | 6.2 |
| Coronado: | 6.4 |
| Jamul: | 33.0 |

 28.3% incidents where reported in the morning and 71.7% in the evening. The most fires (17.8%) took place on Friday, and the least (11.5%) on Tuesday.
 Based on the 191 incident reports from years 2005 - 2018 most fires (12.0%) took place during June, and the least (4.7%) in February.
 Out of all 4,658 cases reported during the years 2005 - 2018, the most belonged to the categories: Rescue & EMS (75.5%), Good Intent Call (7.5%), and Service Call (6.5%).
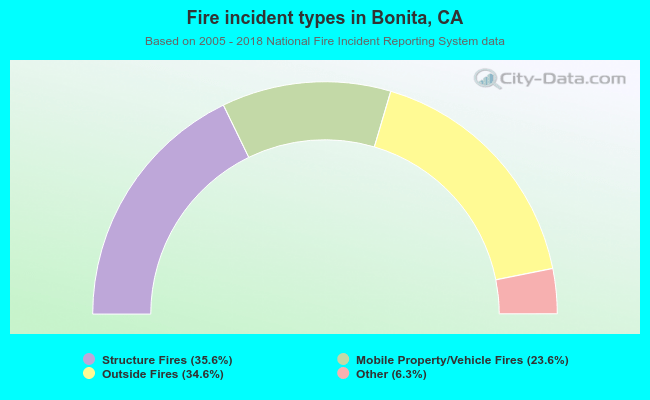 When looking into fire subcategories, the most reports belonged to: Structure Fires (35.6%), and Outside Fires (34.6%).