Blackwell: Fire Incidents, Oklahoma (OK)
Where are fire incidents reported in Blackwell, OK
Something went wrong! Please refresh the page.
|
| |||||||||||||||||||||||||||||||||||||||||||||||||||||||||||||||||||||||||||||||||||||||||||||||||||||||||||||
2002 - 2018 National Fire Incident Reporting System (NFIRS) incidents
- Incident types reported to NFIRS in Blackwell, OK
- 1,10663.7%Fire
- 19111.0%Hazardous Condition
- 1267.3%Good Intent Call
- 1136.5%Rescue & EMS
- 925.3%Service Call
- 844.8%False Alarm
- 140.8%Overpressure Rupture
- 80.5%Special Incident
- 30.2%Severe Weather
- Fire incident types reported to NFIRS in Blackwell, OK
- 66259.9%Outside Fires
- 21919.8%Structure Fires
- 16615.0%Mobile Property/Vehicle Fires
- 595.3%Other
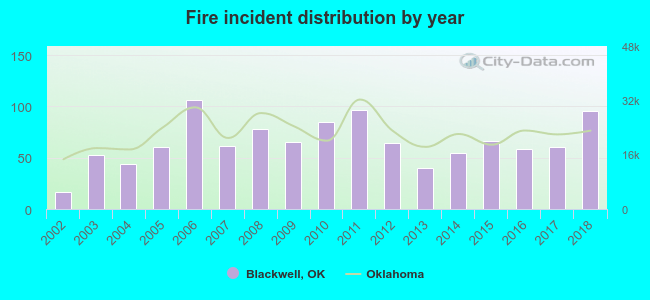 According to the data from the years 2002 - 2018 the average number of fires per year is 65. The highest number of reported fires - 106 took place in 2006, and the least - 17 in 2002. The data has a rising trend.
The average number of yearly fire incidents per 10k residents in Blackwell, OK compared to nearest cities:
(Note: Based on data for the last 3 years, including only cities with population 5,000 and above)
| Blackwell: | 103.6 |
| Ponca City: | 66.2 |
| Perry: | 113.0 |
| Enid: | 28.1 |
| Stillwater: | 18.3 |
 The median response time based on all reported fire incidents is 5 minutes. This is lower than the Oklahoma median value.
The median response time in Blackwell, OK compared to nearest cities:
(Note: Based on data for all years, including only cities with at least 500 fire incidents)
| Blackwell: | 5 minutes |
| Tonkawa: | 5 minutes |
| Ponca City: | 5 minutes |
| Arkansas City: | 7 minutes |
| Wellington: | 7 minutes |
| Winfield: | 8 minutes |
| Perry: | 8 minutes |
| Belle Plaine: | 11 minutes |
| Udall: | 8 minutes |
 25.2% incidents where reported in the morning and 74.8% in the evening. The most fires (15.6%) took place on Saturday, and the least (13.5%) on Wednesday.
 According to the 1,106 reports from years 2002 - 2018 most fires (11.3%) took place during July, and the least (4.1%) in May.
 Out of all 1,737 cases reported during the years 2002 - 2018, the most belonged to the categories: Fire (63.7%), Hazardous Condition (11.0%), and Good Intent Call (7.3%).
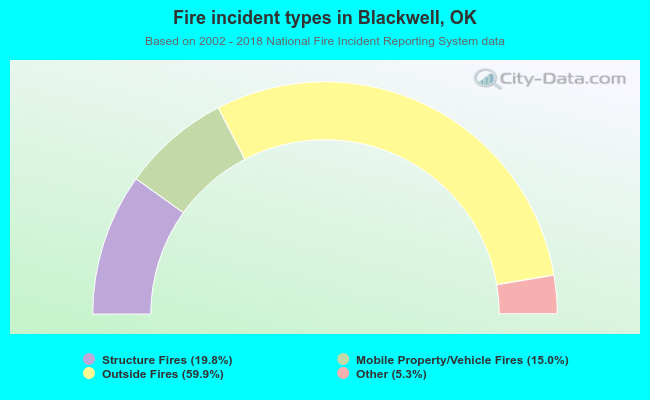 When looking into fire subcategories, the most reports belonged to: Outside Fires (59.9%), and Structure Fires (19.8%).