Beverly: Fire Incidents, Massachusetts (MA)
Where are fire incidents reported in Beverly, MA
Something went wrong! Please refresh the page.
| Fire incidents reported | |
|---|---|
| Sreet name | Count |
| CABOT STREET | 130 |
| HALE STREET | 108 |
| CABOT ST | 104 |
| RANTOUL STREET | 104 |
| HALE ST | 86 |
| ELLIOTT STREET | 84 |
| ELLIOTT ST | 76 |
| DODGE STREET | 70 |
| ESSEX ST | 64 |
| RANTOUL ST | 54 |
| SOHIER RD | 48 |
| ENON STREET | 44 |
| ESSEX STREET | 44 |
| BRIMBAL AVENUE | 34 |
| FOLGER AVENUE | 34 |
| PARK STREET | 34 |
| BRIMBAL AVE | 30 |
| PARK ST | 30 |
| HERRICK ST | 28 |
| BROADWAY | 24 |
| BROUGHTON DRIVE | 24 |
| LOTHROP ST | 24 |
| MCKAY STREET | 22 |
| BEVERLY COMMONS DRIVE | 20 |
| BRIDGE STREET | 20 |
| ENON ST | 20 |
| HERRICK STREET | 20 |
| FEDERAL STREET | 18 |
| MANOR RD | 18 |
| MILL STREET | 18 |
| Other | 247 |
2002 - 2018 National Fire Incident Reporting System (NFIRS) incidents
- Incident types reported to NFIRS in Beverly, MA
- 10,81246.8%Rescue & EMS
- 4,54119.6%False Alarm
- 2,98612.9%Hazardous Condition
- 1,6817.3%Fire
- 1,5626.8%Service Call
- 1,4196.1%Good Intent Call
- 580.3%Overpressure Rupture
- 480.2%Special Incident
- Fire incident types reported to NFIRS in Beverly, MA
- 86651.5%Structure Fires
- 59935.6%Outside Fires
- 1539.1%Mobile Property/Vehicle Fires
- 633.7%Other
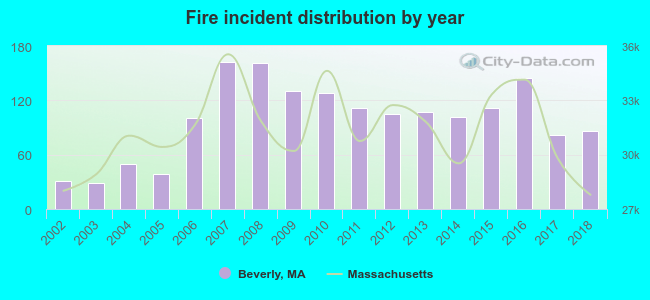 Based on the data from the years 2002 - 2018 the average number of fire incidents per year is 99. The highest number of fires - 162 took place in 2007, and the least - 29 in 2003. The data has a growing trend.
The average number of yearly fire incidents per 10k residents in Beverly, MA compared to nearest cities:
(Note: Based on data for the last 3 years, including only cities with population 5,000 and above)
| Beverly: | 25.5 |
| Salem: | 37.4 |
| Danvers: | 40.5 |
| Hamilton: | 21.5 |
| Marblehead: | 19.2 |
| Peabody: | 23.0 |
| Swampscott: | 28.8 |
| Lynn: | 45.3 |
| Middleton: | 34.9 |
 The median response time based on all reported fire incidents is 4 minutes. This is similar to the state median value.
The median response time in Beverly, MA compared to nearest cities:
(Note: Based on data for all years, including only cities with at least 500 fire incidents)
| Beverly: | 4 minutes |
| Salem: | 3 minutes |
| Danvers: | 5 minutes |
| Hamilton: | 5 minutes |
| Marblehead: | 4 minutes |
| Peabody: | 5 minutes |
| Swampscott: | 4 minutes |
| Topsfield: | 4 minutes |
| Lynn: | 4 minutes |
 Based on the data from the years 2002 - 2018 the average number of fire-related yearly deaths is 0. The highest number of reported deaths - 1 took place in 2011, and the lowest - 0 in 2002. The data has a constant trend.
 According to the reports from the years 2002 - 2018 the average number of fire-related yearly casualties is 1. The highest number of injuries - 4 took place in 2003, and the lowest - 0 in 2002. The data has a growing trend.
The average number of injuries per 1,000 fire incidents is 14. This indicator was the highest - 138 in 2003, and the lowest 0 in 2002. The trend for casualties per 1,000 fire incidents is increasing. Compared to the Massachusetts value the number of injuries per 1,000 fires is lower.
According to the reports from the years 2002 - 2018 the average number of fire-related yearly casualties is 1. The highest number of injuries - 4 took place in 2003, and the lowest - 0 in 2002. The data has a growing trend.
The average number of injuries per 1,000 fire incidents is 14. This indicator was the highest - 138 in 2003, and the lowest 0 in 2002. The trend for casualties per 1,000 fire incidents is increasing. Compared to the Massachusetts value the number of injuries per 1,000 fires is lower.Casualties per 1,000 incidents in Beverly, MA compared to nearest cities:
(Note: Based on data for all years, including only cities with at least 500 fire incidents)
| Beverly: | 8.3 |
| Salem: | 6.8 |
| Danvers: | 4.1 |
| Hamilton: | 10.0 |
| Marblehead: | 6.5 |
| Peabody: | 6.9 |
| Swampscott: | 6.5 |
| Topsfield: | 2.0 |
| Lynn: | 10.4 |
 33.1% incidents where reported in the morning and 66.9% in the evening. The most fires (15.6%) took place on Sunday, and the least (12.8%) on Wednesday.
 Based on the 1,681 reports from years 2002 - 2018 most fires (11.1%) took place during May, and the least (5.9%) in November.
 Out of all 23,126 cases reported during the years 2002 - 2018, the most belonged to the categories: Rescue & EMS (46.8%), False Alarm (19.6%), and Hazardous Condition (12.9%).
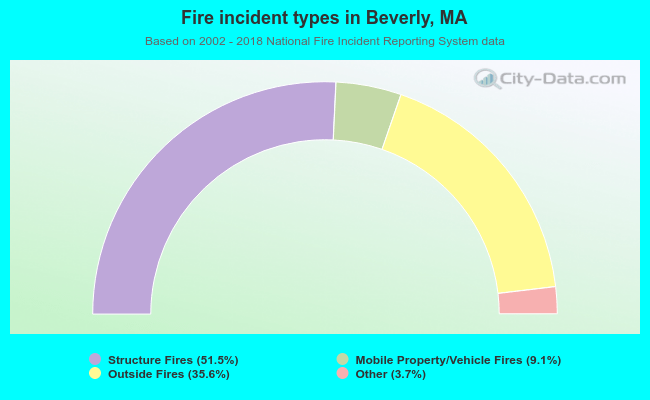 When looking into fire subcategories, the most reports belonged to: Structure Fires (51.5%), and Outside Fires (35.6%).