Berlin: Fire Incidents, New Jersey (NJ)
Where are fire incidents reported in Berlin, NJ
Something went wrong! Please refresh the page.
|
| |||||||||||||||||||||||||||||||||||||||||||||||||||||||||||||||||||||||||||||||||||||||||||||||||||||||||||||
2002 - 2018 National Fire Incident Reporting System (NFIRS) incidents
- Incident types reported to NFIRS in Berlin, NJ
- 1,46340.7%Hazardous Condition
- 79522.1%Good Intent Call
- 55915.5%Fire
- 39210.9%False Alarm
- 1905.3%Rescue & EMS
- 1875.2%Service Call
- 40.1%Special Incident
- Fire incident types reported to NFIRS in Berlin, NJ
- 36364.9%Structure Fires
- 11420.4%Outside Fires
- 6311.3%Mobile Property/Vehicle Fires
- 193.4%Other
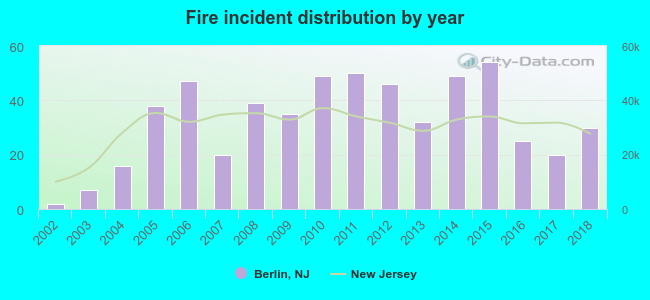 According to the data from the years 2002 - 2018 the average number of fires per year is 33. The highest number of reported fires - 54 took place in 2015, and the least - 2 in 2002. The data has a rising trend.
The average number of yearly fire incidents per 10k residents in Berlin, NJ compared to nearest cities:
(Note: Based on data for the last 3 years, including only cities with population 5,000 and above)
| Berlin: | 33.1 |
| Pine Hill: | 69.8 |
| Lindenwold: | 36.9 |
| Stratford: | 51.4 |
| Somerdale: | 85.5 |
| Marlton: | 8.6 |
| Williamstown: | 24.6 |
| Barrington: | 61.0 |
| Runnemede: | 46.2 |
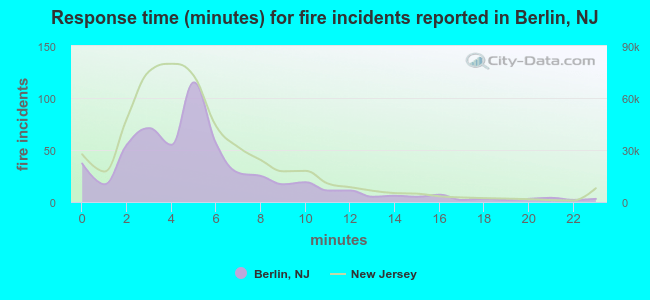 The median response time based on all reported fire incidents is 5 minutes. This is comparable to the state median value.
The median response time in Berlin, NJ compared to nearest cities:
(Note: Based on data for all years, including only cities with at least 500 fire incidents)
| Berlin: | 5 minutes |
| Pine Hill: | 6 minutes |
| Clementon: | 6 minutes |
| Lindenwold: | 7 minutes |
| Blackwood: | 6 minutes |
| Magnolia: | 6 minutes |
| Turnersville: | 7 minutes |
| Williamstown: | 8 minutes |
| Barrington: | 7 minutes |
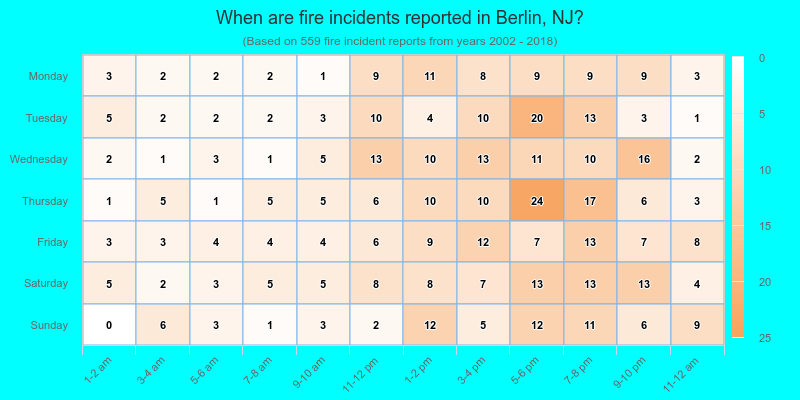
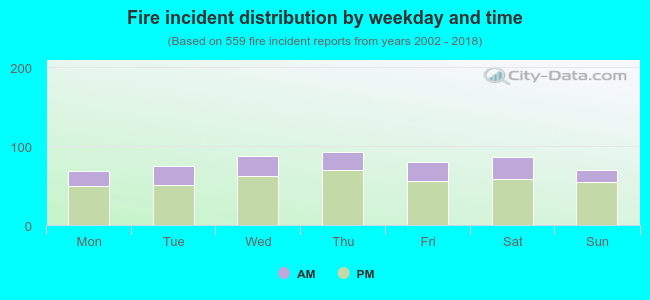 28.3% incidents where reported in the morning and 71.7% in the evening. The most fires (16.6%) took place on Thursday, and the least (12.2%) on Monday.
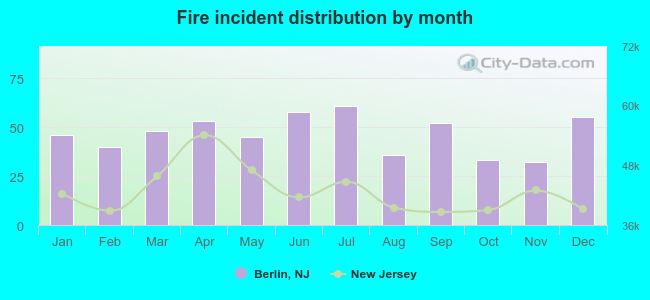 Based on the 559 fire incident reports from years 2002 - 2018 most fires (10.9%) took place during July, and the least (5.7%) in November.
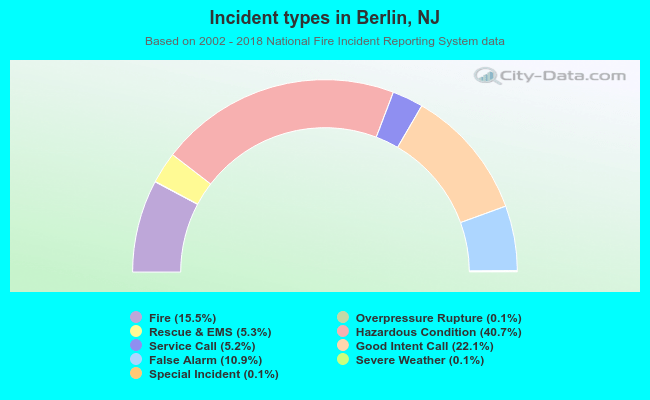 Out of all 3,595 cases reported during the years 2002 - 2018, the most belonged to the categories: Hazardous Condition (40.7%), Good Intent Call (22.1%), and Fire (15.5%).
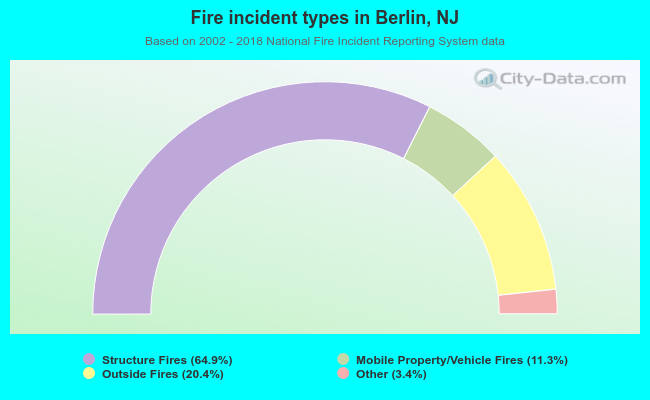 When looking into fire subcategories, the most incidents belonged to: Structure Fires (64.9%), and Outside Fires (20.4%).