Bennington: Fire Incidents, Vermont (VT)
Where are fire incidents reported in Bennington, VT
Something went wrong! Please refresh the page.
| Fire incidents reported | |
|---|---|
| Sreet name | Count |
| MAIN | 36 |
| MAIN ST | 26 |
| NORTHSIDE DRIVE | 26 |
| HARWOOD HILL | 24 |
| NORTHSIDE DR | 14 |
| SOUTH ST | 14 |
| CHAPEL RD | 12 |
| CHAPEL ROAD | 12 |
| NORTH BRANCH ST | 12 |
| NORTH ST | 12 |
| BURGESS RD | 10 |
| CHAPEL RD | 10 |
| EAST ROAD | 10 |
| GAGE ST | 10 |
| MORSE RD | 10 |
| UNION ST | 10 |
| 217 MAPLE STREET | 8 |
| BARNEY RD | 8 |
| BENMONT AVE | 8 |
| CARPENTER HILL RD | 8 |
| CARPENTER HILL RD | 8 |
| DEPOT | 8 |
| DEWEY | 8 |
| GAGE | 8 |
| HOUGHTON LANE | 8 |
| JEFFERSON AVE | 8 |
| NORTH | 8 |
| NORTH BRANCH ST | 8 |
| NORTHSIDE DR | 8 |
| PLEASANT ST | 8 |
| Other | 423 |
2002 - 2018 National Fire Incident Reporting System (NFIRS) incidents
- Incident types reported to NFIRS in Bennington, VT
- 1,07635.1%Hazardous Condition
- 78325.5%Fire
- 49616.2%False Alarm
- 31110.1%Service Call
- 1916.2%Good Intent Call
- 1856.0%Rescue & EMS
- 200.7%Severe Weather
- 40.1%Special Incident
- Fire incident types reported to NFIRS in Bennington, VT
- 43555.6%Structure Fires
- 16521.1%Outside Fires
- 10112.9%Mobile Property/Vehicle Fires
- 8210.5%Other
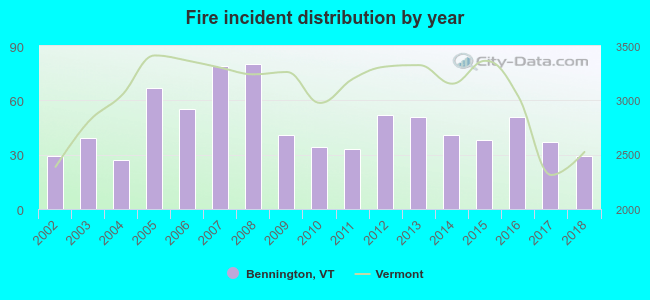 Based on the data from the years 2002 - 2018 the average number of fire incidents per year is 46. The highest number of reported fires - 80 took place in 2008, and the least - 27 in 2004. The data has a constant trend.
The average number of yearly fire incidents per 10k residents in Bennington, VT compared to nearest cities:
(Note: Based on data for the last 3 years, including only cities with population 5,000 and above)
| Bennington: | 43.0 |
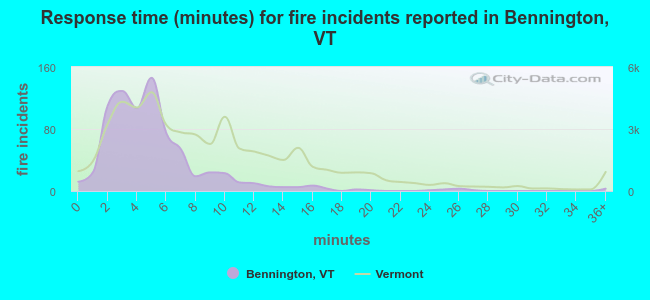 The median response time based on all reported fire incidents is 5 minutes. This is lower than the Vermont median value.
The median response time in Bennington, VT compared to nearest cities:
(Note: Based on data for all years, including only cities with at least 500 fire incidents)
| Bennington: | 5 minutes |
| North Adams: | 4 minutes |
| Adams: | 4 minutes |
| Mechanicville: | 5 minutes |
| Waterford: | 5 minutes |
| Wynantskill: | 8 minutes |
| West Sand Lake: | 7 minutes |
| Troy: | 7 minutes |
| Cohoes: | 4 minutes |
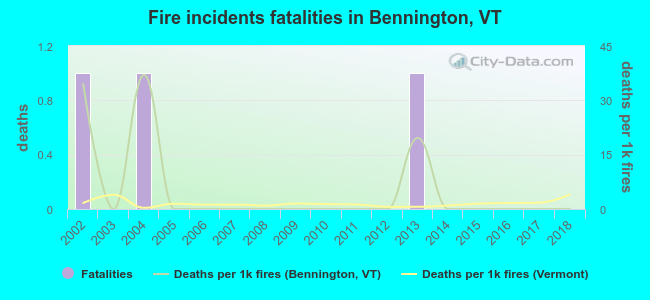 Based on the reports from the years 2002 - 2018 the average number of fire-related fatalities per year is 0. The highest number of deaths - 1 took place in 2002, and the lowest - 0 in 2003. The data has a declining trend.
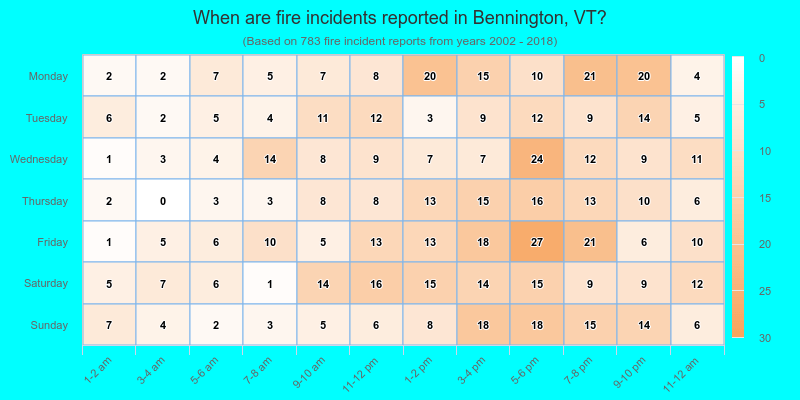
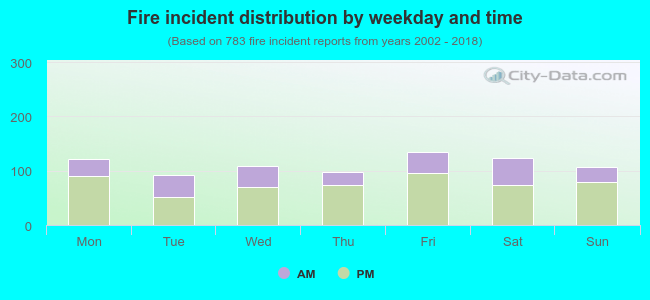 31.9% incidents where reported in the morning and 68.1% in the evening. The most fires (17.2%) took place on Friday, and the least (11.7%) on Tuesday.
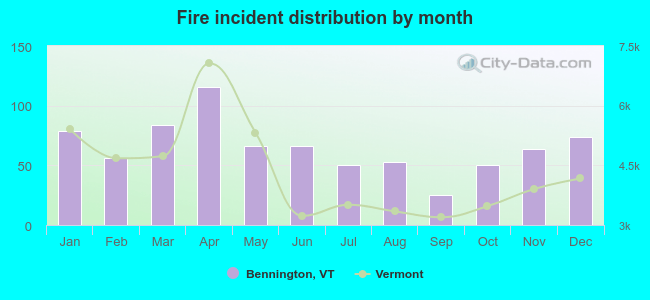 According to the 783 fires from years 2002 - 2018 most fires (14.8%) took place during April, and the least (3.2%) in September.
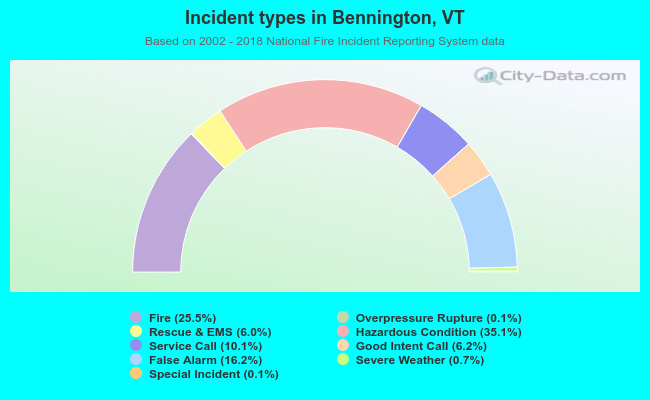 Out of all 3,069 cases reported during the years 2002 - 2018, the most belonged to the categories: Hazardous Condition (35.1%), Fire (25.5%), and False Alarm (16.2%).
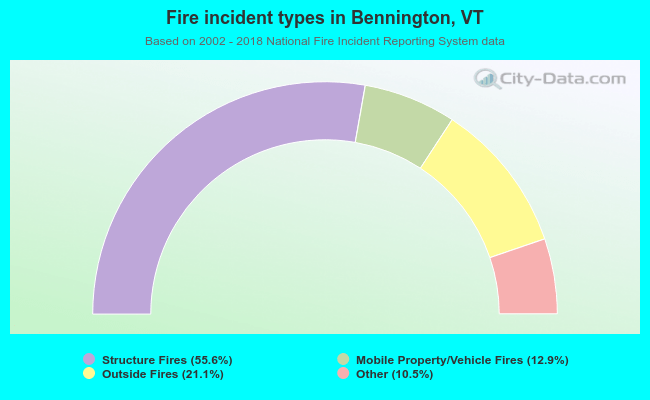 When looking into fire subcategories, the most reports belonged to: Structure Fires (55.6%), and Outside Fires (21.1%).