Belmont: Fire Incidents, New Hampshire (NH)
Where are fire incidents reported in Belmont, NH
Something went wrong! Please refresh the page.
| Fire incidents reported | |
|---|---|
| Sreet name | Count |
| DANIEL WEBSTER HWY | 78 |
| PROVINCE RD | 62 |
| LACONIA RD | 54 |
| UNION RD | 40 |
| GILMANTON RD | 38 |
| DEPOT ST | 32 |
| DURRELL MOUNTAIN RD | 20 |
| HURRICANE RD | 18 |
| MAIN ST | 18 |
| SEAVEY RD | 18 |
| SILKWOOD AVE | 18 |
| CONCORD ST | 16 |
| FARRARVILLE RD | 16 |
| JAMESTOWN RD | 16 |
| SHAKER RD | 16 |
| ELAINE DR | 14 |
| GARDNERS GROVE RD | 14 |
| HAM AVE | 14 |
| HOADLEY RD | 14 |
| INDUSTRIAL DR | 14 |
| LADD HILL RD | 14 |
| PERKINS RD | 14 |
| WESTON RD | 14 |
| CORRIVEAU WAY | 12 |
| DANIEL WEBSTER HIGHWAY | 12 |
| FOX HILL RD | 12 |
| GREY ROCKS RD | 12 |
| HACKETT RD | 12 |
| HORNE RD | 12 |
| BEAN HILL RD | 10 |
| Other | 76 |
2003 - 2018 National Fire Incident Reporting System (NFIRS) incidents
- Incident types reported to NFIRS in Belmont, NH
- 3,48052.0%Rescue & EMS
- 73010.9%Fire
- 70410.5%Hazardous Condition
- 6379.5%Good Intent Call
- 5748.6%Service Call
- 5317.9%False Alarm
- 240.4%Severe Weather
- 130.2%Overpressure Rupture
- Fire incident types reported to NFIRS in Belmont, NH
- 38252.3%Structure Fires
- 21329.2%Outside Fires
- 699.5%Other
- 669.0%Mobile Property/Vehicle Fires
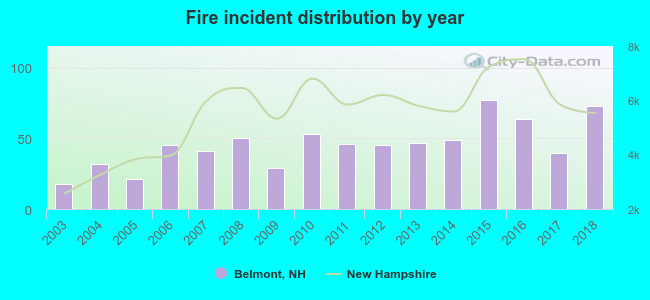 According to the data from the years 2003 - 2018 the average number of fire incidents per year is 46. The highest number of fire incidents - 77 took place in 2015, and the least - 18 in 2003. The data has a rising trend.
The average number of yearly fire incidents per 10k residents in Belmont, NH compared to nearest cities:
(Note: Based on data for the last 3 years, including only cities with population 5,000 and above)
| Belmont: | 80.2 |
| Laconia: | 91.7 |
| Gilford: | 59.4 |
| Franklin: | 67.6 |
| Loudon: | 96.5 |
| Alton: | 78.7 |
| Concord: | 41.9 |
| Pembroke: | 20.6 |
| Hopkinton: | 66.8 |
 The median response time based on all reported fire incidents is 9 minutes. This is higher compared to the state median value.
The median response time in Belmont, NH compared to nearest cities:
(Note: Based on data for all years, including only cities with at least 500 fire incidents)
| Belmont: | 9 minutes |
| Tilton: | 7 minutes |
| Laconia: | 6 minutes |
| Northfield: | 8 minutes |
| Sanbornton: | 12 minutes |
| Gilford: | 8 minutes |
| Franklin: | 7 minutes |
| Loudon: | 8 minutes |
| Alton: | 14 minutes |
 According to the data from the years 2003 - 2018 the average number of fire-related casualties per year is 2. The highest number of casualties - 9 took place in 2013, and the lowest - 0 in 2003. The data has an increasing trend.
The average number of casualties per 1,000 fires is 40. This indicator was the highest - 207 in 2009, and the lowest 0 in 2003. The trend for injuries per 1,000 incidents is growing. Compared to the state value the number of casualties per 1,000 fires is much higher.
According to the data from the years 2003 - 2018 the average number of fire-related casualties per year is 2. The highest number of casualties - 9 took place in 2013, and the lowest - 0 in 2003. The data has an increasing trend.
The average number of casualties per 1,000 fires is 40. This indicator was the highest - 207 in 2009, and the lowest 0 in 2003. The trend for injuries per 1,000 incidents is growing. Compared to the state value the number of casualties per 1,000 fires is much higher.Casualties per 1,000 incidents in Belmont, NH compared to nearest cities:
(Note: Based on data for all years, including only cities with at least 500 fire incidents)
| Belmont: | 39.7 |
| Tilton: | 5.3 |
| Laconia: | 17.4 |
| Northfield: | 20.7 |
| Sanbornton: | 28.6 |
| Gilford: | 3.8 |
| Franklin: | 37.9 |
| Loudon: | 3.0 |
| Alton: | 1.5 |
 28.6% incidents where reported in the morning and 71.4% in the evening. The most fires (17.0%) took place on Sunday, and the least (11.9%) on Thursday.
 Based on the 730 reports from years 2003 - 2018 most fires (15.3%) took place during April, and the least (4.1%) in December.
 Out of all 6,694 cases reported during the years 2003 - 2018, the most belonged to the categories: Rescue & EMS (52.0%), Fire (10.9%), and Hazardous Condition (10.5%).
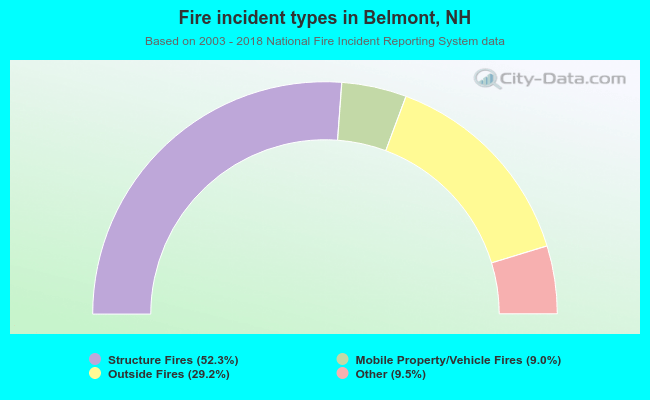 When looking into fire subcategories, the most reports belonged to: Structure Fires (52.3%), and Outside Fires (29.2%).