Batesville: Fire Incidents, Mississippi (MS)
Where are fire incidents reported in Batesville, MS
Something went wrong! Please refresh the page.
| Fire incidents reported | |
|---|---|
| Sreet name | Count |
| HWY 6 | 394 |
| 6 HWY | 282 |
| HWY 51 | 182 |
| SARDIS LAKE DR | 144 |
| EUREKA RD | 134 |
| I-55 | 130 |
| CURTIS RD | 116 |
| HWY 35 | 112 |
| I55 | 96 |
| NASH RD | 96 |
| MALLARD POINT RD | 90 |
| SEVEN RD | 90 |
| BETHLEHEM RD | 82 |
| MARTIN LUTHER KING DR | 78 |
| CROWN DR | 76 |
| TUBBS RD | 72 |
| 315 HWY | 66 |
| BARNACRE RD | 64 |
| ATKINSON RD | 60 |
| OLD PANOLA RD | 60 |
| LAWRENCE BROTHERS RD | 58 |
| JOHN BRANCH RD | 56 |
| WALDRUP RD | 56 |
| HIGHWAY 6 HWY | 54 |
| COTTON PLANT RD | 52 |
| GOOD HOPE RD | 52 |
| MT OLIVET RD | 52 |
| HIGHWAY 6 | 50 |
| CENTRAL ACADEMY RD | 48 |
| DUMMYLINE RD | 48 |
| Other | 1,154 |
2002 - 2018 National Fire Incident Reporting System (NFIRS) incidents
- Incident types reported to NFIRS in Batesville, MS
- 4,10461.8%Fire
- 97614.7%Rescue & EMS
- 5398.1%False Alarm
- 4967.5%Hazardous Condition
- 3805.7%Good Intent Call
- 971.5%Service Call
- 310.5%Severe Weather
- 130.2%Overpressure Rupture
- Fire incident types reported to NFIRS in Batesville, MS
- 1,86345.4%Outside Fires
- 1,53737.5%Structure Fires
- 61014.9%Mobile Property/Vehicle Fires
- 942.3%Other
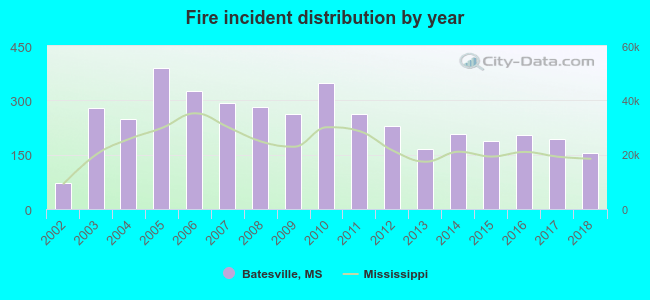 Based on the data from the years 2002 - 2018 the average number of fire incidents per year is 241. The highest number of reported fire incidents - 390 took place in 2005, and the least - 73 in 2002. The data has a rising trend.
The average number of yearly fire incidents per 10k residents in Batesville, MS compared to nearest cities:
(Note: Based on data for the last 3 years, including only cities with population 5,000 and above)
| Batesville: | 247.3 |
| Senatobia: | 158.1 |
| Oxford: | 98.1 |
| Hernando: | 104.2 |
| Clarksdale: | 74.5 |
| Grenada: | 133.0 |
| Holly Springs: | 220.9 |
| Horn Lake: | 37.9 |
| Southaven: | 30.0 |
 The median response time based on all reported fire incidents is 10 minutes. This is higher compared to the state median value.
The median response time in Batesville, MS compared to nearest cities:
(Note: Based on data for all years, including only cities with at least 500 fire incidents)
| Batesville: | 10 minutes |
| Courtland: | 12 minutes |
| Pope: | 12 minutes |
| Sardis: | 10 minutes |
| Como: | 12 minutes |
| Marks: | 9 minutes |
| Senatobia: | 7 minutes |
| Lambert: | 9 minutes |
| Water Valley: | 7 minutes |
 Based on the data from the years 2002 - 2018 the average number of fire-related yearly casualties is 1. The highest number of reported casualties - 3 took place in 2016, and the lowest - 0 in 2002. The data has a constant trend.
The average number of casualties per 1,000 fires is 3. This indicator was the highest - 15 in 2016, and the lowest 0 in 2002. The trend for injuries per 1,000 incidents is constant. Compared to the Mississippi value the number of casualties per 1,000 incidents is lower.
Based on the data from the years 2002 - 2018 the average number of fire-related yearly casualties is 1. The highest number of reported casualties - 3 took place in 2016, and the lowest - 0 in 2002. The data has a constant trend.
The average number of casualties per 1,000 fires is 3. This indicator was the highest - 15 in 2016, and the lowest 0 in 2002. The trend for injuries per 1,000 incidents is constant. Compared to the Mississippi value the number of casualties per 1,000 incidents is lower.
 29.1% incidents where reported in the morning and 70.9% in the evening. The most fires (15.4%) took place on Saturday, and the least (13.5%) on Tuesday.
 Based on the 4,104 reports from years 2002 - 2018 most fires (12.1%) took place during March, and the least (6.0%) in May.
 Out of all 6,637 cases reported during the years 2002 - 2018, the most belonged to the categories: Fire (61.8%), Rescue & EMS (14.7%), and False Alarm (8.1%).
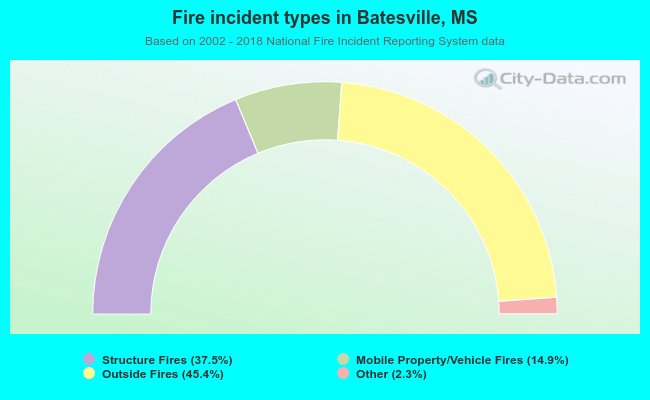 When looking into fire subcategories, the most reports belonged to: Outside Fires (45.4%), and Structure Fires (37.5%).