Barberton: Fire Incidents, Ohio (OH)
Where are fire incidents reported in Barberton, OH
Something went wrong! Please refresh the page.
| Fire incidents reported | |
|---|---|
| Sreet name | Count |
| WOOSTER RD | 300 |
| 5TH ST | 176 |
| TUSCARAWAS AVE | 106 |
| 2ND ST | 88 |
| HOPOCAN AVE | 76 |
| NORTON AVE | 62 |
| 23RD ST | 60 |
| STATE ST | 60 |
| 3RD ST | 58 |
| VAN BUREN AVE | 58 |
| ROBINSON AVE | 52 |
| 31ST ST | 46 |
| FORD AVE | 46 |
| HUSTON ST | 44 |
| VANDERHOOF RD | 38 |
| 14TH ST | 36 |
| 7TH ST | 36 |
| 15TH ST | 34 |
| 9TH ST | 34 |
| 8TH ST | 32 |
| NEWELL ST | 32 |
| BRADY AVE | 30 |
| 25TH ST | 28 |
| BARBER RD | 26 |
| VAN ST | 26 |
| 4TH ST | 24 |
| BENTON ST | 24 |
| 1ST ST | 22 |
| 6TH ST | 22 |
| HARDING AVE | 22 |
2002 - 2018 National Fire Incident Reporting System (NFIRS) incidents
- Incident types reported to NFIRS in Barberton, OH
- 10,59261.2%Rescue & EMS
- 1,76510.2%Hazardous Condition
- 1,6859.7%Fire
- 1,5579.0%Service Call
- 9885.7%Good Intent Call
- 6693.9%False Alarm
- 220.1%Overpressure Rupture
- Fire incident types reported to NFIRS in Barberton, OH
- 71542.4%Structure Fires
- 69441.2%Outside Fires
- 25415.1%Mobile Property/Vehicle Fires
- 221.3%Other
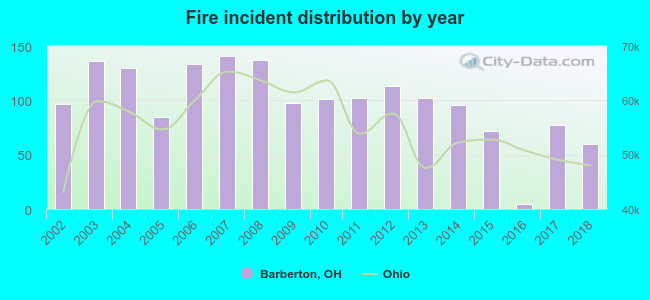 According to the data from the years 2002 - 2018 the average number of fires per year is 99. The highest number of fire incidents - 141 took place in 2007, and the least - 5 in 2016. The data has a dropping trend.
The average number of yearly fire incidents per 10k residents in Barberton, OH compared to nearest cities:
(Note: Based on data for the last 3 years, including only cities with population 5,000 and above)
| Barberton: | 18.0 |
| Norton: | 30.4 |
| Akron: | 43.8 |
| Wadsworth: | 30.6 |
| Green: | 0.6 |
| Fairlawn: | 48.5 |
| Canal Fulton: | 32.8 |
| Rittman: | 43.2 |
| Cuyahoga Falls: | 24.9 |
 The median response time based on all reported fire incidents is 4 minutes. This is lower than the state median value.
The median response time in Barberton, OH compared to nearest cities:
(Note: Based on data for all years, including only cities with at least 500 fire incidents)
| Barberton: | 4 minutes |
| Norton: | 7 minutes |
| Akron: | 5 minutes |
| Wadsworth: | 6 minutes |
| Fairlawn: | 4 minutes |
| Canal Fulton: | 8 minutes |
| Cuyahoga Falls: | 4 minutes |
| Uniontown: | 5 minutes |
| Tallmadge: | 5 minutes |
 Based on the data from the years 2002 - 2018 the average number of fire-related yearly deaths is 0. The highest number of reported deaths - 1 took place in 2002, and the lowest - 0 in 2003. The data has a dropping trend.
 Based on the reports from the years 2002 - 2018 the average number of fire-related casualties per year is 4. The highest number of reported injuries - 9 took place in 2005, and the lowest - 0 in 2015. The data has a dropping trend.
The average number of casualties per 1,000 fire incidents is 37. This indicator was the highest - 106 in 2005, and the lowest 0 in 2015. The trend for injuries per 1,000 fire incidents is dropping. Compared to the Ohio value the number of casualties per 1,000 fires is much higher.
Based on the reports from the years 2002 - 2018 the average number of fire-related casualties per year is 4. The highest number of reported injuries - 9 took place in 2005, and the lowest - 0 in 2015. The data has a dropping trend.
The average number of casualties per 1,000 fire incidents is 37. This indicator was the highest - 106 in 2005, and the lowest 0 in 2015. The trend for injuries per 1,000 fire incidents is dropping. Compared to the Ohio value the number of casualties per 1,000 fires is much higher.Casualties per 1,000 incidents in Barberton, OH compared to nearest cities:
(Note: Based on data for all years, including only cities with at least 500 fire incidents)
| Barberton: | 38.0 |
| Norton: | 10.3 |
| Akron: | 35.0 |
| Wadsworth: | 17.4 |
| Fairlawn: | 11.0 |
| Canal Fulton: | 5.5 |
| Cuyahoga Falls: | 41.0 |
| Uniontown: | 15.0 |
| Tallmadge: | 23.7 |
 31.2% incidents where reported in the morning and 68.8% in the evening. The most fires (16.9%) took place on Monday, and the least (11.8%) on Friday.
 Based on the 1,685 reports from years 2002 - 2018 most fires (11.3%) took place during June, and the least (5.3%) in February.
 Out of all 17,301 cases reported during the years 2002 - 2018, the most belonged to the categories: Rescue & EMS (61.2%), Hazardous Condition (10.2%), and Fire (9.7%).
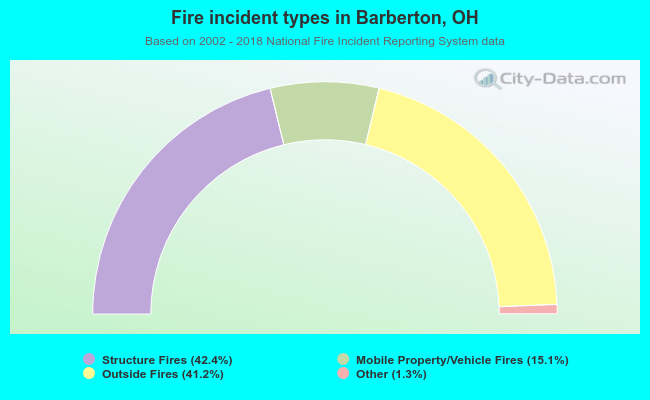 When looking into fire subcategories, the most reports belonged to: Structure Fires (42.4%), and Outside Fires (41.2%).