Baldwin Park: Fire Incidents, California (CA)
Where are fire incidents reported in Baldwin Park, CA
Something went wrong! Please refresh the page.
|
| |||||||||||||||||||||||||||||||||||||||||||||||||||||||||||||||||||||||||||||||||||||||||||||||||||||||||||||
2005 - 2018 National Fire Incident Reporting System (NFIRS) incidents
- Incident types reported to NFIRS in Baldwin Park, CA
- 13,54369.2%Rescue & EMS
- 3,51718.0%Good Intent Call
- 8434.3%Fire
- 7473.8%False Alarm
- 5833.0%Hazardous Condition
- 3021.5%Service Call
- Fire incident types reported to NFIRS in Baldwin Park, CA
- 27732.9%Outside Fires
- 26030.8%Structure Fires
- 25229.9%Mobile Property/Vehicle Fires
- 546.4%Other
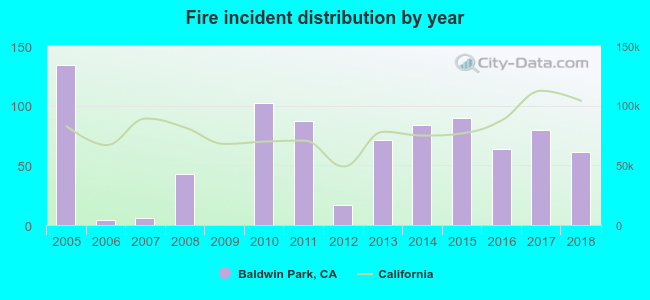 According to the data from the years 2005 - 2018 the average number of fire incidents per year is 60. The highest number of fire incidents - 134 took place in 2005, and the least - 0 in 2009. The data has a declining trend.
The average number of yearly fire incidents per 10k residents in Baldwin Park, CA compared to nearest cities:
(Note: Based on data for the last 3 years, including only cities with population 5,000 and above)
| Baldwin Park: | 8.9 |
| El Monte: | 14.1 |
| West Covina: | 5.2 |
| La Puente: | 8.3 |
| Valinda: | 10.2 |
| Duarte: | 13.0 |
| Monrovia: | 21.6 |
| Azusa: | 13.9 |
| South El Monte: | 26.1 |
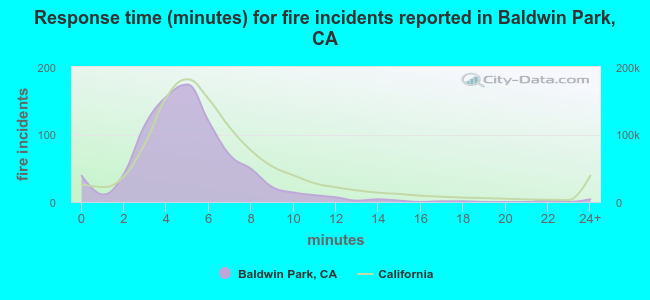 The median response time based on all reported fire incidents is 5 minutes. This is lower compared to the California median value.
The median response time in Baldwin Park, CA compared to nearest cities:
(Note: Based on data for all years, including only cities with at least 500 fire incidents)
| Baldwin Park: | 5 minutes |
| El Monte: | 4 minutes |
| West Covina: | 6 minutes |
| Monrovia: | 5 minutes |
| Industry: | 6 minutes |
| Azusa: | 5 minutes |
| Arcadia: | 5 minutes |
| Covina: | 4 minutes |
| Hacienda Heights: | 6 minutes |
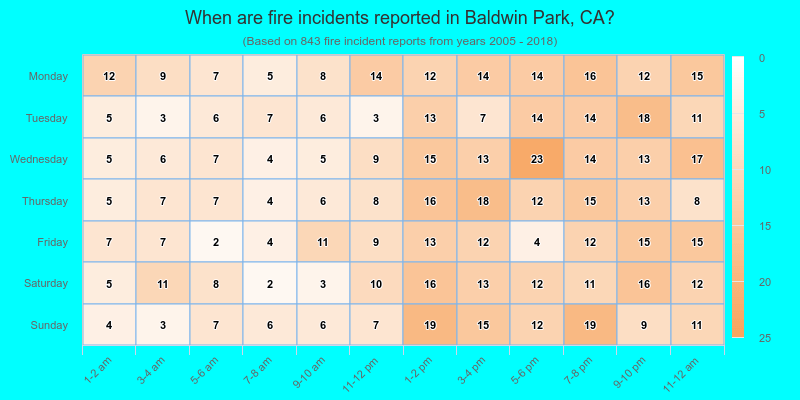
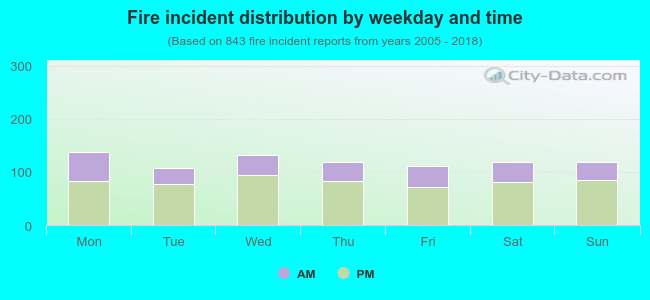 32.0% incidents where reported in the morning and 68.0% in the evening. The most fires (16.4%) took place on Monday, and the least (12.7%) on Tuesday.
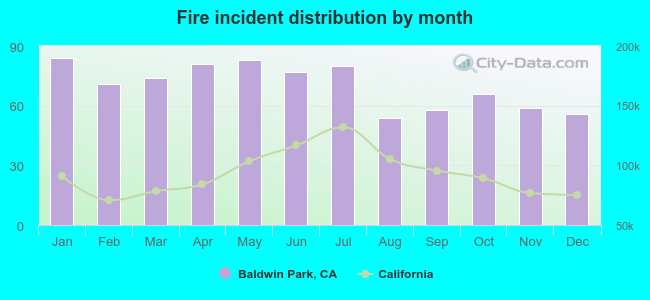 According to the 843 incident reports from years 2005 - 2018 most fires (10.0%) took place during January, and the least (6.4%) in August.
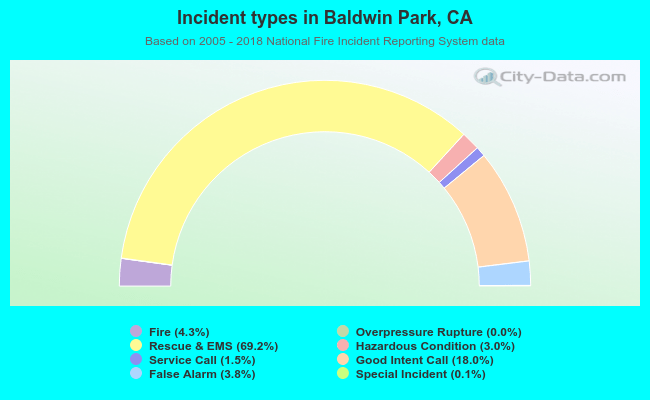 Out of all 19,558 cases reported during the years 2005 - 2018, the most belonged to the categories: Rescue & EMS (69.2%), Good Intent Call (18.0%), and Fire (4.3%).
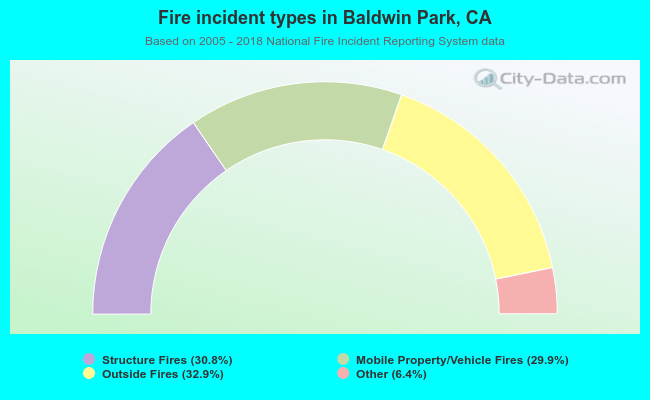 When looking into fire subcategories, the most incidents belonged to: Outside Fires (32.9%), and Structure Fires (30.8%).