Audubon: Fire Incidents, Pennsylvania (PA)
Where are fire incidents reported in Audubon, PA
Something went wrong! Please refresh the page.
|
| |||||||||||||||||||||||||||||||||||||||||||||||||||||||||||||||||||||||||||||||||||||||||||||||||||||||||||||
2003 - 2018 National Fire Incident Reporting System (NFIRS) incidents
- Incident types reported to NFIRS in Audubon, PA
- 16335.2%Fire
- 10121.8%Hazardous Condition
- 6814.7%False Alarm
- 5111.0%Rescue & EMS
- 429.1%Good Intent Call
- 357.6%Service Call
- 10.2%Overpressure Rupture
- 10.2%Severe Weather
- 10.2%Special Incident
- Fire incident types reported to NFIRS in Audubon, PA
- 11973.0%Structure Fires
- 2817.2%Outside Fires
- 138.0%Mobile Property/Vehicle Fires
- 31.8%Other
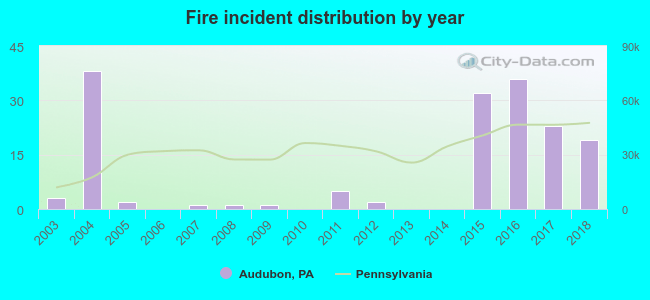 Based on the data from the years 2003 - 2018 the average number of fire incidents per year is 10. The highest number of fires - 38 took place in 2004, and the least - 0 in 2006. The data has a growing trend.
The average number of yearly fire incidents per 10k residents in Audubon, PA compared to nearest cities:
(Note: Based on data for the last 3 years, including only cities with population 5,000 and above)
| Audubon: | 30.8 |
| Trooper: | 7.5 |
| West Norriton: | 4.1 |
| King of Prussia: | 82.4 |
| Collegeville: | 88.9 |
| Norristown: | 98.0 |
| Phoenixville: | 65.7 |
| East Norriton: | 30.3 |
| Paoli: | 18.5 |
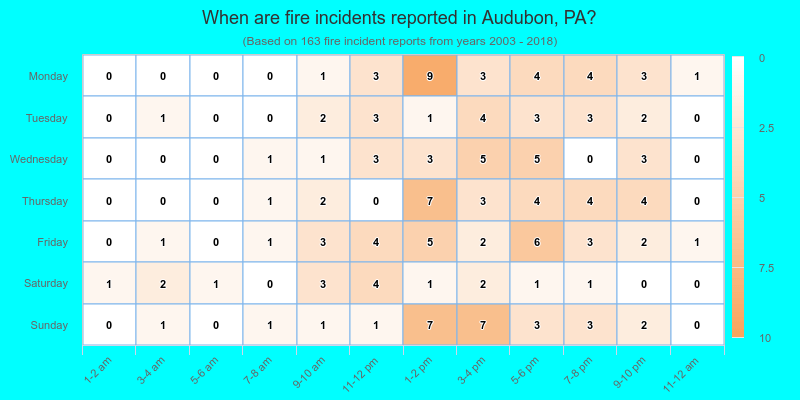
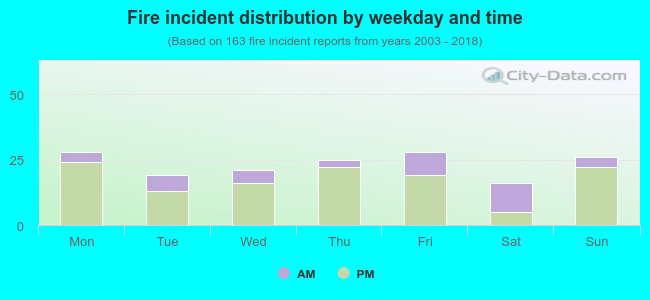 25.8% incidents where reported in the morning and 74.2% in the evening. The most fires (17.2%) took place on Monday, and the least (9.8%) on Saturday.
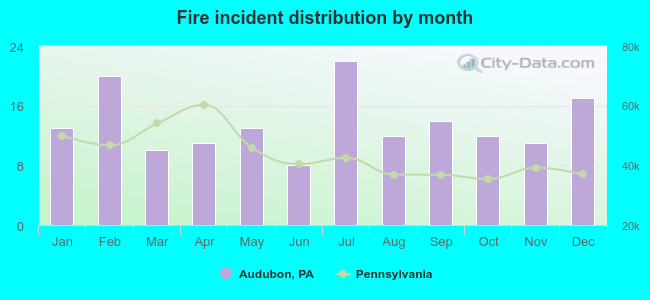 According to the 163 fires from years 2003 - 2018 most fires (13.5%) took place during July, and the least (4.9%) in June.
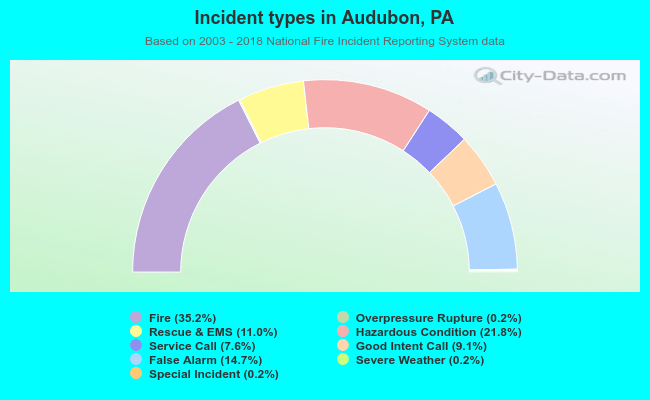 Out of all 463 cases reported during the years 2003 - 2018, the most belonged to the categories: Fire (35.2%), Hazardous Condition (21.8%), and False Alarm (14.7%).
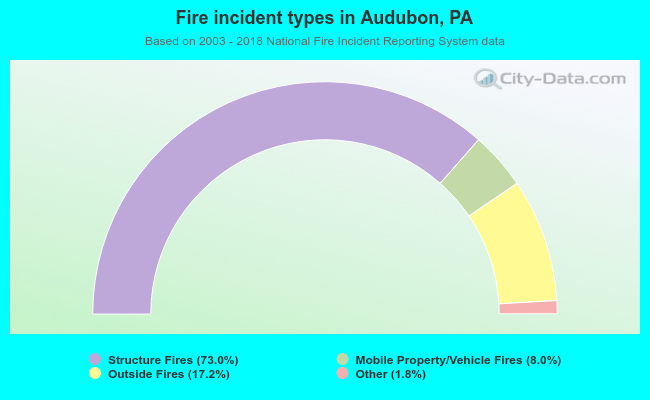 When looking into fire subcategories, the most reports belonged to: Structure Fires (73.0%), and Outside Fires (17.2%).