Arcata: Fire Incidents, California (CA)
Where are fire incidents reported in Arcata, CA
Something went wrong! Please refresh the page.
| Fire incidents reported | |
|---|---|
| Sreet name | Count |
| HIGHWAY 101 | 108 |
| WEST END RD | 80 |
| VALLEY WEST BLVD | 70 |
| H ST | 64 |
| G ST | 60 |
| 9TH ST | 58 |
| F ST | 56 |
| ALLIANCE RD | 48 |
| JANES RD | 48 |
| SAMOA BLVD | 48 |
| FOSTER AVE | 46 |
| HIGHWAY 255 | 46 |
| I ST | 36 |
| 8TH ST | 32 |
| HIGHWAY 299 | 32 |
| UNION ST | 32 |
| BAYSIDE RD | 26 |
| M ST | 26 |
| 11TH ST | 24 |
| 7TH ST | 22 |
| BOYD RD | 20 |
| MAD RIVER RD | 20 |
| SUNSET AVE | 20 |
| FICKLE HILL RD | 18 |
| SPEAR AVE | 18 |
| 10TH ST | 16 |
| D ST | 16 |
| GIUNTOLI | 16 |
| 16TH ST | 14 |
| CALIFORNIA AVE | 14 |
| Other | 52 |
2005 - 2018 National Fire Incident Reporting System (NFIRS) incidents
- Incident types reported to NFIRS in Arcata, CA
- 2,41937.4%Rescue & EMS
- 1,18618.4%Fire
- 1,12617.4%Good Intent Call
- 96915.0%Service Call
- 4456.9%Hazardous Condition
- 3074.8%False Alarm
- Fire incident types reported to NFIRS in Arcata, CA
- 58749.5%Outside Fires
- 38732.6%Structure Fires
- 14412.1%Mobile Property/Vehicle Fires
- 685.7%Other
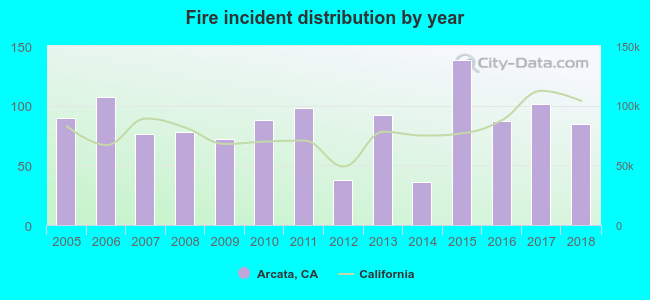 According to the data from the years 2005 - 2018 the average number of fire incidents per year is 85. The highest number of reported fires - 138 took place in 2015, and the least - 36 in 2014. The data has a decreasing trend.
The average number of yearly fire incidents per 10k residents in Arcata, CA compared to nearest cities:
(Note: Based on data for the last 3 years, including only cities with population 5,000 and above)
| Arcata: | 51.3 |
| McKinleyville: | 36.0 |
| Eureka: | 2.5 |
| Fortuna: | 1.7 |
| Garberville: | 16.9 |
| Crescent City: | 190.6 |
| Shasta Lake: | 2.6 |
| Redding: | 33.0 |
| Yreka: | 28.6 |
 The median response time based on all reported fire incidents is 6 minutes. This is comparable to the state median value.
The median response time in Arcata, CA compared to nearest cities:
(Note: Based on data for all years, including only cities with at least 500 fire incidents)
| Arcata: | 6 minutes |
| McKinleyville: | 6 minutes |
| Eureka: | 6 minutes |
| Crescent City: | 5 minutes |
| Redding: | 8 minutes |
| Weed: | 7 minutes |
 According to the data from the years 2005 - 2018 the average number of fire-related yearly casualties is 2. The highest number of reported injuries - 4 took place in 2010, and the lowest - 0 in 2006. The data has a declining trend.
The average number of injuries per 1,000 fire incidents is 27. This indicator was the highest - 83 in 2014, and the lowest 0 in 2006. The trend for casualties per 1,000 incidents is decreasing. Compared to the California value the number of injuries per 1,000 fire incidents is much higher.
According to the data from the years 2005 - 2018 the average number of fire-related yearly casualties is 2. The highest number of reported injuries - 4 took place in 2010, and the lowest - 0 in 2006. The data has a declining trend.
The average number of injuries per 1,000 fire incidents is 27. This indicator was the highest - 83 in 2014, and the lowest 0 in 2006. The trend for casualties per 1,000 incidents is decreasing. Compared to the California value the number of injuries per 1,000 fire incidents is much higher.Casualties per 1,000 incidents in Arcata, CA compared to nearest cities:
(Note: Based on data for all years, including only cities with at least 500 fire incidents)
| Arcata: | 21.1 |
| McKinleyville: | 34.2 |
| Eureka: | 14.2 |
| Crescent City: | 0.0 |
| Redding: | 10.7 |
| Weed: | 6.4 |
 40.9% incidents where reported in the morning and 59.1% in the evening. The most fires (15.9%) took place on Sunday, and the least (12.7%) on Friday.
 According to the 1,186 incident reports from years 2005 - 2018 most fires (14.3%) took place during July, and the least (5.0%) in December.
 Out of all 6,461 cases reported during the years 2005 - 2018, the most belonged to the categories: Rescue & EMS (37.4%), Fire (18.4%), and Good Intent Call (17.4%).
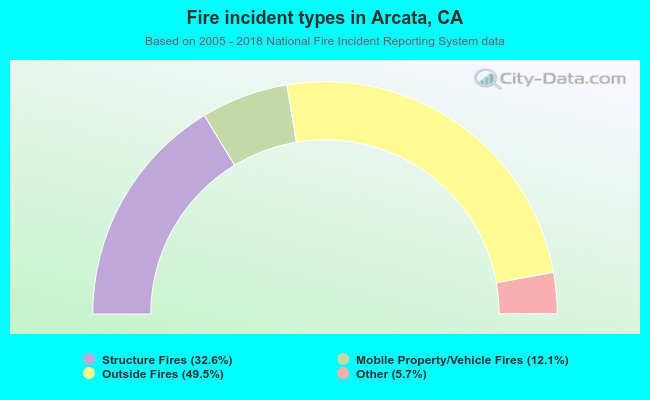 When looking into fire subcategories, the most incidents belonged to: Outside Fires (49.5%), and Structure Fires (32.6%).