Apollo Beach: Fire Incidents, Florida (FL)
Where are fire incidents reported in Apollo Beach, FL
Something went wrong! Please refresh the page.
|
| |||||||||||||||||||||||||||||||||||||||||||||||||||||||||||||||||||||||||||||||||||||||||||||||||||||||||||||
2009 - 2018 National Fire Incident Reporting System (NFIRS) incidents
- Incident types reported to NFIRS in Apollo Beach, FL
- 2,76075.0%Rescue & EMS
- 3459.4%Good Intent Call
- 1754.8%Fire
- 1464.0%Service Call
- 1263.4%Hazardous Condition
- 1072.9%False Alarm
- 180.5%Special Incident
- Fire incident types reported to NFIRS in Apollo Beach, FL
- 8045.7%Outside Fires
- 5129.1%Structure Fires
- 3922.3%Mobile Property/Vehicle Fires
- 52.9%Other
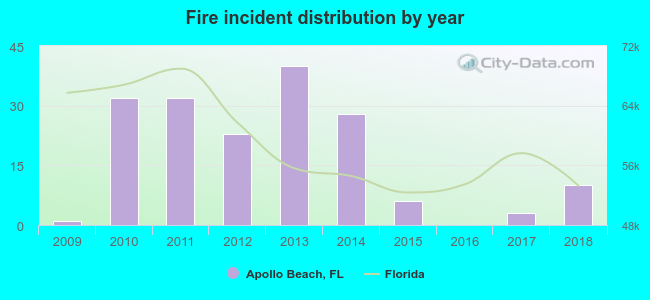 According to the data from the years 2009 - 2018 the average number of fire incidents per year is 18. The highest number of reported fire incidents - 40 took place in 2013, and the least - 0 in 2016. The data has an increasing trend.
The average number of yearly fire incidents per 10k residents in Apollo Beach, FL compared to nearest cities:
(Note: Based on data for the last 3 years, including only cities with population 5,000 and above)
| Apollo Beach: | 4.6 |
| Ruskin: | 20.0 |
| Gibsonton: | 12.3 |
| Sun City Center: | 5.7 |
| Wimauma: | 29.8 |
| Riverview: | 4.0 |
| Bloomingdale: | 1.8 |
| Brandon: | 3.5 |
| Tampa: | 38.7 |

 Based on the reports from the years 2009 - 2018 the average number of fire-related yearly casualties is 0. The highest number of casualties - 1 took place in 2012, and the lowest - 0 in 2009. The data has a constant trend.
 22.3% incidents where reported in the morning and 77.7% in the evening. The most fires (17.1%) took place on Saturday, and the least (12.6%) on Tuesday.
 Based on the 175 fire incidents from years 2009 - 2018 most fires (14.3%) took place during November, and the least (5.1%) in February.
 Out of all 3,681 cases reported during the years 2009 - 2018, the most belonged to the categories: Rescue & EMS (75.0%), Good Intent Call (9.4%), and Fire (4.8%).
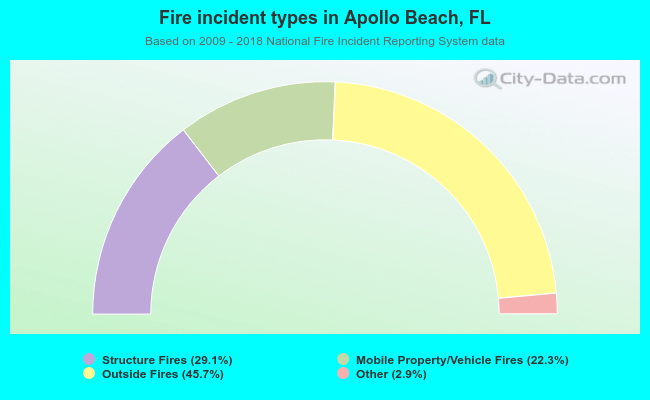 When looking into fire subcategories, the most incidents belonged to: Outside Fires (45.7%), and Structure Fires (29.1%).