Altoona: Fire Incidents, Wisconsin (WI)
Where are fire incidents reported in Altoona, WI
Something went wrong! Please refresh the page.
|
| |||||||||||||||||||||||||||||||||||||||||||||||||||||||||||||||||||||||||||||||||||||||||||||||||||||||||||||
2003 - 2018 National Fire Incident Reporting System (NFIRS) incidents
- Incident types reported to NFIRS in Altoona, WI
- 2,99476.4%Rescue & EMS
- 2877.3%False Alarm
- 2185.6%Fire
- 1884.8%Hazardous Condition
- 1423.6%Good Intent Call
- 802.0%Service Call
- 40.1%Overpressure Rupture
- Fire incident types reported to NFIRS in Altoona, WI
- 12657.8%Structure Fires
- 5123.4%Outside Fires
- 3516.1%Mobile Property/Vehicle Fires
- 62.8%Other
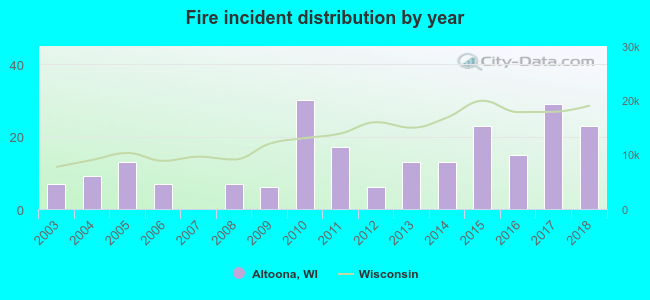 Based on the data from the years 2003 - 2018 the average number of fire incidents per year is 14. The highest number of reported fire incidents - 30 took place in 2010, and the least - 0 in 2007. The data has a growing trend.
The average number of yearly fire incidents per 10k residents in Altoona, WI compared to nearest cities:
(Note: Based on data for the last 3 years, including only cities with population 5,000 and above)
| Altoona: | 31.2 |
| Washington: | 4.6 |
| Eau Claire: | 21.8 |
| Lake Hallie: | 4.6 |
| Chippewa Falls: | 46.1 |
| Lafayette: | 3.5 |
| Menomonie: | 41.9 |

 28.9% incidents where reported in the morning and 71.1% in the evening. The most fires (20.6%) took place on Thursday, and the least (11.0%) on Tuesday.
 According to the 218 fire incident reports from years 2003 - 2018 most fires (12.8%) took place during May, and the least (4.6%) in November.
 Out of all 3,917 cases reported during the years 2003 - 2018, the most belonged to the categories: Rescue & EMS (76.4%), False Alarm (7.3%), and Fire (5.6%).
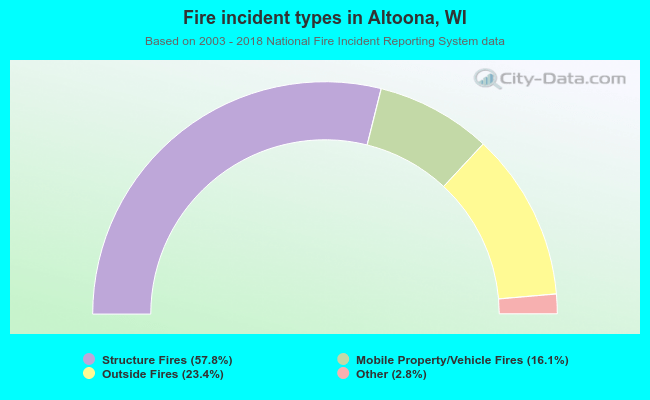 When looking into fire subcategories, the most reports belonged to: Structure Fires (57.8%), and Outside Fires (23.4%).