Altamonte Springs: Fire Incidents, Florida (FL)
Where are fire incidents reported in Altamonte Springs, FL
Something went wrong! Please refresh the page.
| Fire incidents reported | |
|---|---|
| Sreet name | Count |
| W SR 436 | 116 |
| E SR 436 | 110 |
| SR 436 | 106 |
| ALTAMONTE DR | 72 |
| DOUGLAS AVE | 72 |
| DOUGLAS AVE | 66 |
| WYMORE RD | 66 |
| WYMORE RD | 66 |
| SR 434 | 56 |
| NORTHLAKE BLVD | 42 |
| N SR 434 | 38 |
| NORTHLAKE BLVD | 38 |
| BALLARD ST | 36 |
| JAMESTOWN BLVD | 34 |
| LAKE DESTINY RD | 32 |
| LORAINE DR | 32 |
| ORANGE DR | 32 |
| ORIENTA AVE | 32 |
| PALM SPRINGS DR | 32 |
| S SR 434 | 32 |
| SAND LAKE RD | 32 |
| LITTLE RIVER LOOP | 28 |
| ORIENTA AVE | 28 |
| CHEROKEE CT | 22 |
| E ALTAMONTE DR | 22 |
| E I4 | 22 |
| S CR 427 | 22 |
| ASHFORD OAKS DR | 20 |
| MAITLAND AVE | 20 |
| W I4 | 20 |
| Other | 837 |
2003 - 2017 National Fire Incident Reporting System (NFIRS) incidents
- Incident types reported to NFIRS in Altamonte Springs, FL
- 18,06461.3%Rescue & EMS
- 2,6008.8%Hazardous Condition
- 2,5618.7%Service Call
- 2,5268.6%Good Intent Call
- 2,1837.4%Fire
- 1,4855.0%False Alarm
- Fire incident types reported to NFIRS in Altamonte Springs, FL
- 87440.0%Structure Fires
- 79936.6%Outside Fires
- 40518.6%Mobile Property/Vehicle Fires
- 1054.8%Other
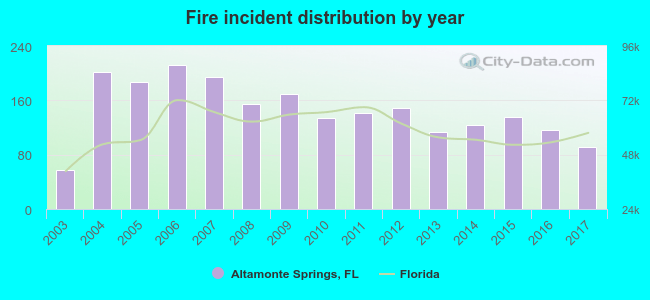 Based on the data from the years 2003 - 2017 the average number of fire incidents per year is 145. The highest number of fire incidents - 212 took place in 2006, and the least - 58 in 2003. The data has an increasing trend.
The average number of yearly fire incidents per 10k residents in Altamonte Springs, FL compared to nearest cities:
(Note: Based on data for the last 3 years, including only cities with population 5,000 and above)
| Altamonte Springs: | 16.7 |
| Maitland: | 21.6 |
| Fern Park: | 13.8 |
| Longwood: | 38.7 |
| Casselberry: | 16.5 |
| Winter Park: | 32.9 |
| Winter Springs: | 11.3 |
| Apopka: | 42.1 |
| Lake Mary: | 18.4 |
 The median response time based on all reported fire incidents is 5 minutes. This is lower than the state median value.
The median response time in Altamonte Springs, FL compared to nearest cities:
(Note: Based on data for all years, including only cities with at least 500 fire incidents)
| Altamonte Springs: | 5 minutes |
| Maitland: | 5 minutes |
| Longwood: | 5 minutes |
| Casselberry: | 5 minutes |
| Winter Park: | 6 minutes |
| Winter Springs: | 5 minutes |
| Apopka: | 5 minutes |
| Lake Mary: | 6 minutes |
| Orlando: | 7 minutes |
 According to the reports from the years 2003 - 2017 the average number of fire-related yearly casualties is 6. The highest number of reported injuries - 11 took place in 2006, and the lowest - 2 in 2003. The data has a growing trend.
The average number of injuries per 1,000 fire incidents is 46. This indicator was the highest - 99 in 2017, and the lowest 16 in 2014. The trend for casualties per 1,000 fire incidents is rising. Compared to the state value the number of casualties per 1,000 fire incidents is much higher.
According to the reports from the years 2003 - 2017 the average number of fire-related yearly casualties is 6. The highest number of reported injuries - 11 took place in 2006, and the lowest - 2 in 2003. The data has a growing trend.
The average number of injuries per 1,000 fire incidents is 46. This indicator was the highest - 99 in 2017, and the lowest 16 in 2014. The trend for casualties per 1,000 fire incidents is rising. Compared to the state value the number of casualties per 1,000 fire incidents is much higher.Casualties per 1,000 incidents in Altamonte Springs, FL compared to nearest cities:
(Note: Based on data for all years, including only cities with at least 500 fire incidents)
| Altamonte Springs: | 43.1 |
| Maitland: | 14.0 |
| Longwood: | 29.7 |
| Casselberry: | 20.4 |
| Winter Park: | 24.3 |
| Winter Springs: | 36.7 |
| Apopka: | 11.3 |
| Lake Mary: | 20.7 |
| Orlando: | 19.3 |
 29.5% incidents where reported in the morning and 70.5% in the evening. The most fires (15.4%) took place on Tuesday, and the least (12.8%) on Monday.
 According to the 2,183 fire incidents from years 2003 - 2017 most fires (11.0%) took place during March, and the least (6.9%) in February.
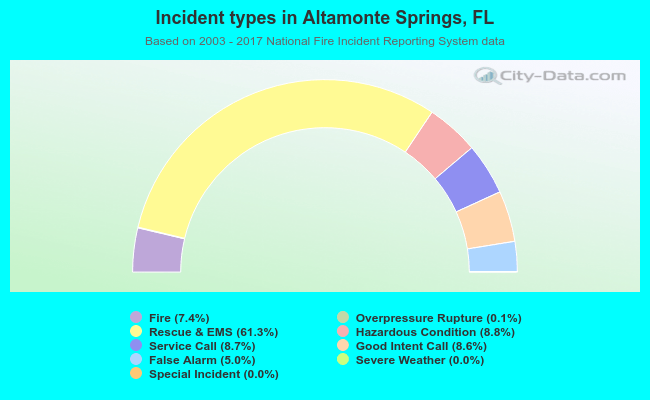 Out of all 29,455 cases reported during the years 2003 - 2017, the most belonged to the categories: Rescue & EMS (61.3%), Hazardous Condition (8.8%), and Service Call (8.7%).
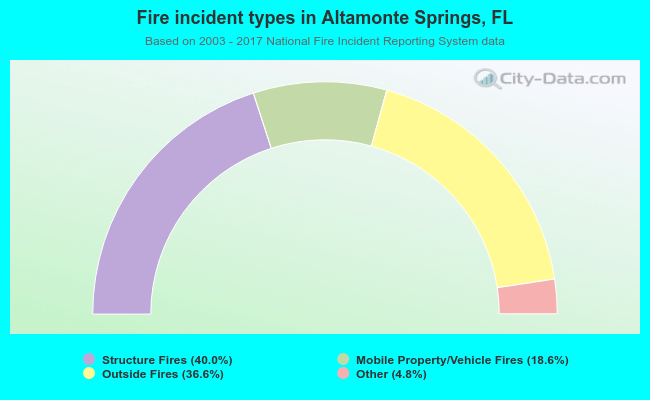 When looking into fire subcategories, the most incidents belonged to: Structure Fires (40.0%), and Outside Fires (36.6%).