Acushnet: Fire Incidents, Massachusetts (MA)
Where are fire incidents reported in Acushnet, MA
Something went wrong! Please refresh the page.
|
| |||||||||||||||||||||||||||||||||||||||||||||||||||||||||||||||||||||||||||||||||||||||||||||||||||||||||||||
2002 - 2018 National Fire Incident Reporting System (NFIRS) incidents
- Incident types reported to NFIRS in Acushnet, MA
- 1,21527.3%Hazardous Condition
- 1,09824.7%Service Call
- 1,09724.7%Rescue & EMS
- 45110.1%Fire
- 3918.8%False Alarm
- 1613.6%Good Intent Call
- 180.4%Special Incident
- 70.2%Overpressure Rupture
- 60.1%Severe Weather
- Fire incident types reported to NFIRS in Acushnet, MA
- 24554.3%Structure Fires
- 12828.4%Outside Fires
- 6314.0%Mobile Property/Vehicle Fires
- 153.3%Other
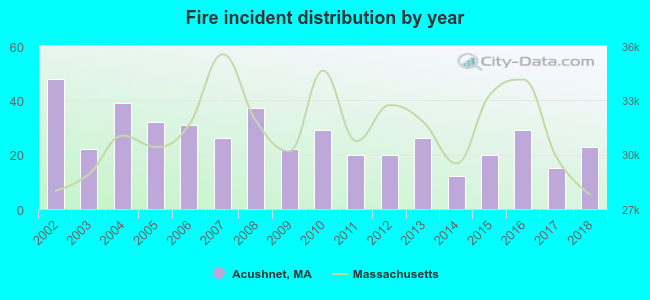 Based on the data from the years 2002 - 2018 the average number of fire incidents per year is 27. The highest number of reported fire incidents - 48 took place in 2002, and the least - 12 in 2014. The data has a declining trend.
The average number of yearly fire incidents per 10k residents in Acushnet, MA compared to nearest cities:
(Note: Based on data for the last 3 years, including only cities with population 5,000 and above)
| Acushnet: | 21.7 |
| New Bedford: | 46.5 |
| Fairhaven: | 30.2 |
| Mattapoisett: | 32.5 |
| Rochester: | 13.4 |
| Dartmouth: | 22.3 |
| Freetown: | 4.5 |
| Lakeville: | 26.4 |
| Westport: | 41.0 |

 According to the data from the years 2002 - 2018 the average number of fire-related yearly casualties is 0. The highest number of casualties - 2 took place in 2005, and the lowest - 0 in 2002. The data has a constant trend.
 30.8% incidents where reported in the morning and 69.2% in the evening. The most fires (16.0%) took place on Friday, and the least (12.2%) on Wednesday.
 According to the 451 fire incident reports from years 2002 - 2018 most fires (13.7%) took place during April, and the least (4.9%) in June.
 Out of all 4,444 cases reported during the years 2002 - 2018, the most belonged to the categories: Hazardous Condition (27.3%), Service Call (24.7%), and Rescue & EMS (24.7%).
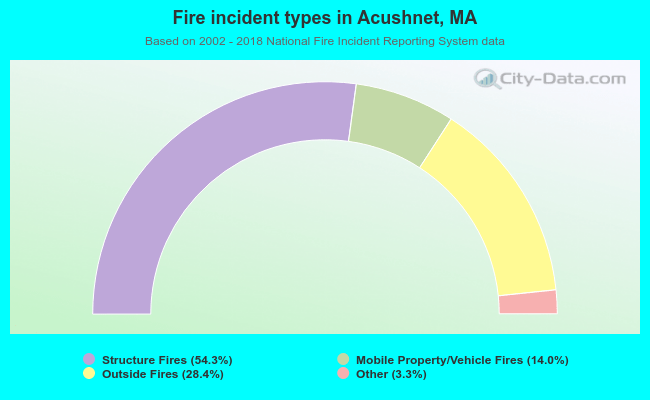 When looking into fire subcategories, the most reports belonged to: Structure Fires (54.3%), and Outside Fires (28.4%).