Crime rate in North Charleston, South Carolina (SC): murders, rapes, robberies, assaults, burglaries, thefts, auto thefts, arson, law enforcement employees, police officers, crime map
Crime rate in North Charleston, SC
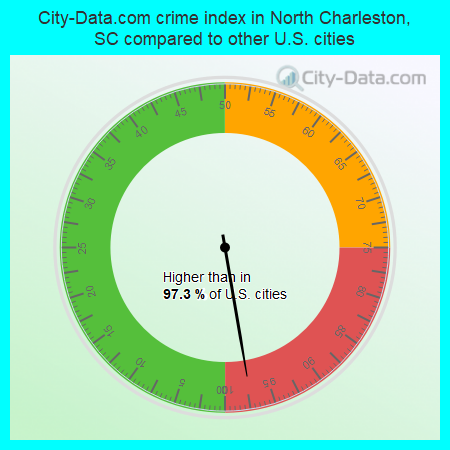
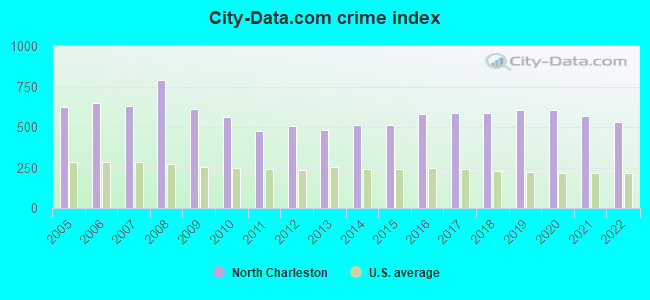
The 2022 crime rate in North Charleston, SC is 529 (City-Data.com crime index), which is 2.2 times greater than the U.S. average. It was higher than in 97.3% U.S. cities. The 2022 North Charleston crime rate fell by 6% compared to 2021. The number of homicides stood at 33 - a decrease of 3 compared to 2021. In the last 5 years North Charleston has seen increasing violent crime and decline of property crime.See how dangerous North Charleston, SC is compared to the nearest cities:
(Note: Higher means more crime)
(Note: Higher means more crime)
| North Charleston: | 529.4 |
| Hanahan: | 200.5 |
| Charleston: | 203.8 |
| Goose Creek: | 171.1 |
| Mount Pleasant: | 106.3 |
| Lincolnville: | 74.3 |
| Summerville: | 243.3 |
| Sullivan's Island: | 44.9 |
| Folly Beach: | 280.8 |
The City-Data.com crime index weighs serious crimes and violent crimes more heavily. Higher means more crime, U.S. average is 246.1. It adjusts for the number of visitors and daily workers commuting into cities.
- means the value is smaller than the state average.- means the value is about the same as the state average.
- means the value is bigger than the state average.
- means the value is much bigger than the state average.
According to our research of South Carolina and other state lists, there were 45 registered sex offenders living in North Charleston, South Carolina as of June 01, 2024.
The ratio of all residents to sex offenders in North Charleston is 2,456 to 1.
The ratio of registered sex offenders to all residents in this city is lower than the state average.
Violent crime rate in 2022
| North Charleston: | 547.4 |
| U.S. Average: | 219.8 |
Violent crime rate in 2021
| North Charleston: | 593.9 |
| U.S. Average: | 224.8 |
Violent crime rate in 2020
| North Charleston: | 660.0 |
| U.S. Average: | 228.2 |
Violent crime rate in 2019
| North Charleston: | 565.9 |
| U.S. Average: | 219.9 |
Violent crime rate in 2018
| North Charleston: | 541.0 |
| U.S. Average: | 221.2 |
Violent crime rate in 2017
| North Charleston: | 546.2 |
| U.S. Average: | 226.2 |
Violent crime rate in 2016
| North Charleston: | 534.9 |
| U.S. Average: | 227.3 |
Violent crime rate in 2015
| North Charleston: | 439.7 |
| U.S. Average: | 219.3 |
Violent crime rate in 2014
| North Charleston: | 430.4 |
| U.S. Average: | 211.1 |
Violent crime rate in 2013
| North Charleston: | 386.2 |
| U.S. Average: | 214.2 |
Violent crime rate in 2012
| North Charleston: | 417.7 |
| U.S. Average: | 187.4 |
Violent crime rate in 2011
| North Charleston: | 373.7 |
| U.S. Average: | 187.1 |
Violent crime rate in 2010
| North Charleston: | 494.5 |
| U.S. Average: | 195.7 |
Violent crime rate in 2009
| North Charleston: | 563.1 |
| U.S. Average: | 208.9 |
Violent crime rate in 2008
| North Charleston: | 802.2 |
| U.S. Average: | 222.5 |
Violent crime rate in 2007
| North Charleston: | 662.8 |
| U.S. Average: | 229.1 |
Violent crime rate in 2006
| North Charleston: | 639.4 |
| U.S. Average: | 232.6 |
Violent crime rate in 2005
| North Charleston: | 629.0 |
| U.S. Average: | 227.0 |
Property crime rate in 2022
| North Charleston: | 370.8 |
| U.S. Average: | 166.5 |
Property crime rate in 2021
| North Charleston: | 387.2 |
| U.S. Average: | 157.8 |
Property crime rate in 2020
| North Charleston: | 401.3 |
| U.S. Average: | 169.6 |
Property crime rate in 2019
| North Charleston: | 496.3 |
| U.S. Average: | 179.7 |
Property crime rate in 2018
| North Charleston: | 477.6 |
| U.S. Average: | 190.2 |
Property crime rate in 2017
| North Charleston: | 468.5 |
| U.S. Average: | 206.4 |
Property crime rate in 2016
| North Charleston: | 465.7 |
| U.S. Average: | 216.6 |
Property crime rate in 2015
| North Charleston: | 434.5 |
| U.S. Average: | 221.5 |
Property crime rate in 2014
| North Charleston: | 434.7 |
| U.S. Average: | 230.8 |
Property crime rate in 2013
| North Charleston: | 459.7 |
| U.S. Average: | 250.4 |
Property crime rate in 2012
| North Charleston: | 467.5 |
| U.S. Average: | 267.3 |
Property crime rate in 2011
| North Charleston: | 497.9 |
| U.S. Average: | 273.5 |
Property crime rate in 2010
| North Charleston: | 509.8 |
| U.S. Average: | 276.4 |
Property crime rate in 2009
| North Charleston: | 543.9 |
| U.S. Average: | 285.6 |
Property crime rate in 2008
| North Charleston: | 640.9 |
| U.S. Average: | 302.2 |
Property crime rate in 2007
| North Charleston: | 464.5 |
| U.S. Average: | 309.2 |
Property crime rate in 2006
| North Charleston: | 526.0 |
| U.S. Average: | 317.3 |
Property crime rate in 2005
| North Charleston: | 525.2 |
| U.S. Average: | 322.3 |


Full-time law enforcement employees in 2021, including police officers: 166 (145 officers - 118 male; 27 female).
| Officers per 1,000 residents here: | 1.20 |
| South Carolina average: | 2.21 |
Full-time law enforcement employees in 2020, including police officers: 396 (321 officers - 261 male; 60 female).
| Officers per 1,000 residents here: | 2.73 |
| South Carolina average: | 2.34 |
Full-time law enforcement employees in 2019, including police officers: 413 (332 officers - 275 male; 57 female).
| Officers per 1,000 residents here: | 2.88 |
| South Carolina average: | 2.38 |
Full-time law enforcement employees in 2018, including police officers: 389 (323 officers - 271 male; 52 female).
| Officers per 1,000 residents here: | 2.86 |
| South Carolina average: | 2.56 |
Full-time law enforcement employees in 2017, including police officers: 411 (339 officers - 276 male; 63 female).
| Officers per 1,000 residents here: | 3.05 |
| South Carolina average: | 2.33 |
Full-time law enforcement employees in 2016, including police officers: 394 (327 officers - 268 male; 59 female).
| Officers per 1,000 residents here: | 2.96 |
| South Carolina average: | 2.40 |
Full-time law enforcement employees in 2015, including police officers: 395 (320 officers - 266 male; 54 female).
| Officers per 1,000 residents here: | 2.93 |
| South Carolina average: | 2.40 |
Full-time law enforcement employees in 2014, including police officers: 402 (329 officers - 278 male; 51 female).
| Officers per 1,000 residents here: | 3.12 |
| South Carolina average: | 2.19 |
Full-time law enforcement employees in 2013, including police officers: 431 (338 officers - 290 male; 48 female).
| Officers per 1,000 residents here: | 3.27 |
| South Carolina average: | 2.44 |
Full-time law enforcement employees in 2012, including police officers: 395 (316 officers - 265 male; 51 female).
| Officers per 1,000 residents here: | 3.14 |
| South Carolina average: | 2.36 |
Full-time law enforcement employees in 2011, including police officers: 404 (337 officers - 279 male; 58 female).
| Officers per 1,000 residents here: | 3.42 |
| South Carolina average: | 2.48 |
Full-time law enforcement employees in 2010, including police officers: 398 (315 officers - 267 male; 48 female).
| Officers per 1,000 residents here: | 3.23 |
| South Carolina average: | 2.45 |
Full-time law enforcement employees in 2009, including police officers: 408 (313 officers - 261 male; 52 female).
| Officers per 1,000 residents here: | 3.26 |
| South Carolina average: | 2.53 |
Full-time law enforcement employees in 2008, including police officers: 404 (310 officers - 261 male; 49 female).
| Officers per 1,000 residents here: | 3.34 |
| South Carolina average: | 2.53 |
Full-time law enforcement employees in 2007, including police officers: 388 (291 officers - 233 male; 58 female).
| Officers per 1,000 residents here: | 3.29 |
| South Carolina average: | 2.50 |
Full-time law enforcement employees in 2006, including police officers: 366 (285 officers - 232 male; 53 female).
| Officers per 1,000 residents here: | 3.25 |
| South Carolina average: | 2.48 |
Full-time law enforcement employees in 2005, including police officers: 358 (279 officers - 232 male; 47 female).
| Officers per 1,000 residents here: | 3.27 |
| South Carolina average: | 2.64 |
Full-time law enforcement employees in 2004, including police officers: 361 (274 officers - 234 male; 40 female).
| Officers per 1,000 residents here: | 3.32 |
| South Carolina average: | 2.52 |
Full-time law enforcement employees in 2003, including police officers: 344 (270 officers - 232 male; 38 female).
| Officers per 1,000 residents here: | 3.31 |
| South Carolina average: | 2.44 |


