Clarendon County, South Carolina (SC)
County owner-occupied free and clear houses and condos in 2010: 4,591
County owner-occupied houses and condos in 2000: 9,339
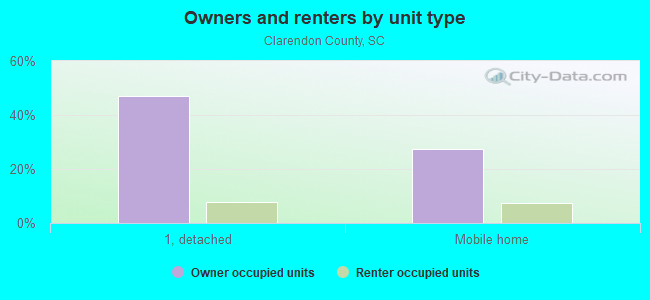
Renter-occupied apartments: 3,330 (it was 2,473 in 2000)
| % of renters here: | 21% |
| State: | 31% |
Land area: 607 sq. mi.
Water area: 88.5 sq. mi.
Population density: 53 people per square mile (average).
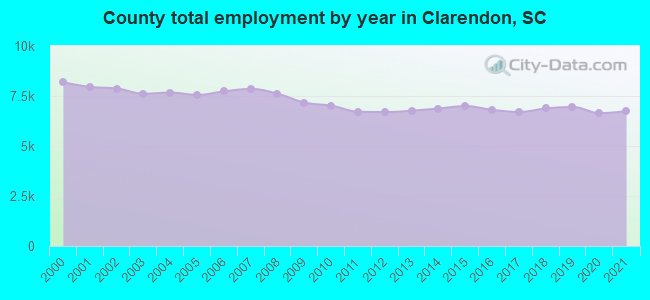
Industries providing employment: Educational, health and social services (20.1%), Manufacturing (13.4%), Retail trade (10.7%).
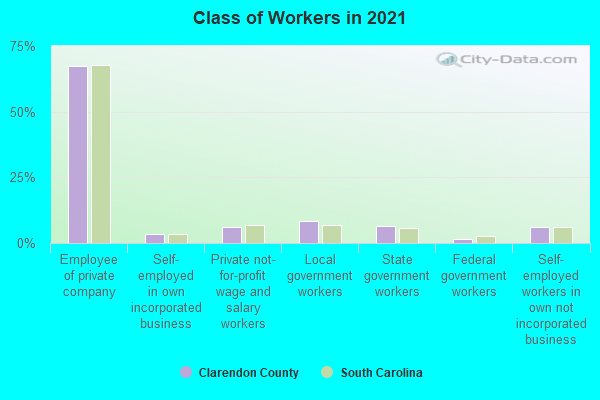
Type of workers:
- Private wage or salary: 77%
- Government: 17%
- Self-employed, not incorporated: 7%
- Unpaid family work: 0%
- OSM Map
- General Map
- Google Map
- MSN Map


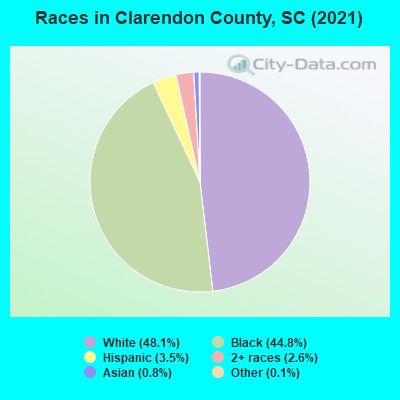
- 15,35948.5%White Non-Hispanic Alone
- 14,15244.7%Black Non-Hispanic Alone
- 1,1303.6%Hispanic or Latino
- 6852.2%Two or more races
- 2560.8%Asian alone
- 500.2%Some other race alone
- 480.2%American Indian and Alaska Native alone
| Median resident age: | 46.1 years |
| South Carolina median age: | 40.5 years |
| Males: 15,749 | |
| Females: 16,261 |

 | Wealthiest or most prosperous rural areas of SC? (25 replies) |
| Coastal SC Continues Blazing Growth (46 replies) |
| Growth (345 replies) |
| will someone step up to save this sweet dog in Manning? (0 replies) |
| Which Metros will gain Counties??? (88 replies) |
| Bicycle-manufacturer bringing 175 jobs to South Carolina (1 reply) |
| Clarendon County: | 2.0 people |
| South Carolina: | 2 people |
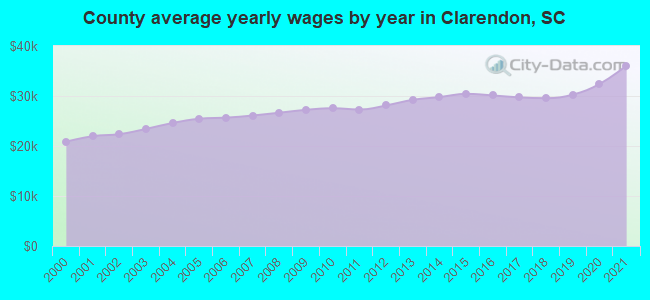
Estimated median household income in 2022: $49,053 ($27,131 in 1999)
| This county: | $49,053 |
| South Carolina: | $64,115 |
Median contract rent in 2022 for apartments: $476 (lower quartile is $311, upper quartile is $626)
| This county: | $476 |
| State: | $893 |
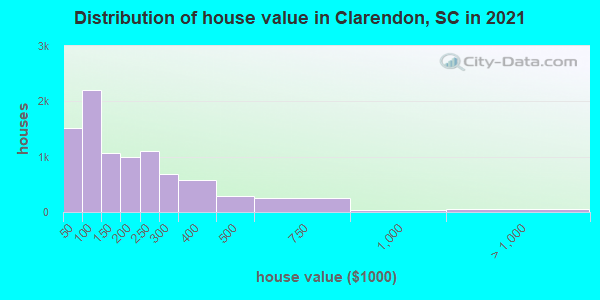
Estimated median house or condo value in 2022: $157,800 (it was $59,700 in 2000)
| Clarendon: | $157,800 |
| South Carolina: | $254,600 |
Mean price in 2022:
Median monthly housing costs for homes and condos with a mortgage: $1,100Detached houses: $278,335
Here: $278,335 State: $368,255 Townhouses or other attached units: $192,241
Here: $192,241 State: $292,023 In 5-or-more-unit structures: $267,658
Here: $267,658 State: $326,361 Mobile homes: $104,037
Here: $104,037 State: $102,531
Median monthly housing costs for units without a mortgage: $363
Institutionalized population: 1,608
Crime in 2021 (reported by the sheriff's office or county police, not the county total):
- Murders: 4
- Rapes: 15
- Robberies: 7
- Assaults: 148
- Burglaries: 172
- Thefts: 364
- Auto thefts: 57
Crime in 2020 (reported by the sheriff's office or county police, not the county total):
- Murders: 3
- Rapes: 11
- Robberies: 9
- Assaults: 90
- Burglaries: 159
- Thefts: 420
- Auto thefts: 49

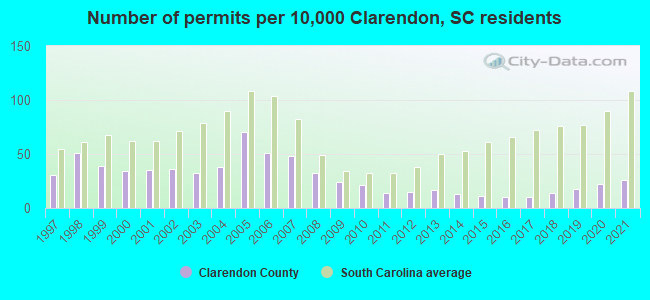
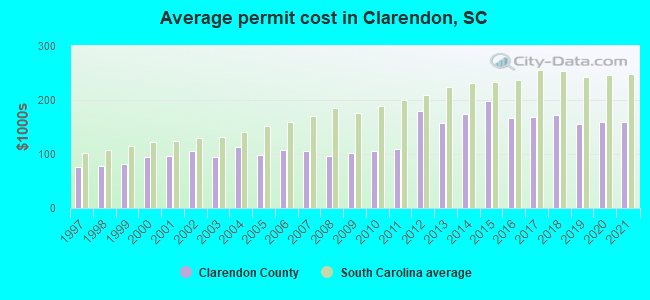
Single-family new house construction building permits:
- 2022: 100 buildings, average cost: $196,200
- 2021: 84 buildings, average cost: $160,200
- 2020: 73 buildings, average cost: $160,300
- 2019: 60 buildings, average cost: $155,700
- 2018: 46 buildings, average cost: $172,900
- 2017: 34 buildings, average cost: $168,200
- 2016: 32 buildings, average cost: $166,100
- 2015: 37 buildings, average cost: $199,400
- 2014: 41 buildings, average cost: $175,400
- 2013: 54 buildings, average cost: $157,000
- 2012: 49 buildings, average cost: $178,900
- 2011: 44 buildings, average cost: $109,700
- 2010: 68 buildings, average cost: $105,200
- 2009: 77 buildings, average cost: $102,400
- 2008: 105 buildings, average cost: $97,200
- 2007: 156 buildings, average cost: $104,900
- 2006: 167 buildings, average cost: $107,100
- 2005: 228 buildings, average cost: $98,600
- 2004: 122 buildings, average cost: $113,200
- 2003: 103 buildings, average cost: $95,400
- 2002: 117 buildings, average cost: $105,300
- 2001: 114 buildings, average cost: $95,900
- 2000: 109 buildings, average cost: $95,300
- 1999: 128 buildings, average cost: $80,800
- 1998: 165 buildings, average cost: $78,300
- 1997: 101 buildings, average cost: $76,200
Median real estate property taxes paid for housing units with mortgages in 2022: $996 (0.5%)
Median real estate property taxes paid for housing units with no mortgage in 2022: $694 (0.6%)


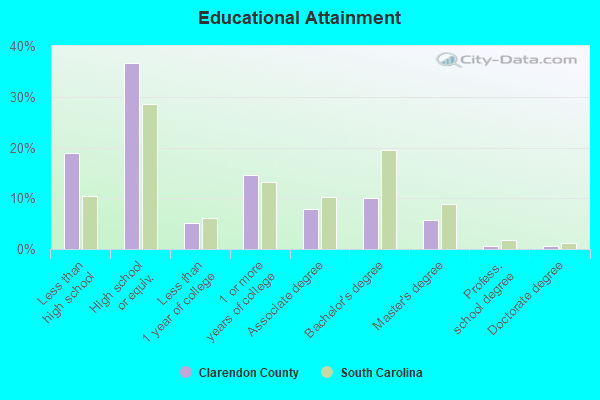
| Clarendon County: | 19.0% |
| South Carolina: | 14.0% |
Median age of residents in 2022: 46.1 years old
(Males: 43.6 years old, Females: 49.3 years old)
(Median age for: White residents: 51.4 years old, Black residents: 41.3 years old, American Indian residents: 53.2 years old, Asian residents: 35.8 years old, Hispanic or Latino residents: 33.5 years old, Other race residents: 33.6 years old)
Fair market rent in 2006 for a 1-bedroom apartment in Clarendon County is $420 a month.
Fair market rent for a 2-bedroom apartment is $504 a month.
Fair market rent for a 3-bedroom apartment is $604 a month.
Cities in this county include: Manning, Sardinia, Alcolu, Summerton, Turbeville, Paxville.
Neighboring counties: Lee County  , Lexington County
  , Lee County, Mississippi
  , Ventura County, California , Henry County, Georgia , Taliaferro County, Georgia .
| Here: | 4.1% |
| South Carolina: | 3.1% |

Current college students: 883
People 25 years of age or older with a high school degree or higher: 80.9%
People 25 years of age or older with a bachelor's degree or higher: 16.6%
Number of foreign born residents: 581 (33.3% naturalized citizens)
| Clarendon County: | 1.8% |
| Whole state: | 5.2% |
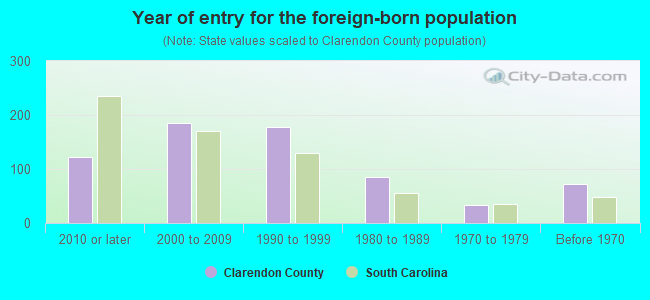
- Year of entry for the foreign-born population
- 1602010 or later
- 922000 to 2009
- 1581990 to 1999
- 851980 to 1989
- 331970 to 1979
- 72Before 1970
Mean travel time to work (commute): minutes
Percentage of county residents living and working in this county: 98.6%
Housing units in structures:
- One, detached: 9,400
- One, attached: 102
- Two: 114
- 3 or 4: 299
- 5 to 9: 229
- 10 to 19: 124
- 20 to 49: 221
- 50 or more: 123
- Mobile homes: 5,662
- Boats, RVs, vans, etc.: 42
Housing units in Clarendon County with a mortgage: 3,967 (256 second mortgage, 4 home equity loan, 184 both second mortgage and home equity loan)
Houses without a mortgage: 18
| Here: | 14.3% with mortgage |
| State: | 97.3% with mortgage |
Religion statistics for Clarendon County
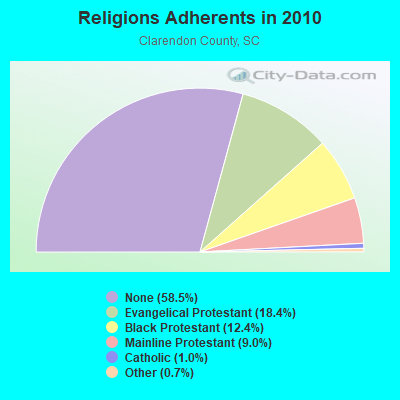

| Religion | Adherents | Congregations |
|---|---|---|
| Evangelical Protestant | 6,420 | 51 |
| Black Protestant | 4,340 | 28 |
| Mainline Protestant | 3,144 | 19 |
| Catholic | 360 | 2 |
| Other | 247 | 2 |
| None | 20,460 | - |
Source: Clifford Grammich, Kirk Hadaway, Richard Houseal, Dale E.Jones, Alexei Krindatch, Richie Stanley and Richard H.Taylor. 2012. 2010 U.S.Religion Census: Religious Congregations & Membership Study. Association of Statisticians of American Religious Bodies. Jones, Dale E., et al. 2002. Congregations and Membership in the United States 2000. Nashville, TN: Glenmary Research Center.
Food Environment Statistics:
| Clarendon County: | 2.45 / 10,000 pop. |
| State: | 1.99 / 10,000 pop. |
| This county: | 2.14 / 10,000 pop. |
| South Carolina: | 0.85 / 10,000 pop. |
| Clarendon County: | 7.04 / 10,000 pop. |
| South Carolina: | 5.38 / 10,000 pop. |
| This county: | 5.20 / 10,000 pop. |
| State: | 7.75 / 10,000 pop. |
| Clarendon County: | 13.0% |
| South Carolina: | 10.6% |
| Clarendon County: | 33.6% |
| State: | 29.4% |
| Here: | 13.6% |
| State: | 13.4% |
Agriculture in Clarendon County:
Average size of farms: 379 acresAverage value of agricultural products sold per farm: $157,999
Average value of crops sold per acre for harvested cropland: $393.63
The value of nursery, greenhouse, floriculture, and sod as a percentage of the total market value of agricultural products sold: 5.85%
The value of livestock, poultry, and their products as a percentage of the total market value of agricultural products sold: 54.36%
Average total farm production expenses per farm: $132,345
Harvested cropland as a percentage of land in farms: 48.31%
Irrigated harvested cropland as a percentage of land in farms: 2.26%
Average market value of all machinery and equipment per farm: $107,221
The percentage of farms operated by a family or individual: 91.03%
Average age of principal farm operators: 56 years
Average number of cattle and calves per 100 acres of all land in farms: 3.27
Corn for grain: 32124 harvested acres
All wheat for grain: 12932 harvested acres
Upland cotton: 3238 harvested acres
Soybeans for beans: 22985 harvested acres
Vegetables: 3,906 harvested acres
Land in orchards: 101 acres
Earthquake activity:
Clarendon County-area historical earthquake activity is significantly above South Carolina state average. It is 42% smaller than the overall U.S. average.On 11/22/1974 at 05:25:55, a magnitude 4.7 (4.7 MB, Class: Light, Intensity: IV - V) earthquake occurred 53.9 miles away from Clarendon County center
On 8/2/1974 at 08:52:09, a magnitude 4.9 (4.3 MB, 4.9 LG) earthquake occurred 131.3 miles away from the county center
On 8/23/2011 at 17:51:04, a magnitude 5.8 (5.8 MW, Depth: 3.7 mi, Class: Moderate, Intensity: VI - VII) earthquake occurred 319.5 miles away from the county center
On 8/21/1992 at 16:31:55, a magnitude 4.4 (4.1 MB, 4.1 LG, 4.4 LG, Depth: 6.2 mi) earthquake occurred 43.7 miles away from the county center
On 8/9/2020 at 12:07:37, a magnitude 5.1 (5.1 MW, Depth: 4.7 mi) earthquake occurred 199.8 miles away from Clarendon County center
On 4/17/1995 at 13:45:57, a magnitude 3.9 (3.9 LG, Depth: 6.2 mi, Class: Light, Intensity: II - III) earthquake occurred 51.2 miles away from the county center
Magnitude types: regional Lg-wave magnitude (LG), body-wave magnitude (MB), moment magnitude (MW)
Most recent natural disasters:
- South Carolina Covid-19 Pandemic, Incident Period: January 20, 2020, FEMA Id: 4492, Natural disaster type: Other
- South Carolina Hurricane Florence, Incident Period: September 8, 2018 - October 8, 2018, FEMA Id: 4394, Natural disaster type: Hurricane
- South Carolina Hurricane Irma, Incident Period: September 6, 2017 - September 13, 2017, FEMA Id: 4346, Natural disaster type: Hurricane
- South Carolina Hurricane Matthew, Incident Period: October 04, 2016 to October 30, 2016, Emergency Declared EM-3378: October 06, 2016, FEMA Id: 3378, Natural disaster type: Hurricane
- South Carolina Hurricane Matthew, Incident Period: October 04, 2016 to October 30, 2016, Major Disaster (Presidential) Declared DR-4286: October 11, 2016, FEMA Id: 4286, Natural disaster type: Hurricane
- South Carolina Severe Storms and Flooding, Incident Period: October 01, 2015 to October 23, 2015, Emergency Declared EM-3373: October 03, 2015, FEMA Id: 3373, Natural disaster type: Storm, Flood
- South Carolina Severe Storms and Flooding, Incident Period: October 01, 2015 to October 23, 2015, Major Disaster (Presidential) Declared DR-4241: October 05, 2015, FEMA Id: 4241, Natural disaster type: Storm, Flood
- South Carolina Severe Winter Storm, Incident Period: February 10, 2014 to February 19, 2014, Emergency Declared EM-3369: February 12, 2014, FEMA Id: 3369, Natural disaster type: Winter Storm
- South Carolina Severe Winter Storm, Incident Period: February 10, 2014 to February 15, 2014, Major Disaster (Presidential) Declared DR-4166: March 12, 2014, FEMA Id: 4166, Natural disaster type: Winter Storm
- South Carolina Hurricane Katrina Evacuation, Incident Period: August 29, 2005 to October 01, 2005, Emergency Declared EM-3233: September 10, 2005, FEMA Id: 3233, Natural disaster type: Hurricane
- 6 other natural disasters have been reported since 1953.
The number of natural disasters in Clarendon County (16) is near the US average (15).
Major Disasters (Presidential) Declared: 8
Emergencies Declared: 5
Causes of natural disasters: Hurricanes: 8, Winter Storms: 3, Floods: 2, Storms: 2, Ice Storm: 1, Tropical Storm: 1, Other: 1 (Note: some incidents may be assigned to more than one category).
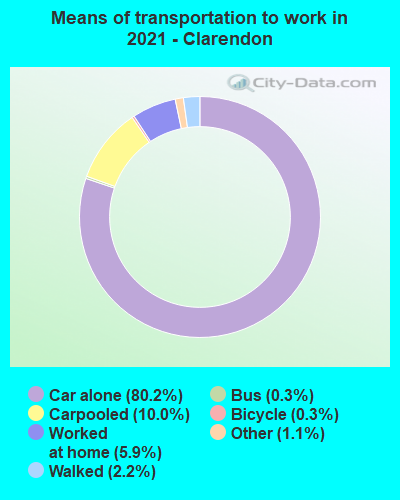
Means of transportation to work:
- Drove a car alone: 5,833 (74.2%)
- Carpooled: 819 (10.4%)
- Bus: 12 (0.2%)
- Taxicab, motorcycle, or other means: 137 (1.7%)
- Bicycle: 6 (0.1%)
- Walked: 163 (2.1%)
- Worked at home: 887 (11.3%)
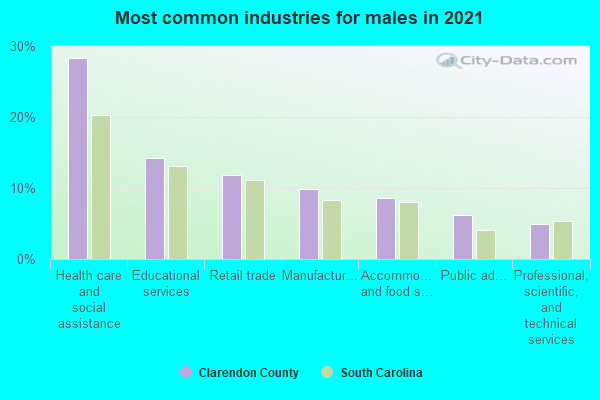
- Health care and social assistance (27%)
- Retail trade (13%)
- Accommodation and food services (12%)
- Educational services (11%)
- Manufacturing (10%)
- Public administration (7%)
- Finance and insurance (6%)

- Health care and social assistance (24%)
- Retail trade (12%)
- Accommodation and food services (11%)
- Educational services (10%)
- Manufacturing (9%)
- Public administration (7%)
- Finance and insurance (6%)

- Management occupations (13%)
- Construction and extraction occupations (12%)
- Production occupations (11%)
- Material moving occupations (9%)
- Transportation occupations (8%)
- Sales and related occupations (7%)
- Installation, maintenance, and repair occupations (6%)
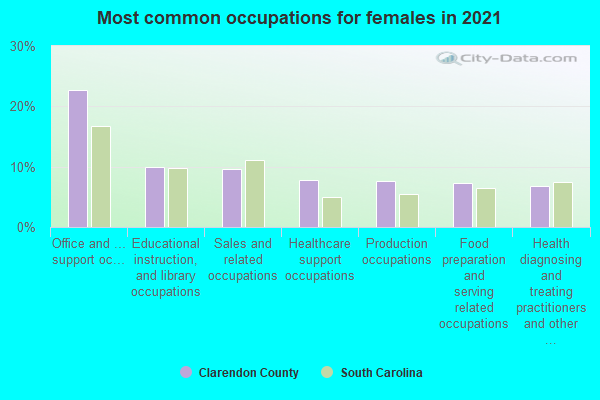
- Office and administrative support occupations (23%)
- Sales and related occupations (11%)
- Educational instruction, and library occupations (9%)
- Healthcare support occupations (8%)
- Production occupations (7%)
- Management occupations (7%)
- Health diagnosing and treating practitioners and other technical occupations (7%)
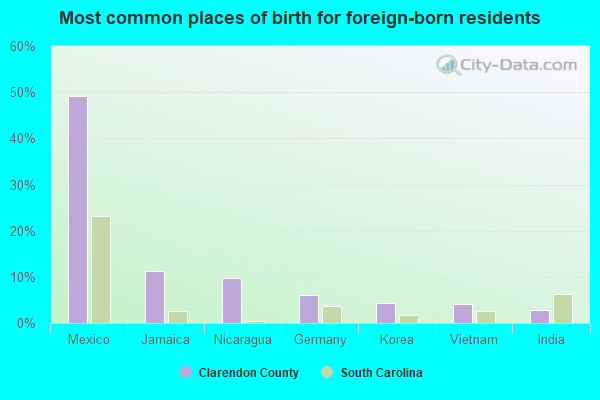
- Mexico (48%)
- Jamaica (10%)
- Germany (7%)
- Korea (6%)
- India (5%)
- China, excluding Hong Kong and Taiwan (2%)
- England (2%)

- American (11%)
- English (6%)
- Irish (3%)
- Scotch-Irish (3%)
- German (3%)
- Scottish (1%)
- Italian (1%)

People in group quarters in Clarendon County, South Carolina in 2010:
- 1,390 people in state prisons
- 92 people in local jails and other municipal confinement facilities
- 80 people in nursing facilities/skilled-nursing facilities
- 27 people in residential treatment centers for juveniles (non-correctional)
- 20 people in residential treatment centers for adults
- 19 people in group homes for juveniles (non-correctional)
- 17 people in group homes intended for adults
- 12 people in other noninstitutional facilities
- 4 people in emergency and transitional shelters (with sleeping facilities) for people experiencing homelessness
People in group quarters in Clarendon County, South Carolina in 2000:
- 1,140 people in state prisons
- 152 people in nursing homes
- 75 people in local jails and other confinement facilities (including police lockups)
- 64 people in other noninstitutional group quarters
- 56 people in homes for the mentally retarded
- 28 people in homes for abused, dependent, and neglected children
- 11 people in wards in general hospitals for patients who have no usual home elsewhere
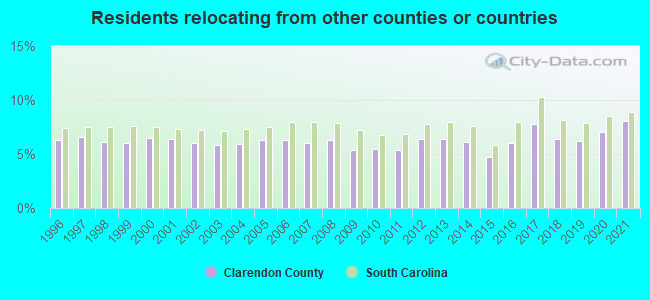
8.10% of this county's 2021 resident taxpayers lived in other counties in 2020 ($57,342 average adjusted gross income)
| Here: | 8.10% |
| South Carolina average: | 8.89% |
10 or fewer of this county's residents moved from foreign countries.
5.32% relocated from other counties in South Carolina ($29,839 average AGI)
2.78% relocated from other states ($27,503 average AGI)
Clarendon County: 2.78% South Carolina average: 4.96%
Top counties from which taxpayers relocated into this county between 2020 and 2021:
| from Sumter County, SC | |
| from Florence County, SC | |
| from Richland County, SC | |
| from Berkeley County, SC | |
| from Charleston County, SC | |
| from Williamsburg County, SC | |
| from Dorchester County, SC |
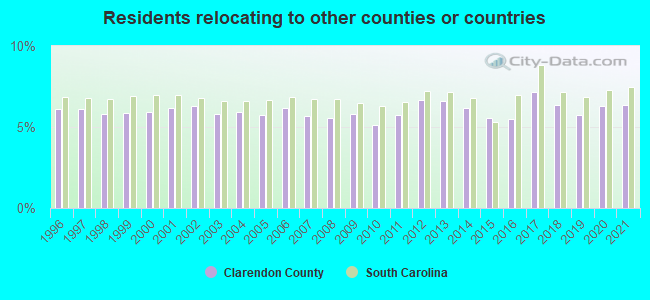
6.35% of this county's 2020 resident taxpayers moved to other counties in 2021 ($41,295 average adjusted gross income)
| Here: | 6.35% |
| South Carolina average: | 7.46% |
10 or fewer of this county's residents moved to foreign countries.
4.73% relocated to other counties in South Carolina ($28,803 average AGI)
1.61% relocated to other states ($12,493 average AGI)
Clarendon County: 1.61% South Carolina average: 3.47%
Top counties to which taxpayers relocated from this county between 2020 and 2021:
| to Sumter County, SC | |
| to Florence County, SC | |
| to Richland County, SC | |
| to Orangeburg County, SC | |
| to Williamsburg County, SC |
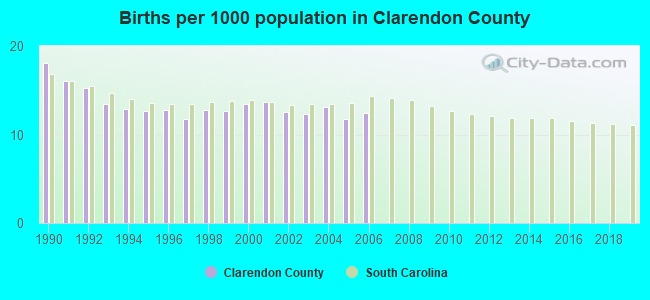
Births per 1000 population from 1990 to 1999: 13.8
Births per 1000 population from 2000 to 2006: 12.8
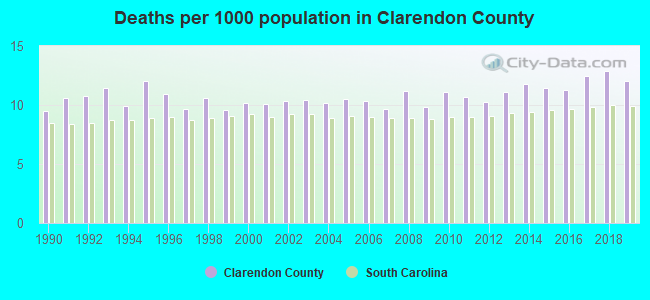
Deaths per 1000 population from 1990 to 1999: 10.5
Deaths per 1000 population from 2000 to 2009: 10.3
Deaths per 1000 population from 2010 to 2020: 12.0
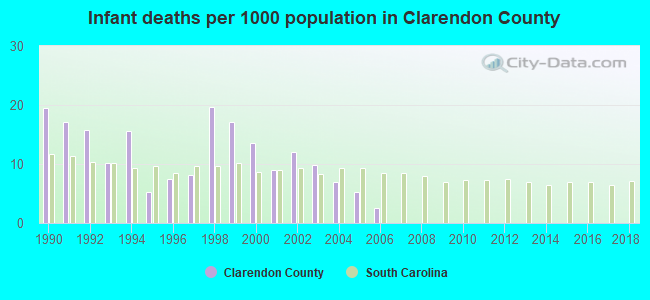
Infant deaths per 1000 live births from 1990 to 1999: 13.6
Infant deaths per 1000 live births from 2000 to 2006: 8.4
Persons under 19 years old without health insurance coverage in 2018: 4.8%


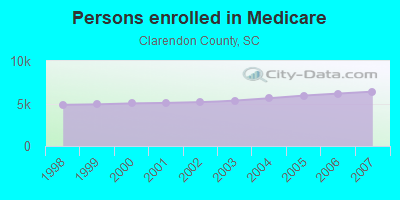
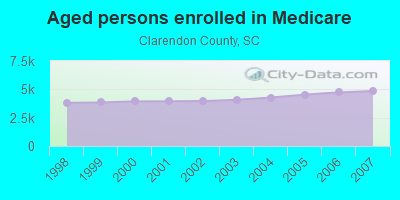
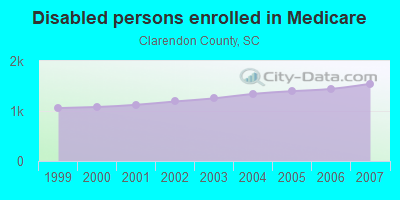
Persons enrolled in hospital insurance and/or supplemental medical insurance (Medicare) in July 1, 2007: 6,396 (4,851 aged, 1,545 disabled)
Children under 18 without health insurance coverage in 2007: 693 (9%)
Most common underlying causes of death in Clarendon County, South Carolina in 1999 - 2019:
- Bronchus or lung, unspecified - Malignant neoplasms (503)
- Acute myocardial infarction, unspecified (379)
- Stroke, not specified as haemorrhage or infarction (333)
- Atherosclerotic heart disease (328)
- Chronic obstructive pulmonary disease, unspecified (197)
- Unspecified dementia (137)
- Other ill-defined and unspecified causes of mortality (129)
- Alzheimer disease, unspecified (102)
- Congestive heart failure (101)
- Atherosclerotic cardiovascular disease, so described (84)
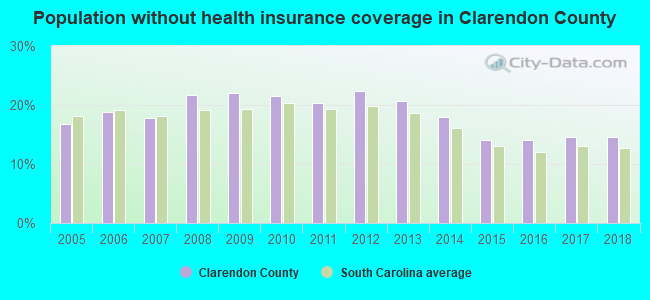
Population without health insurance coverage in 2000: 19%
Children under 18 without health insurance coverage in 2000: 15%
Short term general hospital admissions per 100,000 population in 2004: 7,817
Short term general hospital beds per 100,000 population in 2004: 169
Emergency room visits per 100,000 population in 2004: 60,250
General practice office based MDs per 100,000 population in 2005: 1,469
Medical specialist MDs per 100,000 population in 2005: 1,124
Dentists per 100,000 population in 1998: 3
Total births per 100,000 population, July 2005 - July 2006 : 19
Total deaths per 100,000 population, July 2005 - July 2006: 66
Limited-service eating places per 100,000 population in 2005 : 3
EPA green book nonattainment status in 2004-2006: 1
Crimes per 100,000 population in 1996: 1
Homicides per 1,000,000 population from 2000 to 2006: 122.4. This is more than state average.
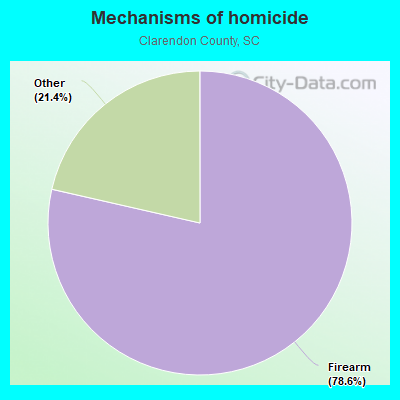
- Firearm - 96.1
- Other - 26.2
Suicides per 1,000,000 population from 2000 to 2006: 126.7. This is more than state average.

- Firearm - 100.5
- Other - 26.2
Household type by relationship:
Households: 32,010- Male householders: 4,892 (1,446 living alone), Female householders: 7,469 (2,490 living alone)
5,463 spouses (5,411 opposite-sex spouses), 503 unmarried partners, (502 opposite-sex unmarried partners), 7,985 children (7,422 natural, 252 adopted, 309 stepchildren), 2,247 grandchildren, 543 brothers or sisters, 280 parents, 70 foster children, 606 other relatives, 545 non-relatives
- In group quarters: 1,356
Size of family households: 4,013 2-persons, 1,607 3-persons, 1,339 4-persons, 542 5-persons, 363 6-persons, 106 7-or-more-persons.
Size of nonfamily households: 3,941 1-person, 378 2-persons, 21 3-persons, 4 4-persons, 31 5-persons.
2,617 married couples with children.
1,462 single-parent households (290 men, 1,172 women).
96.9% of residents of Clarendon speak English at home.
2.0% of residents speak Spanish at home (67% speak English very well, 14% speak English well, 16% speak English not well, 2% don't speak English at all).
0.4% of residents speak other Indo-European language at home (87% speak English very well, 3% speak English well, 10% speak English not well).
0.6% of residents speak Asian or Pacific Island language at home (56% speak English very well, 29% speak English well, 15% speak English not well).
0.1% of residents speak other language at home (80% speak English very well, 20% speak English well).
In fiscal year 2004:
Federal Government expenditure: $225,441,000 ($6,799 per capita)
Department of Defense expenditure: $6,956,000
Federal direct payments to individuals for retirement and disability: $88,385,000
Federal other direct payments to individuals: $41,733,000
Federal direct payments not to individuals: $5,779,000
Federal grants: $84,351,000
Federal procurement contracts: $1,047,000 ($23,000 Department of Defense)
Federal salaries and wages: $4,146,000 ($338,000 Department of Defense)
Federal Government direct loans: $961,000
Federal guaranteed/insured loans: $6,420,000
Federal Government insurance: $27,871,000
Population change from April 1, 2000 to July 1, 2005:
Births: 2,276| Here: | 68 per 1000 residents |
| State: | 69 per 1000 residents |
Deaths: 1,744
| Here: | 52 per 1000 residents |
| State: | 46 per 1000 residents |
Net international migration: +125
| Here: | +4 per 1000 residents |
| State: | +9 per 1000 residents |
Net internal migration: +254
| Here: | +8 per 1000 residents |
| State: | +27 per 1000 residents |

Total withdrawal of fresh water for public supply: 1.83 millions of gallons per day (all from ground)
| Here: | 6.2 |
| State: | 6.4 |
| Here: | 4.8 |
| State: | 4.5 |
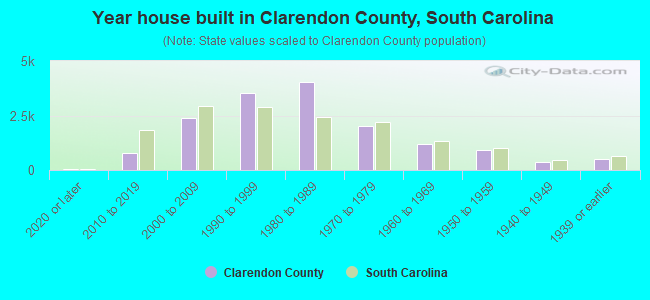
- Year house built in Clarendon County, South Carolina
- 662020 or later
- 8772010 to 2019
- 2,1782000 to 2009
- 3,6721990 to 1999
- 3,9911980 to 1989
- 1,9271970 to 1979
- 1,2331960 to 1969
- 9561950 to 1959
- 3541940 to 1949
- 5061939 or earlier

- Rooms in owner-occupied houses in Clarendon County, South Carolina
- 01 room
- 202 rooms
- 2863 rooms
- 9124 rooms
- 2,1115 rooms
- 1,9556 rooms
- 1,7057 rooms
- 1,2368 rooms
- 1,0689+ rooms

- Rooms in renter-occupied apartments in Clarendon County, South Carolina
- 681 room
- 692 rooms
- 4813 rooms
- 7724 rooms
- 6445 rooms
- 5866 rooms
- 1777 rooms
- 1288 rooms
- 989+ rooms

- Bedrooms in owner-occupied houses in Clarendon County, South Carolina
- 0no bedroom
- 251 bedroom
- 1,2472 bedrooms
- 5,3173 bedrooms
- 2,2484 bedrooms
- 4685+ bedrooms

- Bedrooms in renter-occupied apartments in Clarendon County, South Carolina
- 69no bedroom
- 5161 bedroom
- 8272 bedrooms
- 1,3083 bedrooms
- 3164 bedrooms
- 05+ bedrooms

- Cars and other vehicles available in Clarendon County in owner-occupied houses/condos
- 480no vehicle
- 2,3051 vehicle
- 3,8172 vehicles
- 1,7323 vehicles
- 6574 vehicles
- 3155+ vehicles
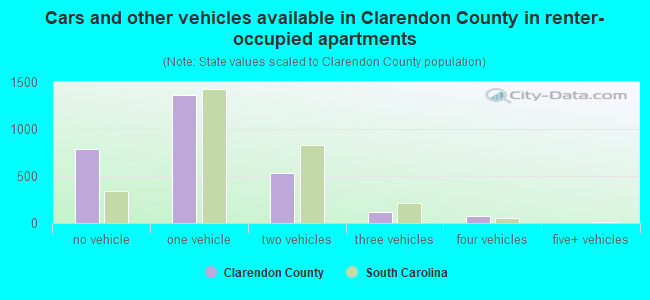
- Cars and other vehicles available in Clarendon County in renter-occupied apartments
- 879no vehicle
- 1,3931 vehicle
- 5762 vehicles
- 1313 vehicles
- 434 vehicles
- 05+ vehicles
90.8% of Clarendon County residents lived in the same house 1 years ago.
Out of people who lived in different houses, 32% lived in this county.
Out of people who lived in different counties, 52% lived in South Carolina.
| Clarendon County: | 90.8% |
| State average: | 86.5% |
Place of birth for U.S.-born residents:
- This state: 22,435
- Other state: 8,425
- Northeast: 3,213
- Midwest: 1,357
- South: 3,453
- West: 402
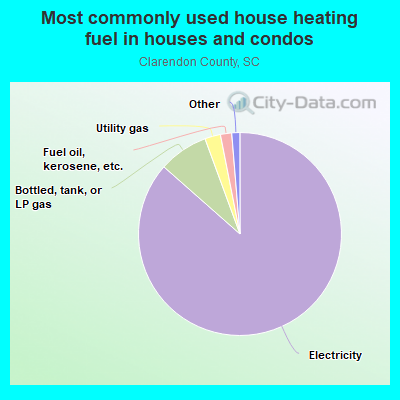
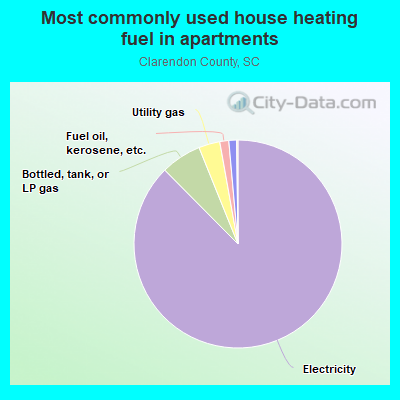
- 87.5%Electricity
- 6.9%Bottled, tank, or LP gas
- 2.6%Utility gas
- 1.2%Fuel oil, kerosene, etc.
- 1.1%Wood
- 0.6%No fuel used
- 0.1%Other fuel
- 89.4%Electricity
- 6.3%Bottled, tank, or LP gas
- 2.2%Utility gas
- 1.1%No fuel used
- 1.0%Fuel oil, kerosene, etc.
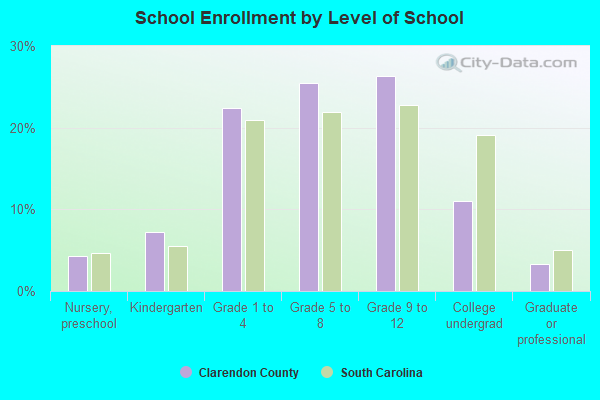
Private vs. public school enrollment:
| Here: | 17.3% |
| South Carolina: | 14.4% |
| Here: | 20.0% |
| South Carolina: | 11.1% |
| Here: | 16.8% |
| South Carolina: | 21.9% |

Clarendon County government finances - Expenditure in 2018:
- Bond Funds - Cash and Securities: $1,774,000
- Charges - Regular Highways: $965,000
Other: $783,000
Solid Waste Management: $306,000
Sewerage: $158,000
Parks and Recreation: $99,000
- Construction - General - Other: $989,000
Water Utilities: $497,000
Sewerage: $194,000
- Current Operations - General - Other: $7,818,000
Regular Highways: $4,972,000
Police Protection: $4,223,000
Local Fire Protection: $2,549,000
Correctional Institutions: $2,087,000
Solid Waste Management: $1,915,000
Judicial and Legal Services: $1,864,000
Financial Administration: $1,696,000
Health - Other: $1,051,000
Parks and Recreation: $885,000
Central Staff Services: $848,000
Libraries: $785,000
General Public Buildings: $615,000
Water Utilities: $408,000
Air Transportation: $169,000
Sewerage: $141,000
Natural Resources - Other: $43,000
- Federal Intergovernmental - Other: $816,000
Air Transportation: $21,000
- General - Interest on Debt: $613,000
- Local Intergovernmental - Other: $31,000
- Long Term Debt - Beginning Outstanding - Unspecified Public Purpose: $26,308,000
Outstanding Unspecified Public Purpose: $24,065,000
Retired Unspecified Public Purpose: $2,243,000
- Miscellaneous - Fines and Forfeits: $513,000
General Revenue - Other: $306,000
Special Assessments: $168,000
Interest Earnings: $66,000
Rents: $44,000
Sale of Property: $31,000
Donations From Private Sources: $3,000
- Other Capital Outlay - Local Fire Protection: $446,000
General - Other: $420,000
Regular Highways: $75,000
Police Protection: $29,000
- Other Funds - Cash and Securities: $9,123,000
- Revenue - Water Utilities: $603,000
- Sinking Funds - Cash and Securities: $2,010,000
- State Intergovernmental - Other: $3,030,000
Highways: $1,724,000
General Local Government Support: $221,000
- Tax - Property: $16,890,000
General Sales and Gross Receipts: $2,748,000
Motor Vehicle License: $1,723,000
Other Selective Sales: $556,000
Other License: $119,000
- Total Salaries and Wages: $12,112,000
- Water Utilities - Interest on Debt: $130,000
Clarendon County government finances - Revenue in 2018:
- Bond Funds - Cash and Securities: $1,774,000
- Charges - Regular Highways: $965,000
Other: $783,000
Solid Waste Management: $306,000
Sewerage: $158,000
Parks and Recreation: $99,000
- Construction - General - Other: $989,000
Water Utilities: $497,000
Sewerage: $194,000
- Current Operations - General - Other: $7,818,000
Regular Highways: $4,972,000
Police Protection: $4,223,000
Local Fire Protection: $2,549,000
Correctional Institutions: $2,087,000
Solid Waste Management: $1,915,000
Judicial and Legal Services: $1,864,000
Financial Administration: $1,696,000
Health - Other: $1,051,000
Parks and Recreation: $885,000
Central Staff Services: $848,000
Libraries: $785,000
General Public Buildings: $615,000
Water Utilities: $408,000
Air Transportation: $169,000
Sewerage: $141,000
Natural Resources - Other: $43,000
- Federal Intergovernmental - Other: $816,000
Air Transportation: $21,000
- General - Interest on Debt: $613,000
- Local Intergovernmental - Other: $31,000
- Long Term Debt - Beginning Outstanding - Unspecified Public Purpose: $26,308,000
Outstanding Unspecified Public Purpose: $24,065,000
Retired Unspecified Public Purpose: $2,243,000
- Miscellaneous - Fines and Forfeits: $513,000
General Revenue - Other: $306,000
Special Assessments: $168,000
Interest Earnings: $66,000
Rents: $44,000
Sale of Property: $31,000
Donations From Private Sources: $3,000
- Other Capital Outlay - Local Fire Protection: $446,000
General - Other: $420,000
Regular Highways: $75,000
Police Protection: $29,000
- Other Funds - Cash and Securities: $9,123,000
- Revenue - Water Utilities: $603,000
- Sinking Funds - Cash and Securities: $2,010,000
- State Intergovernmental - Other: $3,030,000
Highways: $1,724,000
General Local Government Support: $221,000
- Tax - Property: $16,890,000
General Sales and Gross Receipts: $2,748,000
Motor Vehicle License: $1,723,000
Other Selective Sales: $556,000
Other License: $119,000
- Total Salaries and Wages: $12,112,000
- Water Utilities - Interest on Debt: $130,000
Clarendon County government finances - Debt in 2018:
- Bond Funds - Cash and Securities: $1,774,000
- Charges - Regular Highways: $965,000
Other: $783,000
Solid Waste Management: $306,000
Sewerage: $158,000
Parks and Recreation: $99,000
- Construction - General - Other: $989,000
Water Utilities: $497,000
Sewerage: $194,000
- Current Operations - General - Other: $7,818,000
Regular Highways: $4,972,000
Police Protection: $4,223,000
Local Fire Protection: $2,549,000
Correctional Institutions: $2,087,000
Solid Waste Management: $1,915,000
Judicial and Legal Services: $1,864,000
Financial Administration: $1,696,000
Health - Other: $1,051,000
Parks and Recreation: $885,000
Central Staff Services: $848,000
Libraries: $785,000
General Public Buildings: $615,000
Water Utilities: $408,000
Air Transportation: $169,000
Sewerage: $141,000
Natural Resources - Other: $43,000
- Federal Intergovernmental - Other: $816,000
Air Transportation: $21,000
- General - Interest on Debt: $613,000
- Local Intergovernmental - Other: $31,000
- Long Term Debt - Beginning Outstanding - Unspecified Public Purpose: $26,308,000
Outstanding Unspecified Public Purpose: $24,065,000
Retired Unspecified Public Purpose: $2,243,000
- Miscellaneous - Fines and Forfeits: $513,000
General Revenue - Other: $306,000
Special Assessments: $168,000
Interest Earnings: $66,000
Rents: $44,000
Sale of Property: $31,000
Donations From Private Sources: $3,000
- Other Capital Outlay - Local Fire Protection: $446,000
General - Other: $420,000
Regular Highways: $75,000
Police Protection: $29,000
- Other Funds - Cash and Securities: $9,123,000
- Revenue - Water Utilities: $603,000
- Sinking Funds - Cash and Securities: $2,010,000
- State Intergovernmental - Other: $3,030,000
Highways: $1,724,000
General Local Government Support: $221,000
- Tax - Property: $16,890,000
General Sales and Gross Receipts: $2,748,000
Motor Vehicle License: $1,723,000
Other Selective Sales: $556,000
Other License: $119,000
- Total Salaries and Wages: $12,112,000
- Water Utilities - Interest on Debt: $130,000
Clarendon County government finances - Cash and Securities in 2018:
- Bond Funds - Cash and Securities: $1,774,000
- Charges - Regular Highways: $965,000
Other: $783,000
Solid Waste Management: $306,000
Sewerage: $158,000
Parks and Recreation: $99,000
- Construction - General - Other: $989,000
Water Utilities: $497,000
Sewerage: $194,000
- Current Operations - General - Other: $7,818,000
Regular Highways: $4,972,000
Police Protection: $4,223,000
Local Fire Protection: $2,549,000
Correctional Institutions: $2,087,000
Solid Waste Management: $1,915,000
Judicial and Legal Services: $1,864,000
Financial Administration: $1,696,000
Health - Other: $1,051,000
Parks and Recreation: $885,000
Central Staff Services: $848,000
Libraries: $785,000
General Public Buildings: $615,000
Water Utilities: $408,000
Air Transportation: $169,000
Sewerage: $141,000
Natural Resources - Other: $43,000
- Federal Intergovernmental - Other: $816,000
Air Transportation: $21,000
- General - Interest on Debt: $613,000
- Local Intergovernmental - Other: $31,000
- Long Term Debt - Beginning Outstanding - Unspecified Public Purpose: $26,308,000
Outstanding Unspecified Public Purpose: $24,065,000
Retired Unspecified Public Purpose: $2,243,000
- Miscellaneous - Fines and Forfeits: $513,000
General Revenue - Other: $306,000
Special Assessments: $168,000
Interest Earnings: $66,000
Rents: $44,000
Sale of Property: $31,000
Donations From Private Sources: $3,000
- Other Capital Outlay - Local Fire Protection: $446,000
General - Other: $420,000
Regular Highways: $75,000
Police Protection: $29,000
- Other Funds - Cash and Securities: $9,123,000
- Revenue - Water Utilities: $603,000
- Sinking Funds - Cash and Securities: $2,010,000
- State Intergovernmental - Other: $3,030,000
Highways: $1,724,000
General Local Government Support: $221,000
- Tax - Property: $16,890,000
General Sales and Gross Receipts: $2,748,000
Motor Vehicle License: $1,723,000
Other Selective Sales: $556,000
Other License: $119,000
- Total Salaries and Wages: $12,112,000
- Water Utilities - Interest on Debt: $130,000
Supplemental Security Income (SSI) in 2006:
- Total number of recipients: 1,775
- Number of aged recipients: 264
- Number of blind and disabled recipients: 1,511
- Number of recipients under 18: 239
- Number of recipients between 18 and 64: 965
- Number of recipients older than 64: 571
- Number of recipients also receiving OASDI: 796
- Amount of payments (thousands of dollars): 747
| Most common first names in Clarendon County, SC among deceased individuals | ||
| Name | Count | Lived (average) |
|---|---|---|
| James | 291 | 69.9 years |
| Mary | 224 | 77.1 years |
| John | 205 | 72.1 years |
| William | 184 | 69.8 years |
| Robert | 140 | 70.5 years |
| Willie | 124 | 69.9 years |
| Annie | 104 | 76.5 years |
| George | 94 | 70.7 years |
| Thomas | 92 | 69.5 years |
| Joseph | 85 | 69.2 years |
| Most common last names in Clarendon County, SC among deceased individuals | ||
| Last name | Count | Lived (average) |
|---|---|---|
| Johnson | 170 | 72.9 years |
| Green | 112 | 73.8 years |
| Ragin | 90 | 70.7 years |
| White | 78 | 75.0 years |
| Coker | 78 | 72.0 years |
| Davis | 77 | 76.5 years |
| Brown | 76 | 71.4 years |
| Richburg | 72 | 76.3 years |
| Smith | 67 | 75.2 years |
| Nelson | 63 | 68.2 years |
| Businesses in Clarendon County, SC | ||||
| Name | Count | Name | Count | |
|---|---|---|---|---|
| Ace Hardware | 1 | McDonald's | 1 | |
| Advance Auto Parts | 1 | Nike | 2 | |
| Arby's | 1 | Pizza Hut | 1 | |
| AutoZone | 1 | Popeyes | 1 | |
| Baymont Inn | 1 | Quality | 1 | |
| Burger King | 1 | RadioShack | 1 | |
| CVS | 1 | Ramada | 1 | |
| Chevrolet | 1 | SONIC Drive-In | 1 | |
| Curves | 1 | Sears | 1 | |
| Dairy Queen | 1 | Subway | 2 | |
| Days Inn | 2 | Super 8 | 1 | |
| FedEx | 3 | Taco Bell | 1 | |
| Ford | 1 | U-Haul | 4 | |
| H&R Block | 1 | UPS | 3 | |
| Hardee's | 1 | Waffle House | 1 | |
| Hilton | 1 | Walmart | 1 | |
| KFC | 1 | |||