Zeeland, Michigan Submit your own pictures of this city and show them to the world
OSM Map
General Map
Google Map
MSN Map
OSM Map
General Map
Google Map
MSN Map
OSM Map
General Map
Google Map
MSN Map
OSM Map
General Map
Google Map
MSN Map
Please wait while loading the map...
Population in 2022: 5,671 (100% urban, 0% rural). Population change since 2000: -2.3%Males: 2,670 Females: 3,001
March 2022 cost of living index in Zeeland: 84.8 (less than average, U.S. average is 100) Percentage of residents living in poverty in 2022: 8.2%for White Non-Hispanic residents , 4.3% for Hispanic or Latino residents , 18.3% for two or more races residents )
Profiles of local businesses
Business Search - 14 Million verified businesses
Data:
Median household income ($)
Median household income (% change since 2000)
Household income diversity
Ratio of average income to average house value (%)
Ratio of average income to average rent
Median household income ($) - White
Median household income ($) - Black or African American
Median household income ($) - Asian
Median household income ($) - Hispanic or Latino
Median household income ($) - American Indian and Alaska Native
Median household income ($) - Multirace
Median household income ($) - Other Race
Median household income for houses/condos with a mortgage ($)
Median household income for apartments without a mortgage ($)
Races - White alone (%)
Races - White alone (% change since 2000)
Races - Black alone (%)
Races - Black alone (% change since 2000)
Races - American Indian alone (%)
Races - American Indian alone (% change since 2000)
Races - Asian alone (%)
Races - Asian alone (% change since 2000)
Races - Hispanic (%)
Races - Hispanic (% change since 2000)
Races - Native Hawaiian and Other Pacific Islander alone (%)
Races - Native Hawaiian and Other Pacific Islander alone (% change since 2000)
Races - Two or more races (%)
Races - Two or more races (% change since 2000)
Races - Other race alone (%)
Races - Other race alone (% change since 2000)
Racial diversity
Unemployment (%)
Unemployment (% change since 2000)
Unemployment (%) - White
Unemployment (%) - Black or African American
Unemployment (%) - Asian
Unemployment (%) - Hispanic or Latino
Unemployment (%) - American Indian and Alaska Native
Unemployment (%) - Multirace
Unemployment (%) - Other Race
Population density (people per square mile)
Population - Males (%)
Population - Females (%)
Population - Males (%) - White
Population - Males (%) - Black or African American
Population - Males (%) - Asian
Population - Males (%) - Hispanic or Latino
Population - Males (%) - American Indian and Alaska Native
Population - Males (%) - Multirace
Population - Males (%) - Other Race
Population - Females (%) - White
Population - Females (%) - Black or African American
Population - Females (%) - Asian
Population - Females (%) - Hispanic or Latino
Population - Females (%) - American Indian and Alaska Native
Population - Females (%) - Multirace
Population - Females (%) - Other Race
Coronavirus confirmed cases (Jun 08, 2024)
Deaths caused by coronavirus (Jun 08, 2024)
Coronavirus confirmed cases (per 100k population) (Jun 08, 2024)
Deaths caused by coronavirus (per 100k population) (Jun 08, 2024)
Daily increase in number of cases (Jun 08, 2024)
Weekly increase in number of cases (Jun 08, 2024)
Cases doubled (in days) (Jun 08, 2024)
Hospitalized patients (Apr 18, 2022)
Negative test results (Apr 18, 2022)
Total test results (Apr 18, 2022)
COVID Vaccine doses distributed (per 100k population) (Sep 19, 2023)
COVID Vaccine doses administered (per 100k population) (Sep 19, 2023)
COVID Vaccine doses distributed (Sep 19, 2023)
COVID Vaccine doses administered (Sep 19, 2023)
Likely homosexual households (%)
Likely homosexual households (% change since 2000)
Likely homosexual households - Lesbian couples (%)
Likely homosexual households - Lesbian couples (% change since 2000)
Likely homosexual households - Gay men (%)
Likely homosexual households - Gay men (% change since 2000)
Cost of living index
Median gross rent ($)
Median contract rent ($)
Median monthly housing costs ($)
Median house or condo value ($)
Median house or condo value ($ change since 2000)
Mean house or condo value by units in structure - 1, detached ($)
Mean house or condo value by units in structure - 1, attached ($)
Mean house or condo value by units in structure - 2 ($)
Mean house or condo value by units in structure by units in structure - 3 or 4 ($)
Mean house or condo value by units in structure - 5 or more ($)
Mean house or condo value by units in structure - Boat, RV, van, etc. ($)
Mean house or condo value by units in structure - Mobile home ($)
Median house or condo value ($) - White
Median house or condo value ($) - Black or African American
Median house or condo value ($) - Asian
Median house or condo value ($) - Hispanic or Latino
Median house or condo value ($) - American Indian and Alaska Native
Median house or condo value ($) - Multirace
Median house or condo value ($) - Other Race
Median resident age
Resident age diversity
Median resident age - Males
Median resident age - Females
Median resident age - White
Median resident age - Black or African American
Median resident age - Asian
Median resident age - Hispanic or Latino
Median resident age - American Indian and Alaska Native
Median resident age - Multirace
Median resident age - Other Race
Median resident age - Males - White
Median resident age - Males - Black or African American
Median resident age - Males - Asian
Median resident age - Males - Hispanic or Latino
Median resident age - Males - American Indian and Alaska Native
Median resident age - Males - Multirace
Median resident age - Males - Other Race
Median resident age - Females - White
Median resident age - Females - Black or African American
Median resident age - Females - Asian
Median resident age - Females - Hispanic or Latino
Median resident age - Females - American Indian and Alaska Native
Median resident age - Females - Multirace
Median resident age - Females - Other Race
Commute - mean travel time to work (minutes)
Travel time to work - Less than 5 minutes (%)
Travel time to work - Less than 5 minutes (% change since 2000)
Travel time to work - 5 to 9 minutes (%)
Travel time to work - 5 to 9 minutes (% change since 2000)
Travel time to work - 10 to 19 minutes (%)
Travel time to work - 10 to 19 minutes (% change since 2000)
Travel time to work - 20 to 29 minutes (%)
Travel time to work - 20 to 29 minutes (% change since 2000)
Travel time to work - 30 to 39 minutes (%)
Travel time to work - 30 to 39 minutes (% change since 2000)
Travel time to work - 40 to 59 minutes (%)
Travel time to work - 40 to 59 minutes (% change since 2000)
Travel time to work - 60 to 89 minutes (%)
Travel time to work - 60 to 89 minutes (% change since 2000)
Travel time to work - 90 or more minutes (%)
Travel time to work - 90 or more minutes (% change since 2000)
Marital status - Never married (%)
Marital status - Now married (%)
Marital status - Separated (%)
Marital status - Widowed (%)
Marital status - Divorced (%)
Median family income ($)
Median family income (% change since 2000)
Median non-family income ($)
Median non-family income (% change since 2000)
Median per capita income ($)
Median per capita income (% change since 2000)
Median family income ($) - White
Median family income ($) - Black or African American
Median family income ($) - Asian
Median family income ($) - Hispanic or Latino
Median family income ($) - American Indian and Alaska Native
Median family income ($) - Multirace
Median family income ($) - Other Race
Median year house/condo built
Median year apartment built
Year house built - Built 2005 or later (%)
Year house built - Built 2000 to 2004 (%)
Year house built - Built 1990 to 1999 (%)
Year house built - Built 1980 to 1989 (%)
Year house built - Built 1970 to 1979 (%)
Year house built - Built 1960 to 1969 (%)
Year house built - Built 1950 to 1959 (%)
Year house built - Built 1940 to 1949 (%)
Year house built - Built 1939 or earlier (%)
Average household size
Household density (households per square mile)
Average household size - White
Average household size - Black or African American
Average household size - Asian
Average household size - Hispanic or Latino
Average household size - American Indian and Alaska Native
Average household size - Multirace
Average household size - Other Race
Occupied housing units (%)
Vacant housing units (%)
Owner occupied housing units (%)
Renter occupied housing units (%)
Vacancy status - For rent (%)
Vacancy status - For sale only (%)
Vacancy status - Rented or sold, not occupied (%)
Vacancy status - For seasonal, recreational, or occasional use (%)
Vacancy status - For migrant workers (%)
Vacancy status - Other vacant (%)
Residents with income below the poverty level (%)
Residents with income below 50% of the poverty level (%)
Children below poverty level (%)
Poor families by family type - Married-couple family (%)
Poor families by family type - Male, no wife present (%)
Poor families by family type - Female, no husband present (%)
Poverty status for native-born residents (%)
Poverty status for foreign-born residents (%)
Poverty among high school graduates not in families (%)
Poverty among people who did not graduate high school not in families (%)
Residents with income below the poverty level (%) - White
Residents with income below the poverty level (%) - Black or African American
Residents with income below the poverty level (%) - Asian
Residents with income below the poverty level (%) - Hispanic or Latino
Residents with income below the poverty level (%) - American Indian and Alaska Native
Residents with income below the poverty level (%) - Multirace
Residents with income below the poverty level (%) - Other Race
Air pollution - Air Quality Index (AQI)
Air pollution - CO
Air pollution - NO2
Air pollution - SO2
Air pollution - Ozone
Air pollution - PM10
Air pollution - PM25
Air pollution - Pb
Crime - Murders per 100,000 population
Crime - Rapes per 100,000 population
Crime - Robberies per 100,000 population
Crime - Assaults per 100,000 population
Crime - Burglaries per 100,000 population
Crime - Thefts per 100,000 population
Crime - Auto thefts per 100,000 population
Crime - Arson per 100,000 population
Crime - City-data.com crime index
Crime - Violent crime index
Crime - Property crime index
Crime - Murders per 100,000 population (5 year average)
Crime - Rapes per 100,000 population (5 year average)
Crime - Robberies per 100,000 population (5 year average)
Crime - Assaults per 100,000 population (5 year average)
Crime - Burglaries per 100,000 population (5 year average)
Crime - Thefts per 100,000 population (5 year average)
Crime - Auto thefts per 100,000 population (5 year average)
Crime - Arson per 100,000 population (5 year average)
Crime - City-data.com crime index (5 year average)
Crime - Violent crime index (5 year average)
Crime - Property crime index (5 year average)
1996 Presidential Elections Results (%) - Democratic Party (Clinton)
1996 Presidential Elections Results (%) - Republican Party (Dole)
1996 Presidential Elections Results (%) - Other
2000 Presidential Elections Results (%) - Democratic Party (Gore)
2000 Presidential Elections Results (%) - Republican Party (Bush)
2000 Presidential Elections Results (%) - Other
2004 Presidential Elections Results (%) - Democratic Party (Kerry)
2004 Presidential Elections Results (%) - Republican Party (Bush)
2004 Presidential Elections Results (%) - Other
2008 Presidential Elections Results (%) - Democratic Party (Obama)
2008 Presidential Elections Results (%) - Republican Party (McCain)
2008 Presidential Elections Results (%) - Other
2012 Presidential Elections Results (%) - Democratic Party (Obama)
2012 Presidential Elections Results (%) - Republican Party (Romney)
2012 Presidential Elections Results (%) - Other
2016 Presidential Elections Results (%) - Democratic Party (Clinton)
2016 Presidential Elections Results (%) - Republican Party (Trump)
2016 Presidential Elections Results (%) - Other
2020 Presidential Elections Results (%) - Democratic Party (Biden)
2020 Presidential Elections Results (%) - Republican Party (Trump)
2020 Presidential Elections Results (%) - Other
Ancestries Reported - Arab (%)
Ancestries Reported - Czech (%)
Ancestries Reported - Danish (%)
Ancestries Reported - Dutch (%)
Ancestries Reported - English (%)
Ancestries Reported - French (%)
Ancestries Reported - French Canadian (%)
Ancestries Reported - German (%)
Ancestries Reported - Greek (%)
Ancestries Reported - Hungarian (%)
Ancestries Reported - Irish (%)
Ancestries Reported - Italian (%)
Ancestries Reported - Lithuanian (%)
Ancestries Reported - Norwegian (%)
Ancestries Reported - Polish (%)
Ancestries Reported - Portuguese (%)
Ancestries Reported - Russian (%)
Ancestries Reported - Scotch-Irish (%)
Ancestries Reported - Scottish (%)
Ancestries Reported - Slovak (%)
Ancestries Reported - Subsaharan African (%)
Ancestries Reported - Swedish (%)
Ancestries Reported - Swiss (%)
Ancestries Reported - Ukrainian (%)
Ancestries Reported - United States (%)
Ancestries Reported - Welsh (%)
Ancestries Reported - West Indian (%)
Ancestries Reported - Other (%)
Educational Attainment - No schooling completed (%)
Educational Attainment - Less than high school (%)
Educational Attainment - High school or equivalent (%)
Educational Attainment - Less than 1 year of college (%)
Educational Attainment - 1 or more years of college (%)
Educational Attainment - Associate degree (%)
Educational Attainment - Bachelor's degree (%)
Educational Attainment - Master's degree (%)
Educational Attainment - Professional school degree (%)
Educational Attainment - Doctorate degree (%)
School Enrollment - Nursery, preschool (%)
School Enrollment - Kindergarten (%)
School Enrollment - Grade 1 to 4 (%)
School Enrollment - Grade 5 to 8 (%)
School Enrollment - Grade 9 to 12 (%)
School Enrollment - College undergrad (%)
School Enrollment - Graduate or professional (%)
School Enrollment - Not enrolled in school (%)
School enrollment - Public schools (%)
School enrollment - Private schools (%)
School enrollment - Not enrolled (%)
Median number of rooms in houses and condos
Median number of rooms in apartments
Housing units lacking complete plumbing facilities (%)
Housing units lacking complete kitchen facilities (%)
Density of houses
Urban houses (%)
Rural houses (%)
Households with people 60 years and over (%)
Households with people 65 years and over (%)
Households with people 75 years and over (%)
Households with one or more nonrelatives (%)
Households with no nonrelatives (%)
Population in households (%)
Family households (%)
Nonfamily households (%)
Population in families (%)
Family households with own children (%)
Median number of bedrooms in owner occupied houses
Mean number of bedrooms in owner occupied houses
Median number of bedrooms in renter occupied houses
Mean number of bedrooms in renter occupied houses
Median number of vehichles in owner occupied houses
Mean number of vehichles in owner occupied houses
Median number of vehichles in renter occupied houses
Mean number of vehichles in renter occupied houses
Mortgage status - with mortgage (%)
Mortgage status - with second mortgage (%)
Mortgage status - with home equity loan (%)
Mortgage status - with both second mortgage and home equity loan (%)
Mortgage status - without a mortgage (%)
Average family size
Average family size - White
Average family size - Black or African American
Average family size - Asian
Average family size - Hispanic or Latino
Average family size - American Indian and Alaska Native
Average family size - Multirace
Average family size - Other Race
Geographical mobility - Same house 1 year ago (%)
Geographical mobility - Moved within same county (%)
Geographical mobility - Moved from different county within same state (%)
Geographical mobility - Moved from different state (%)
Geographical mobility - Moved from abroad (%)
Place of birth - Born in state of residence (%)
Place of birth - Born in other state (%)
Place of birth - Native, outside of US (%)
Place of birth - Foreign born (%)
Housing units in structures - 1, detached (%)
Housing units in structures - 1, attached (%)
Housing units in structures - 2 (%)
Housing units in structures - 3 or 4 (%)
Housing units in structures - 5 to 9 (%)
Housing units in structures - 10 to 19 (%)
Housing units in structures - 20 to 49 (%)
Housing units in structures - 50 or more (%)
Housing units in structures - Mobile home (%)
Housing units in structures - Boat, RV, van, etc. (%)
House/condo owner moved in on average (years ago)
Renter moved in on average (years ago)
Year householder moved into unit - Moved in 1999 to March 2000 (%)
Year householder moved into unit - Moved in 1995 to 1998 (%)
Year householder moved into unit - Moved in 1990 to 1994 (%)
Year householder moved into unit - Moved in 1980 to 1989 (%)
Year householder moved into unit - Moved in 1970 to 1979 (%)
Year householder moved into unit - Moved in 1969 or earlier (%)
Means of transportation to work - Drove car alone (%)
Means of transportation to work - Carpooled (%)
Means of transportation to work - Public transportation (%)
Means of transportation to work - Bus or trolley bus (%)
Means of transportation to work - Streetcar or trolley car (%)
Means of transportation to work - Subway or elevated (%)
Means of transportation to work - Railroad (%)
Means of transportation to work - Ferryboat (%)
Means of transportation to work - Taxicab (%)
Means of transportation to work - Motorcycle (%)
Means of transportation to work - Bicycle (%)
Means of transportation to work - Walked (%)
Means of transportation to work - Other means (%)
Working at home (%)
Industry diversity
Most Common Industries - Agriculture, forestry, fishing and hunting, and mining (%)
Most Common Industries - Agriculture, forestry, fishing and hunting (%)
Most Common Industries - Mining, quarrying, and oil and gas extraction (%)
Most Common Industries - Construction (%)
Most Common Industries - Manufacturing (%)
Most Common Industries - Wholesale trade (%)
Most Common Industries - Retail trade (%)
Most Common Industries - Transportation and warehousing, and utilities (%)
Most Common Industries - Transportation and warehousing (%)
Most Common Industries - Utilities (%)
Most Common Industries - Information (%)
Most Common Industries - Finance and insurance, and real estate and rental and leasing (%)
Most Common Industries - Finance and insurance (%)
Most Common Industries - Real estate and rental and leasing (%)
Most Common Industries - Professional, scientific, and management, and administrative and waste management services (%)
Most Common Industries - Professional, scientific, and technical services (%)
Most Common Industries - Management of companies and enterprises (%)
Most Common Industries - Administrative and support and waste management services (%)
Most Common Industries - Educational services, and health care and social assistance (%)
Most Common Industries - Educational services (%)
Most Common Industries - Health care and social assistance (%)
Most Common Industries - Arts, entertainment, and recreation, and accommodation and food services (%)
Most Common Industries - Arts, entertainment, and recreation (%)
Most Common Industries - Accommodation and food services (%)
Most Common Industries - Other services, except public administration (%)
Most Common Industries - Public administration (%)
Occupation diversity
Most Common Occupations - Management, business, science, and arts occupations (%)
Most Common Occupations - Management, business, and financial occupations (%)
Most Common Occupations - Management occupations (%)
Most Common Occupations - Business and financial operations occupations (%)
Most Common Occupations - Computer, engineering, and science occupations (%)
Most Common Occupations - Computer and mathematical occupations (%)
Most Common Occupations - Architecture and engineering occupations (%)
Most Common Occupations - Life, physical, and social science occupations (%)
Most Common Occupations - Education, legal, community service, arts, and media occupations (%)
Most Common Occupations - Community and social service occupations (%)
Most Common Occupations - Legal occupations (%)
Most Common Occupations - Education, training, and library occupations (%)
Most Common Occupations - Arts, design, entertainment, sports, and media occupations (%)
Most Common Occupations - Healthcare practitioners and technical occupations (%)
Most Common Occupations - Health diagnosing and treating practitioners and other technical occupations (%)
Most Common Occupations - Health technologists and technicians (%)
Most Common Occupations - Service occupations (%)
Most Common Occupations - Healthcare support occupations (%)
Most Common Occupations - Protective service occupations (%)
Most Common Occupations - Fire fighting and prevention, and other protective service workers including supervisors (%)
Most Common Occupations - Law enforcement workers including supervisors (%)
Most Common Occupations - Food preparation and serving related occupations (%)
Most Common Occupations - Building and grounds cleaning and maintenance occupations (%)
Most Common Occupations - Personal care and service occupations (%)
Most Common Occupations - Sales and office occupations (%)
Most Common Occupations - Sales and related occupations (%)
Most Common Occupations - Office and administrative support occupations (%)
Most Common Occupations - Natural resources, construction, and maintenance occupations (%)
Most Common Occupations - Farming, fishing, and forestry occupations (%)
Most Common Occupations - Construction and extraction occupations (%)
Most Common Occupations - Installation, maintenance, and repair occupations (%)
Most Common Occupations - Production, transportation, and material moving occupations (%)
Most Common Occupations - Production occupations (%)
Most Common Occupations - Transportation occupations (%)
Most Common Occupations - Material moving occupations (%)
People in Group quarters - Institutionalized population (%)
People in Group quarters - Correctional institutions (%)
People in Group quarters - Federal prisons and detention centers (%)
People in Group quarters - Halfway houses (%)
People in Group quarters - Local jails and other confinement facilities (including police lockups) (%)
People in Group quarters - Military disciplinary barracks (%)
People in Group quarters - State prisons (%)
People in Group quarters - Other types of correctional institutions (%)
People in Group quarters - Nursing homes (%)
People in Group quarters - Hospitals/wards, hospices, and schools for the handicapped (%)
People in Group quarters - Hospitals/wards and hospices for chronically ill (%)
People in Group quarters - Hospices or homes for chronically ill (%)
People in Group quarters - Military hospitals or wards for chronically ill (%)
People in Group quarters - Other hospitals or wards for chronically ill (%)
People in Group quarters - Hospitals or wards for drug/alcohol abuse (%)
People in Group quarters - Mental (Psychiatric) hospitals or wards (%)
People in Group quarters - Schools, hospitals, or wards for the mentally retarded (%)
People in Group quarters - Schools, hospitals, or wards for the physically handicapped (%)
People in Group quarters - Institutions for the deaf (%)
People in Group quarters - Institutions for the blind (%)
People in Group quarters - Orthopedic wards and institutions for the physically handicapped (%)
People in Group quarters - Wards in general hospitals for patients who have no usual home elsewhere (%)
People in Group quarters - Wards in military hospitals for patients who have no usual home elsewhere (%)
People in Group quarters - Juvenile institutions (%)
People in Group quarters - Long-term care (%)
People in Group quarters - Homes for abused, dependent, and neglected children (%)
People in Group quarters - Residential treatment centers for emotionally disturbed children (%)
People in Group quarters - Training schools for juvenile delinquents (%)
People in Group quarters - Short-term care, detention or diagnostic centers for delinquent children (%)
People in Group quarters - Type of juvenile institution unknown (%)
People in Group quarters - Noninstitutionalized population (%)
People in Group quarters - College dormitories (includes college quarters off campus) (%)
People in Group quarters - Military quarters (%)
People in Group quarters - On base (%)
People in Group quarters - Barracks, unaccompanied personnel housing (UPH), (Enlisted/Officer), ;and similar group living quarters for military personnel (%)
People in Group quarters - Transient quarters for temporary residents (%)
People in Group quarters - Military ships (%)
People in Group quarters - Group homes (%)
People in Group quarters - Homes or halfway houses for drug/alcohol abuse (%)
People in Group quarters - Homes for the mentally ill (%)
People in Group quarters - Homes for the mentally retarded (%)
People in Group quarters - Homes for the physically handicapped (%)
People in Group quarters - Other group homes (%)
People in Group quarters - Religious group quarters (%)
People in Group quarters - Dormitories (%)
People in Group quarters - Agriculture workers' dormitories on farms (%)
People in Group quarters - Job Corps and vocational training facilities (%)
People in Group quarters - Other workers' dormitories (%)
People in Group quarters - Crews of maritime vessels (%)
People in Group quarters - Other nonhousehold living situations (%)
People in Group quarters - Other noninstitutional group quarters (%)
Residents speaking English at home (%)
Residents speaking English at home - Born in the United States (%)
Residents speaking English at home - Native, born elsewhere (%)
Residents speaking English at home - Foreign born (%)
Residents speaking Spanish at home (%)
Residents speaking Spanish at home - Born in the United States (%)
Residents speaking Spanish at home - Native, born elsewhere (%)
Residents speaking Spanish at home - Foreign born (%)
Residents speaking other language at home (%)
Residents speaking other language at home - Born in the United States (%)
Residents speaking other language at home - Native, born elsewhere (%)
Residents speaking other language at home - Foreign born (%)
Class of Workers - Employee of private company (%)
Class of Workers - Self-employed in own incorporated business (%)
Class of Workers - Private not-for-profit wage and salary workers (%)
Class of Workers - Local government workers (%)
Class of Workers - State government workers (%)
Class of Workers - Federal government workers (%)
Class of Workers - Self-employed workers in own not incorporated business and Unpaid family workers (%)
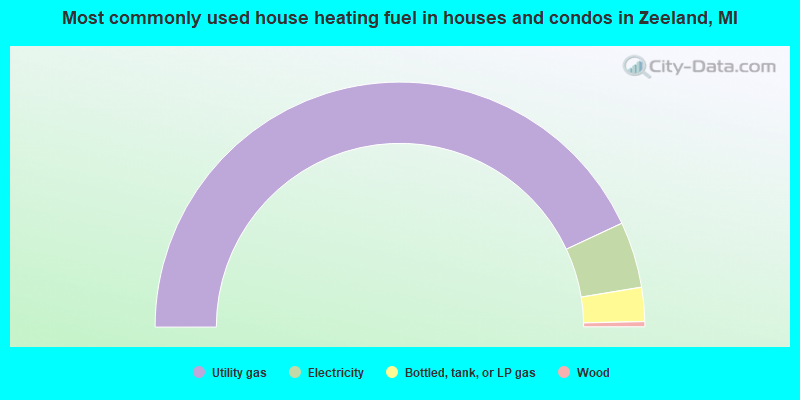
House heating fuel used in houses and condos - Utility gas (%)
House heating fuel used in houses and condos - Bottled, tank, or LP gas (%)
House heating fuel used in houses and condos - Electricity (%)
House heating fuel used in houses and condos - Fuel oil, kerosene, etc. (%)
House heating fuel used in houses and condos - Coal or coke (%)
House heating fuel used in houses and condos - Wood (%)
House heating fuel used in houses and condos - Solar energy (%)
House heating fuel used in houses and condos - Other fuel (%)
House heating fuel used in houses and condos - No fuel used (%)
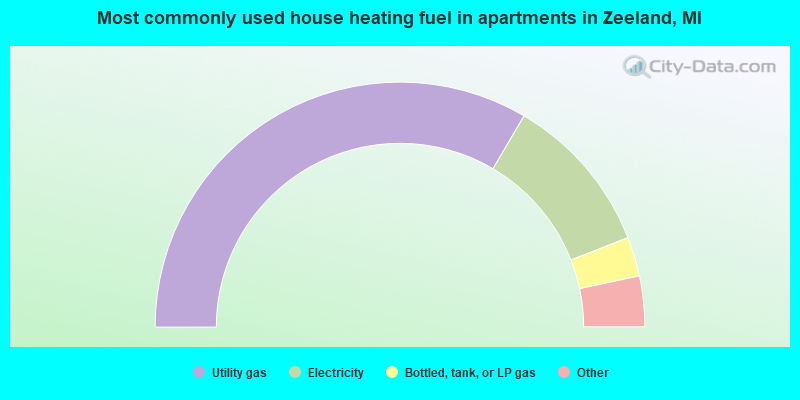
House heating fuel used in apartments - Utility gas (%)
House heating fuel used in apartments - Bottled, tank, or LP gas (%)
House heating fuel used in apartments - Electricity (%)
House heating fuel used in apartments - Fuel oil, kerosene, etc. (%)
House heating fuel used in apartments - Coal or coke (%)
House heating fuel used in apartments - Wood (%)
House heating fuel used in apartments - Solar energy (%)
House heating fuel used in apartments - Other fuel (%)
House heating fuel used in apartments - No fuel used (%)
Armed forces status - In Armed Forces (%)
Armed forces status - Civilian (%)
Armed forces status - Civilian - Veteran (%)
Armed forces status - Civilian - Nonveteran (%)
Fatal accidents locations in years 2005-2021
Fatal accidents locations in 2005
Fatal accidents locations in 2006
Fatal accidents locations in 2007
Fatal accidents locations in 2008
Fatal accidents locations in 2009
Fatal accidents locations in 2010
Fatal accidents locations in 2011
Fatal accidents locations in 2012
Fatal accidents locations in 2013
Fatal accidents locations in 2014
Fatal accidents locations in 2015
Fatal accidents locations in 2016
Fatal accidents locations in 2017
Fatal accidents locations in 2018
Fatal accidents locations in 2019
Fatal accidents locations in 2020
Fatal accidents locations in 2021
Alcohol use - People drinking some alcohol every month (%)
Alcohol use - People not drinking at all (%)
Alcohol use - Average days/month drinking alcohol
Alcohol use - Average drinks/week
Alcohol use - Average days/year people drink much
Audiometry - Average condition of hearing (%)
Audiometry - People that can hear a whisper from across a quiet room (%)
Audiometry - People that can hear normal voice from across a quiet room (%)
Audiometry - Ears ringing, roaring, buzzing (%)
Audiometry - Had a job exposure to loud noise (%)
Audiometry - Had off-work exposure to loud noise (%)
Blood Pressure & Cholesterol - Has high blood pressure (%)
Blood Pressure & Cholesterol - Checking blood pressure at home (%)
Blood Pressure & Cholesterol - Frequently checking blood cholesterol (%)
Blood Pressure & Cholesterol - Has high cholesterol level (%)
Consumer Behavior - Money monthly spent on food at supermarket/grocery store
Consumer Behavior - Money monthly spent on food at other stores
Consumer Behavior - Money monthly spent on eating out
Consumer Behavior - Money monthly spent on carryout/delivered foods
Consumer Behavior - Income spent on food at supermarket/grocery store (%)
Consumer Behavior - Income spent on food at other stores (%)
Consumer Behavior - Income spent on eating out (%)
Consumer Behavior - Income spent on carryout/delivered foods (%)
Current Health Status - General health condition (%)
Current Health Status - Blood donors (%)
Current Health Status - Has blood ever tested for HIV virus (%)
Current Health Status - Left-handed people (%)
Dermatology - People using sunscreen (%)
Diabetes - Diabetics (%)
Diabetes - Had a blood test for high blood sugar (%)
Diabetes - People taking insulin (%)
Diet Behavior & Nutrition - Diet health (%)
Diet Behavior & Nutrition - Milk product consumption (# of products/month)
Diet Behavior & Nutrition - Meals not home prepared (#/week)
Diet Behavior & Nutrition - Meals from fast food or pizza place (#/week)
Diet Behavior & Nutrition - Ready-to-eat foods (#/month)
Diet Behavior & Nutrition - Frozen meals/pizza (#/month)
Drug Use - People that ever used marijuana or hashish (%)
Drug Use - Ever used hard drugs (%)
Drug Use - Ever used any form of cocaine (%)
Drug Use - Ever used heroin (%)
Drug Use - Ever used methamphetamine (%)
Health Insurance - People covered by health insurance (%)
Kidney Conditions-Urology - Avg. # of times urinating at night
Medical Conditions - People with asthma (%)
Medical Conditions - People with anemia (%)
Medical Conditions - People with psoriasis (%)
Medical Conditions - People with overweight (%)
Medical Conditions - Elderly people having difficulties in thinking or remembering (%)
Medical Conditions - People who ever received blood transfusion (%)
Medical Conditions - People having trouble seeing even with glass/contacts (%)
Medical Conditions - People with arthritis (%)
Medical Conditions - People with gout (%)
Medical Conditions - People with congestive heart failure (%)
Medical Conditions - People with coronary heart disease (%)
Medical Conditions - People with angina pectoris (%)
Medical Conditions - People who ever had heart attack (%)
Medical Conditions - People who ever had stroke (%)
Medical Conditions - People with emphysema (%)
Medical Conditions - People with thyroid problem (%)
Medical Conditions - People with chronic bronchitis (%)
Medical Conditions - People with any liver condition (%)
Medical Conditions - People who ever had cancer or malignancy (%)
Mental Health - People who have little interest in doing things (%)
Mental Health - People feeling down, depressed, or hopeless (%)
Mental Health - People who have trouble sleeping or sleeping too much (%)
Mental Health - People feeling tired or having little energy (%)
Mental Health - People with poor appetite or overeating (%)
Mental Health - People feeling bad about themself (%)
Mental Health - People who have trouble concentrating on things (%)
Mental Health - People moving or speaking slowly or too fast (%)
Mental Health - People having thoughts they would be better off dead (%)
Oral Health - Average years since last visit a dentist
Oral Health - People embarrassed because of mouth (%)
Oral Health - People with gum disease (%)
Oral Health - General health of teeth and gums (%)
Oral Health - Average days a week using dental floss/device
Oral Health - Average days a week using mouthwash for dental problem
Oral Health - Average number of teeth
Pesticide Use - Households using pesticides to control insects (%)
Pesticide Use - Households using pesticides to kill weeds (%)
Physical Activity - People doing vigorous-intensity work activities (%)
Physical Activity - People doing moderate-intensity work activities (%)
Physical Activity - People walking or bicycling (%)
Physical Activity - People doing vigorous-intensity recreational activities (%)
Physical Activity - People doing moderate-intensity recreational activities (%)
Physical Activity - Average hours a day doing sedentary activities
Physical Activity - Average hours a day watching TV or videos
Physical Activity - Average hours a day using computer
Physical Functioning - People having limitations keeping them from working (%)
Physical Functioning - People limited in amount of work they can do (%)
Physical Functioning - People that need special equipment to walk (%)
Physical Functioning - People experiencing confusion/memory problems (%)
Physical Functioning - People requiring special healthcare equipment (%)
Prescription Medications - Average number of prescription medicines taking
Preventive Aspirin Use - Adults 40+ taking low-dose aspirin (%)
Reproductive Health - Vaginal deliveries (%)
Reproductive Health - Cesarean deliveries (%)
Reproductive Health - Deliveries resulted in a live birth (%)
Reproductive Health - Pregnancies resulted in a delivery (%)
Reproductive Health - Women breastfeeding newborns (%)
Reproductive Health - Women that had a hysterectomy (%)
Reproductive Health - Women that had both ovaries removed (%)
Reproductive Health - Women that have ever taken birth control pills (%)
Reproductive Health - Women taking birth control pills (%)
Reproductive Health - Women that have ever used Depo-Provera or injectables (%)
Reproductive Health - Women that have ever used female hormones (%)
Sexual Behavior - People 18+ that ever had sex (vaginal, anal, or oral) (%)
Sexual Behavior - Males 18+ that ever had vaginal sex with a woman (%)
Sexual Behavior - Males 18+ that ever performed oral sex on a woman (%)
Sexual Behavior - Males 18+ that ever had anal sex with a woman (%)
Sexual Behavior - Males 18+ that ever had any sex with a man (%)
Sexual Behavior - Females 18+ that ever had vaginal sex with a man (%)
Sexual Behavior - Females 18+ that ever performed oral sex on a man (%)
Sexual Behavior - Females 18+ that ever had anal sex with a man (%)
Sexual Behavior - Females 18+ that ever had any kind of sex with a woman (%)
Sexual Behavior - Average age people first had sex
Sexual Behavior - Average number of female sex partners in lifetime (males 18+)
Sexual Behavior - Average number of female vaginal sex partners in lifetime (males 18+)
Sexual Behavior - Average age people first performed oral sex on a woman (18+)
Sexual Behavior - Average number of woman performed oral sex on in lifetime (18+)
Sexual Behavior - Average number of male sex partners in lifetime (males 18+)
Sexual Behavior - Average number of male anal sex partners in lifetime (males 18+)
Sexual Behavior - Average age people first performed oral sex on a man (18+)
Sexual Behavior - Average number of male oral sex partners in lifetime (18+)
Sexual Behavior - People using protection when performing oral sex (%)
Sexual Behavior - Average number of times people have vaginal or anal sex a year
Sexual Behavior - People having sex without condom (%)
Sexual Behavior - Average number of male sex partners in lifetime (females 18+)
Sexual Behavior - Average number of male vaginal sex partners in lifetime (females 18+)
Sexual Behavior - Average number of female sex partners in lifetime (females 18+)
Sexual Behavior - Circumcised males 18+ (%)
Sleep Disorders - Average hours sleeping at night
Sleep Disorders - People that has trouble sleeping (%)
Smoking-Cigarette Use - People smoking cigarettes (%)
Taste & Smell - People 40+ having problems with smell (%)
Taste & Smell - People 40+ having problems with taste (%)
Taste & Smell - People 40+ that ever had wisdom teeth removed (%)
Taste & Smell - People 40+ that ever had tonsils teeth removed (%)
Taste & Smell - People 40+ that ever had a loss of consciousness because of a head injury (%)
Taste & Smell - People 40+ that ever had a broken nose or other serious injury to face or skull (%)
Taste & Smell - People 40+ that ever had two or more sinus infections (%)
Weight - Average height (inches)
Weight - Average weight (pounds)
Weight - Average BMI
Weight - People that are obese (%)
Weight - People that ever were obese (%)
Weight - People trying to lose weight (%)
Officers per 1,000 residents here:
1.81Michigan average:
1.86
Latest news from Zeeland, MI collected exclusively by city-data.com from local newspapers, TV, and radio stations
Ancestries: Dutch (57.4%), German (8.5%), American (4.4%), Swedish (2.8%), European (1.6%), English (1.0%).
Current Local Time:
Land area: 3.01 square miles.
Population density: 1,883 people per square mile (low).
69 residents are foreign born
This city:
1.2%Michigan:
6.9%
Median real estate property taxes paid for housing units with mortgages in 2022: $2,929 (1.1%)Median real estate property taxes paid for housing units with no mortgage in 2022: $2,639 (1.0%)
Nearest city with pop. 50,000+: Wyoming, MI
Nearest city with pop. 200,000+: Milwaukee, WI
Nearest city with pop. 1,000,000+: Chicago, IL
Nearest cities:
Latitude: 42.81 N, Longitude: 86.02 W
Daytime population change due to commuting: +9,572 (+165.3%)Workers who live and work in this city: 609 (20.0%)
Single-family new house construction building permits:
2022: 2 buildings , average cost: $262,5002020: 8 buildings , average cost: $174,1002019: 6 buildings , average cost: $136,8002018: 3 buildings , average cost: $136,7002017: 7 buildings , average cost: $150,0002012: 2 buildings , average cost: $144,0002010: 2 buildings , average cost: $160,0002009: 1 building , cost: $200,0002008: 1 building , cost: $120,0002006: 3 buildings , average cost: $101,7002004: 11 buildings , average cost: $162,7002001: 5 buildings , average cost: $114,2002000: 6 buildings , average cost: $94,7001999: 7 buildings , average cost: $138,9001998: 7 buildings , average cost: $110,1001997: 12 buildings , average cost: $111,900Unemployment in December 2023:
Population change in the 1990s: +348 (+6.4%).
Most common occupations in Zeeland, MI (%)
Both Males Females
Other production occupations, including supervisors (9.4%)
Sales representatives, services, wholesale and manufacturing (4.1%)
Preschool, kindergarten, elementary, and middle school teachers (4.1%)
Assemblers and fabricators (3.9%)
Metal workers and plastic workers (3.6%)
Other office and administrative support workers, including supervisors (3.5%)
Secretaries and administrative assistants (3.5%)
Other production occupations, including supervisors (15.0%)
Metal workers and plastic workers (5.6%)
Electrical equipment mechanics and other installation, maintenance, and repair workers, including supervisors (5.2%)
Driver/sales workers and truck drivers (5.1%)
Sales representatives, services, wholesale and manufacturing (4.7%)
Preschool, kindergarten, elementary, and middle school teachers (3.5%)
Material recording, scheduling, dispatching, and distributing workers (3.4%)
Secretaries and administrative assistants (6.9%)
Other office and administrative support workers, including supervisors (5.3%)
Assemblers and fabricators (5.3%)
Retail sales workers, except cashiers (4.9%)
Preschool, kindergarten, elementary, and middle school teachers (4.6%)
Nursing, psychiatric, and home health aides (4.6%)
Child care workers (4.3%)
Tornado activity:
Zeeland-area historical tornado activity is near Michigan state average. It is 7% smaller than the overall U.S. average.
On 4/3/1956, a category F5 (max. wind speeds 261-318 mph) tornado 14.2 miles away from the Zeeland city center killed 18 people and injured 340 people and caused between $50,000 and $500,000 in damages.
On 4/11/1965, a category F4 (max. wind speeds 207-260 mph) tornado 15.3 miles away from the city center killed 5 people and injured 142 people and caused between $500,000 and $5,000,000 in damages.
Earthquake activity:
Zeeland-area historical earthquake activity is significantly above Michigan state average. It is 19% smaller than the overall U.S. average. On 5/2/2015 at 16:23:07, a magnitude 4.2 (4.2 MW, Depth: 2.8 mi, Class: Light, Intensity: IV - V) earthquake occurred 49.9 miles away from Zeeland center On 4/18/2008 at 09:36:59, a magnitude 5.4 (5.1 MB, 4.8 MS, 5.4 MW, 5.2 MW, Class: Moderate, Intensity: VI - VII) earthquake occurred 317.0 miles away from Zeeland center On 1/31/1986 at 16:46:43, a magnitude 5.0 (5.0 MB) earthquake occurred 262.5 miles away from the city center On 9/25/1998 at 19:52:52, a magnitude 5.2 (4.8 MB, 4.3 MS, 5.2 LG, 4.5 MW, Depth: 3.1 mi) earthquake occurred 302.3 miles away from the city center On 7/12/1986 at 08:19:37, a magnitude 4.5 (4.5 MB) earthquake occurred 178.8 miles away from Zeeland center On 6/10/1987 at 23:48:54, a magnitude 5.1 (4.9 MB, 4.4 MS, 4.6 MS, 5.1 LG) earthquake occurred 292.8 miles away from the city center Magnitude types: regional Lg-wave magnitude (LG), body-wave magnitude (MB), surface-wave magnitude (MS), moment magnitude (MW) Natural disasters: The number of natural disasters in Ottawa County (15) is near the US average (15).Major Disasters (Presidential) Declared: 9Emergencies Declared: 5Storms: 8, Floods: 7, Tornadoes: 4, Snowstorms: 2, Winds: 2, Winter Storms: 2, Blizzard: 1, Hurricane: 1, Other: 1 (Note: some incidents may be assigned to more than one category). Main business address for: MILLER HERMAN INC OFFICE FURNITURE ), GENTEX CORP MOTOR VEHICLE PARTS & ACCESSORIES ).
Hospitals and medical centers in Zeeland: SPECTRUM HEALTH ZEELAND COMMUNITY HOSPITAL (Voluntary non-profit - Private, 8333 FELCH ST) HERITAGE NURSING AND REHABILITATION COMMUNITY (320 E CENTRAL AVE)
PROVIDENCE CHRISTIAN HEALTHCARE AND REHAB CTR (285 N STATE ST)
RAI ROYAL PARK - ZEELAND (2 ROYAL PARK DR)
Amtrak stations near Zeeland: 5 miles: HOLLAND (171 LINCOLN AVE.) Services: enclosed waiting area, public payphones, vending machines, free short-term parking, free long-term parking, call for taxi service, intercity bus service.
20 miles: GRAND RAPIDS (MARKET & WEALTHY STS.) Services: enclosed waiting area, public restrooms, public payphones, free short-term parking, free long-term parking, call for taxi service, public transit connection.
Colleges/universities with over 2000 students nearest to Zeeland:
Hope College (about 5 miles; Holland, MI ; Full-time enrollment: 3,535)
Grand Valley State University (about 13 miles; Allendale, MI ; FT enrollment: 21,982)
Grand Rapids Community College (about 21 miles; Grand Rapids, MI ; FT enrollment: 11,296)
Calvin College (about 24 miles; Grand Rapids, MI ; FT enrollment: 4,117)
Cornerstone University (about 25 miles; Grand Rapids, MI ; FT enrollment: 2,573)
Davenport University (about 25 miles; Grand Rapids, MI ; FT enrollment: 6,955)
Baker College of Muskegon (about 32 miles; Muskegon, MI ; FT enrollment: 3,293)
Public high schools in Zeeland: ZEELAND EAST HIGH SCHOOL Students: 958, Location: 3333 96TH AVE, Grades: 9-12)ZEELAND WEST HIGH SCHOOL Students: 774, Location: 3390 100TH AVE, Grades: 9-12)INNOCADEMY Location: 8485 HOMESTEAD DR, Grades: KG-12, Charter school )
ICADEMY GLOBAL Location: 8485 HOMESTEAD DR, Grades: KG-12, Charter school )
VENTURE ACADEMY Location: 3333 96TH AVE, Grades: 9-12)
Public elementary/middle schools in Zeeland: CITYSIDE MIDDLE SCHOOL Students: 754, Location: 320 EAST MAIN AVE, Grades: 6-8)QUINCY ELEMENTARY SCHOOL Students: 522, Location: 10155 QUINCY ST, Grades: PK-5)WOODBRIDGE ELEMENTARY SCHOOL Students: 412, Location: 9110 WOODBRIDGE ST, Grades: KG-5)CREEKSIDE MIDDLE SCHOOL Students: 408, Location: 179 WEST ROOSEVELT AVE, Grades: 6-8)NEW GRONINGEN SCHOOL Students: 394, Location: 10542 CHICAGO DR, Grades: KG-5)ROOSEVELT ELEMENTARY SCHOOL Students: 363, Location: 175 WEST ROOSEVELT AVE, Grades: PK-5)LINCOLN ELEMENTARY SCHOOL Location: 60 EAST LINCOLN AVE, Grades: PK-5)
ZEELAND QUEST Location: 175 W ROOSEVELT AVE, Grades: KG-8)
ADAMS ELEMENTARY SCHOOL Location: 7447 ADAMS ST, Grades: KG-5)
Private elementary/middle schools in Zeeland: ZEELAND CHRISTIAN SCHOOL Students: 935, Location: 334 W CENTRAL AVE, Grades: PK-8)
BORCULO CHRISTIAN SCHOOL Students: 135, Location: 6830 96TH AVE, Grades: PK-8)
See full list of schools located in Zeeland Library in Zeeland: HOWARD MILLER LIBRARY Operating income: $642,929; Location: 14 SOUTH CHURCH STREET; 71,485 books ; 3,731 audio materials ; 2,272 video materials ; 1 local licensed databases ; 175 print serial subscriptions )
Notable locations in Zeeland: (A) , Zeeland Fire Department (B) , Zeeland Historical Museum (C) , Howard Miller Public Library (D) , Zeeland City Hall (E) . Display/hide their locations on the map
Main business address in Zeeland include: (A) , GENTEX CORP (B) . Display/hide their locations on the map
Churches in Zeeland include: (A) , North Street Christian Church (B) , Third Christian Reformed Church (C) , Second Reformed Church (D) , First Reformed Church (E) , First Baptist Church (F) , Faith Reformed Church (G) , Haven Christian Reformed Church (H) , Bethel Christian Reformed Church (I) . Display/hide their locations on the map
Cemetery: (1) . Display/hide its location on the map
Parks in Zeeland include: (1) , Zeeland Cemetery Historical Marker (2) , Hoagland Park (3) , Lawrence Park (4) , Huizenga Park (5) . Display/hide their locations on the map
Tourist attractions:
Birthplace of: Jim Kaat - Baseball player and coach, Bill Huizenga - Politician, Chris Kapenga - Politician, Dan Redder - College basketball player (Eastern Michigan Eagles), Eugene van Tamelen - Chemist, Ron Essink - Football player, Ron Schipper - Football coaches, Tyson DeVree - College football player (Colorado Buffaloes).
Ottawa County has a predicted average indoor radon screening level less than 2 pCi/L (pico curies per liter) - Low Potential Drinking water stations with addresses in Zeeland and their reported violations in the past:
THE PHEASANT GOLF COURSE (Population served: 100, Groundwater):
Past health violations:
MCL, Monthly (TCR) - In SEP-2008, Contaminant: Coliform. Follow-up actions: St Violation/Reminder Notice (OCT-15-2008), St Unresolved (JAN-08-2009), St Compliance achieved (MAY-19-2009)
Past monitoring violations:
One routine major monitoring violation
Population served: 50, Groundwater):
Past monitoring violations:
One routine major monitoring violation
Population served: 30, Groundwater):
Past monitoring violations:
3 routine major monitoring violations
One regular monitoring violation
Drinking water stations with addresses in Zeeland that have no violations reported:
PARADISE COVE CONDOMINIUM RESORT/WEST WELL (Population served: 150, Primary Water Source Type: Groundwater)
PARADISE COVE CONDOMINIUM RESORT - EAST WELL (Population served: 150, Primary Water Source Type: Groundwater)
SCALLEY LAKE PARK (Population served: 50, Primary Water Source Type: Groundwater)
NORTH POLE ICE CREAM SHOPPE (Population served: 30, Primary Water Source Type: Groundwater)
Average household size: This city:
2.4 peopleMichigan:
2.5 people
Percentage of family households: This city:
63.5%Whole state:
66.0%
Percentage of households with unmarried partners: This city:
3.4%Whole state:
6.4%
Likely homosexual households (counted as self-reported same-sex unmarried-partner households)
Lesbian couples: 0.2% of all households Gay men: 0.1% of all households
180 people in nursing facilities/skilled-nursing facilities in 2010people in group homes intended for adults in 2010people in nursing homes in 2000people in homes for the mentally retarded in 2000
Banks with branches in Zeeland (2011 data):
The Huntington National Bank: 7 branches. Info updated 2012/04/02: Bank assets: $54,183.4 mil, Deposits: $44,300.3 mil, headquarters in Columbus, OH, positive income , Commercial Lending Specialization, 878 total offices , Holding Company: Huntington Bancshares Incorporated
Macatawa Bank: 815 East Main Street Branch, Royal Park Place Branch, Zeeland State Street Branch. Info updated 2011/07/20: Bank assets: $1,506.0 mil, Deposits: $1,225.8 mil, headquarters in Holland, MI, positive income , Commercial Lending Specialization, 30 total offices , Holding Company: Macatawa Bank Corporation
Chemical Bank: Zeeland Branch at 9581 Riley, branch established on 1998/03/16; Zeeland Branch at 501 West Main Street, branch established on 1976/11/17. Info updated 2010/07/30: Bank assets: $5,331.9 mil, Deposits: $4,367.1 mil, headquarters in Midland, MI, positive income , Commercial Lending Specialization, 146 total offices , Holding Company: Chemical Financial Corporation
Fifth Third Bank: Zeeland West Branch at 523 West Main St., branch established on 1934/01/01. Info updated 2009/10/05: Bank assets: $114,540.4 mil, Deposits: $89,689.1 mil, headquarters in Cincinnati, OH, positive income , Commercial Lending Specialization, 1378 total offices , Holding Company: Fifth Third Bancorp
West Michigan Community Bank: Zeeland Branch at 59 West Washington Street, Unit K, branch established on 2012/02/20. Info updated 2011/07/12: Bank assets: $119.3 mil, Deposits: $103.3 mil, headquarters in Hudsonville, MI, negative income in the last year , Commercial Lending Specialization, 6 total offices
PNC Bank, National Association: Zeeland Branch at 250 South State Street, branch established on 1994/05/19. Info updated 2012/03/20: Bank assets: $263,309.6 mil, Deposits: $197,343.0 mil, headquarters in Wilmington, DE, positive income , Commercial Lending Specialization, 3085 total offices , Holding Company: Pnc Financial Services Group, Inc., The
For population 15 years and over in Zeeland:
Never married: 24.5%Now married: 45.8%Separated: 0.0%Widowed: 9.4%Divorced: 20.4% For population 25 years and over in Zeeland:
High school or higher: 93.9%Bachelor's degree or higher: 27.5%Graduate or professional degree: 11.1%Unemployed: 1.3%Mean travel time to work (commute): 14.7 minutes
Education Gini index (Inequality in education) Here:
11.0Michigan average:
11.0
Religion statistics for Zeeland, MI (based on Ottawa County data)
Religion Adherents Congregations Evangelical Protestant 71,034 194 Mainline Protestant 41,597 64 Catholic 24,710 11 Other 1,845 12 None 124,615 -
Source: Clifford Grammich, Kirk Hadaway, Richard Houseal, Dale E.Jones, Alexei Krindatch, Richie Stanley and Richard H.Taylor. 2012. 2010 U.S.Religion Census: Religious Congregations & Membership Study. Association of Statisticians of American Religious Bodies. Jones, Dale E., et al. 2002. Congregations and Membership in the United States 2000. Nashville, TN: Glenmary Research Center. Graphs represent county-level data
Food Environment Statistics: Number of grocery stores : 35Ottawa County :
1.35 / 10,000 pop.Michigan :
2.34 / 10,000 pop.
Number of supercenters and club stores : 6Here :
0.23 / 10,000 pop.Michigan :
0.18 / 10,000 pop.
Number of convenience stores (no gas) : 16Here :
0.62 / 10,000 pop.State :
1.52 / 10,000 pop.
Number of convenience stores (with gas) : 58Here :
2.24 / 10,000 pop.Michigan :
2.99 / 10,000 pop.
Number of full-service restaurants : 134This county :
5.18 / 10,000 pop.Michigan :
6.80 / 10,000 pop.
Adult obesity rate : Ottawa County :
26.1%State :
29.7%
Low-income preschool obesity rate : Health and Nutrition: Healthy diet rate : Zeeland:
50.3%Michigan:
50.3%
Average overall health of teeth and gums : This city:
46.4%Michigan:
47.9%
Average BMI : Zeeland:
28.9Michigan:
28.7
People feeling badly about themselves : This city:
19.0%Michigan:
20.6%
People not drinking alcohol at all : Zeeland:
12.8%Michigan:
10.4%
Average hours sleeping at night : This city:
6.9Michigan:
6.8
Overweight people : Zeeland:
34.4%Michigan:
34.1%
General health condition : Zeeland:
55.7%Michigan:
57.0%
Average condition of hearing : Zeeland:
76.6%Michigan:
79.6%
More about Health and Nutrition of Zeeland, MI Residents
Local government employment and payroll (March 2022)
Function
Full-time employees
Monthly full-time payroll
Average yearly full-time wage
Part-time employees
Monthly part-time payroll
Electric Power
21 $162,602 $92,915 2 $5,569 Police Protection - Officers
10 $63,793 $76,552 0 $0 Other Government Administration
7 $44,713 $76,651 0 $0 Financial Administration
6 $42,421 $84,842 0 $0 Streets and Highways
5 $25,562 $61,349 0 $0 Water Supply
5 $30,832 $73,997 2 $2,932 Sewerage
5 $33,631 $80,714 0 $0 Local Libraries
4 $19,492 $58,476 15 $18,759 Other and Unallocable
4 $20,090 $60,270 7 $14,958 Parks and Recreation
4 $20,582 $61,746 1 $1,170 Firefighters
1 $7,591 $91,092 29 $20,498 Police - Other
1 $4,592 $55,104 6 $11,277
Totals for Government
73 $475,900 $78,230 62 $75,163
Zeeland government finances - Expenditure in 2021 (per resident):
Construction - Regular Highways: $3,732,000 ($658.08)
Current Operations - General - Other: $27,565,000 ($4860.69)
Sewerage: $4,339,000 ($765.12)Police Protection: $1,486,000 ($262.03)Regular Highways: $1,342,000 ($236.64)Libraries: $1,112,000 ($196.09)Local Fire Protection: $961,000 ($169.46)Central Staff Services: $535,000 ($94.34)Financial Administration: $327,000 ($57.66)Parks and Recreation: $295,000 ($52.02)Protective Inspection and Regulation - Other: $269,000 ($47.43)Air Transportation: $77,000 ($13.58)Transit Utilities: $34,000 ($6.00)Judicial and Legal Services: $8,000 ($1.41)General - Interest on Debt: $77,000 ($13.58)
Intergovernmental to Local - Other - Transit Utilities: $34,000 ($6.00)
Other Capital Outlay - Parks and Recreation: $127,000 ($22.39)
Police Protection: $114,000 ($20.10)General - Other: $54,000 ($9.52)Local Fire Protection: $20,000 ($3.53)Libraries: $10,000 ($1.76)Total Salaries and Wages: $5,914,000 ($1042.85)
Water Utilities - Interest on Debt: $6,000 ($1.06)
Zeeland government finances - Revenue in 2021 (per resident):
Charges - Sewerage: $2,999,000 ($528.83)
Other: $133,000 ($23.45)Federal Intergovernmental - Other: $224,000 ($39.50)
Local Intergovernmental - Other: $426,000 ($75.12)
Miscellaneous - Interest Earnings: $4,963,000 ($875.15)
Donations From Private Sources: $285,000 ($50.26)Rents: $119,000 ($20.98)General Revenue - Other: $76,000 ($13.40)Sale of Property: $35,000 ($6.17)Fines and Forfeits: $31,000 ($5.47)Revenue - Electric Utilities: $29,847,000 ($5263.09)
Water Utilities: $5,209,000 ($918.53)State Intergovernmental - Highways: $738,000 ($130.14)
General Local Government Support: $561,000 ($98.92)Other: $186,000 ($32.80)Tax - Property: $8,056,000 ($1420.56)
Other License: $230,000 ($40.56)
Zeeland government finances - Debt in 2021 (per resident):
Long Term Debt - Beginning Outstanding - Unspecified Public Purpose: $3,380,000 ($596.01)
Outstanding Unspecified Public Purpose: $2,810,000 ($495.50)Retired Unspecified Public Purpose: $570,000 ($100.51)
Zeeland government finances - Cash and Securities in 2021 (per resident):
Other Funds - Cash and Securities: $70,859,000 ($12494.97)
Businesses in Zeeland, MI
Name Count Name Count
7-Eleven 1 Jimmy John's 1 Ace Hardware 1 MasterBrand Cabinets 9 Advance Auto Parts 1 McDonald's 1 Blockbuster 1 Pizza Hut 1 Burger King 1 Sprint Nextel 1 Curves 1 Subway 1 Decora Cabinetry 2 U-Haul 1 FedEx 1 UPS 4 H&R Block 1
Strongest AM radio stations in Zeeland:
WMFN (640 AM; 1 kW; ZEELAND, MI; Owner: BIRACH BROADCASTING CORPORATION)
WPNW (1260 AM; 10 kW; ZEELAND, MI; Owner: LANSER BROADCASTING CORPORATION)
WOOD (1300 AM; 20 kW; GRAND RAPIDS, MI; Owner: CLEAR CHANNEL BROADCASTING LICENSES, INC.)
WHTC (1450 AM; 1 kW; HOLLAND, MI; Owner: MIDWEST COMMUNICATIONS, INC.)
WGVU (1480 AM; 5 kW; KENTWOOD, MI; Owner: GRAND VALLEY STATE UNIVERSITY B OF C)
WTMJ (620 AM; 50 kW; MILWAUKEE, WI; Owner: JOURNAL BROADCAST CORPORATION)
WOAP (1080 AM; 50 kW; OWOSSO, MI)
WKZO (590 AM; 5 kW; KALAMAZOO, MI; Owner: FAIRFIELD BROADCASTING COMPANY)
WJNZ (1140 AM; daytime; 5 kW; KENTWOOD, MI; Owner: GOODRICH RADIO, LLC)
WGN (720 AM; 50 kW; CHICAGO, IL; Owner: WGN CONTINENTAL BROADCASTING CO.)
WSCR (670 AM; 50 kW; CHICAGO, IL; Owner: INFINITY BROADCASTING OPERATIONS, INC.)
WBBM (780 AM; 50 kW; CHICAGO, IL; Owner: INFINITY BROADCASTING OPERATIONS, INC.)
WMJH (810 AM; daytime; 4 kW; ROCKFORD, MI)
Strongest FM radio stations in Zeeland:
WJQK (99.3 FM; ZEELAND, MI; Owner: BEACON BC/ING CO. OF WEST MICHIGAN)
WGNB (89.3 FM; ZEELAND, MI; Owner: THE MOODY BIBLE INSTITUTE OF CHICAGO)
WKLQ (94.5 FM; HOLLAND, MI; Owner: CITADEL BROADCASTING COMPANY)
WVTI (96.1 FM; HOLLAND, MI; Owner: CLEAR CHANNEL BROADCASTING LICENSES, INC.)
WTHS (89.9 FM; HOLLAND, MI; Owner: HOPE COLLEGE)
WYVN (92.7 FM; SAUGATUCK, MI; Owner: MIDWEST COMMUNICATIONS, INC.)
WGRD-FM (97.9 FM; GRAND RAPIDS, MI; Owner: REGENT BROADCASTING OF GRAND RAPIDS, INC.)
WCSG (91.3 FM; GRAND RAPIDS, MI; Owner: CORNERSTONE UNIVERSITY.)
WZUU (92.3 FM; ALLEGAN, MI; Owner: FORUM COMMUNICATIONS, INC.)
WFUR-FM (102.9 FM; GRAND RAPIDS, MI; Owner: FURNITURE CITY BROADCASTING CORP.)
WOOD-FM (105.7 FM; GRAND RAPIDS, MI; Owner: CLEAR CHANNEL BROADCASTING LICENSES, INC.)
WBCT (93.7 FM; GRAND RAPIDS, MI; Owner: CLEAR CHANNEL BROADCASTING LICENSES, INC.)
WVGR (104.1 FM; GRAND RAPIDS, MI; Owner: REGENTS OF THE UNIVERSITY OF MICHIGAN)
WLHT-FM (95.7 FM; GRAND RAPIDS, MI; Owner: REGENT BROADCASTING OF GRAND RAPIDS, INC.)
WFGR (98.7 FM; GRAND RAPIDS, MI; Owner: REGENT BROADCASTING OF GRAND RAPIDS, INC.)
WSNX-FM (104.5 FM; MUSKEGON, MI; Owner: CLEAR CHANNEL BROADCASTING LICENSES, INC.)
WBFX (101.3 FM; GRAND RAPIDS, MI; Owner: CLEAR CHANNEL BROADCASTING LICENSES, INC.)
WGVU-FM (88.5 FM; ALLENDALE, MI; Owner: BD OF CONTROL,GRAND VALLEY ST UNIV.)
WTRV (100.5 FM; WALKER, MI; Owner: REGENT BROADCASTING OF GRAND RAPIDS, INC.)
WBLU-FM (88.9 FM; GRAND RAPIDS, MI; Owner: BLUE LAKE FINE ARTS CAMP)
TV broadcast stations around Zeeland:
WTLJ (Channel 54; MUSKEGON, MI; Owner: TCT OF MICHIGAN, INC.)
WGVU-TV (Channel 35; GRAND RAPIDS, MI; Owner: GRAND VALLEY STATE UNIVERSITY)
WWMT (Channel 3; KALAMAZOO, MI; Owner: FREEDOM BROADCASTING OF MICHIGAN, INC.)
WXMI (Channel 17; GRAND RAPIDS, MI; Owner: TRIBUNE TELEVISION HOLDINGS, INC.)
WOOD-TV (Channel 8; GRAND RAPIDS, MI; Owner: WOOD LICENSE COMPANY, LLC)
WUHQ-LP (Channel 29; GRAND RAPIDS, MI; Owner: P & P CABLE HOLDINGS, L.L.C.)
WLLA (Channel 64; KALAMAZOO, MI; Owner: CHRISTIAN FAITH BROADCAST, INC.)
WOTV (Channel 41; BATTLE CREEK, MI; Owner: WOOD LICENSE COMPANY, LLC)
WZZM-TV (Channel 13; GRAND RAPIDS, MI; Owner: COMBINED COMMUNICATIONS CORP. OF OKLAHOMA, INC.)
W44BQ (Channel 44; MOUNT PLEASANT, MI; Owner: NTN/SAGINAW, INC.)
WXSP-CA (Channel 15; GRAND RAPIDS, MI; Owner: WOOD LICENSE COMPANY, LLC)
W48CL (Channel 48; GRAND RAPIDS, MI; Owner: THREE ANGELS BROADCASTING NETWORK)
WOGC-CA (Channel 25; GRAND RAPIDS, MI; Owner: WOOD LICENSE COMPANY, LLC)
WOMS-CA (Channel 29; MUSKEGON, MI; Owner: WOOD LICENSE COMPANY, LLC)
National Bridge Inventory (NBI) Statistics 45 Number of bridges285ft / 87.3m Total length $942,000 Total costs385,755 Total average daily traffic35,688 Total average daily truck traffic
New bridges - historical statistics
1 1920-1929 3 1950-1959 2 1960-1969 30 1970-1979 2 1980-1989 2 1990-1999 2 2000-2009 3 2010-2019
See full National Bridge Inventory statistics for Zeeland, MI
Home Mortgage Disclosure Act Aggregated Statistics For Year 2009(Based on 1 partial tract) A) FHA, FSA/RHS & VA B) Conventional C) Refinancings D) Home Improvement Loans F) Non-occupant Loans on Number Average Value Number Average Value Number Average Value Number Average Value Number Average Value
LOANS ORIGINATED 22 $88,560 22 $102,508 100 $113,584 8 $41,826 4 $69,390 APPLICATIONS APPROVED, NOT ACCEPTED 3 $65,533 3 $82,753 5 $96,838 1 $3,080 1 $58,600 APPLICATIONS DENIED 3 $95,860 4 $87,315 34 $116,217 4 $29,490 4 $99,460 APPLICATIONS WITHDRAWN 5 $70,932 2 $75,170 25 $115,187 1 $6,170 0 $0 FILES CLOSED FOR INCOMPLETENESS 1 $35,470 1 $70,930 4 $104,470 0 $0 0 $0
Aggregated Statistics For Year 2008(Based on 1 partial tract) A) FHA, FSA/RHS & VA B) Conventional C) Refinancings D) Home Improvement Loans E) Loans on Dwellings For 5+ Families F) Non-occupant Loans on Number Average Value Number Average Value Number Average Value Number Average Value Number Average Value Number Average Value
LOANS ORIGINATED 15 $103,160 26 $117,637 81 $115,326 8 $31,708 1 $94,060 19 $115,894 APPLICATIONS APPROVED, NOT ACCEPTED 1 $47,030 2 $85,965 12 $93,805 2 $11,565 0 $0 1 $117,960 APPLICATIONS DENIED 2 $51,270 2 $68,235 28 $138,973 18 $29,341 0 $0 1 $7,710 APPLICATIONS WITHDRAWN 0 $0 2 $108,325 7 $109,151 2 $39,705 0 $0 1 $87,120 FILES CLOSED FOR INCOMPLETENESS 0 $0 2 $68,620 9 $149,746 1 $15,420 0 $0 2 $94,835
Aggregated Statistics For Year 2007(Based on 1 partial tract) A) FHA, FSA/RHS & VA B) Conventional C) Refinancings D) Home Improvement Loans F) Non-occupant Loans on Number Average Value Number Average Value Number Average Value Number Average Value Number Average Value
LOANS ORIGINATED 8 $117,481 76 $105,941 86 $105,017 16 $17,829 8 $103,796 APPLICATIONS APPROVED, NOT ACCEPTED 1 $96,370 6 $87,123 16 $128,034 2 $44,720 1 $100,230 APPLICATIONS DENIED 2 $38,935 6 $94,833 56 $124,090 8 $38,068 3 $113,337 APPLICATIONS WITHDRAWN 2 $103,700 11 $108,010 17 $138,099 1 $15,420 2 $58,980 FILES CLOSED FOR INCOMPLETENESS 0 $0 1 $117,960 12 $104,149 0 $0 1 $117,960
Aggregated Statistics For Year 2006(Based on 1 partial tract) A) FHA, FSA/RHS & VA B) Conventional C) Refinancings D) Home Improvement Loans F) Non-occupant Loans on G) Loans On Manufactured Number Average Value Number Average Value Number Average Value Number Average Value Number Average Value Number Average Value
LOANS ORIGINATED 3 $132,870 93 $105,486 89 $101,451 22 $22,499 13 $100,052 2 $31,995 APPLICATIONS APPROVED, NOT ACCEPTED 0 $0 8 $87,990 18 $89,008 4 $16,770 3 $127,730 0 $0 APPLICATIONS DENIED 0 $0 15 $89,076 57 $125,957 9 $67,248 5 $147,878 5 $33,616 APPLICATIONS WITHDRAWN 0 $0 9 $99,202 40 $123,688 2 $10,410 1 $85,580 0 $0 FILES CLOSED FOR INCOMPLETENESS 0 $0 2 $94,445 13 $119,505 1 $38,550 0 $0 0 $0
Aggregated Statistics For Year 2005(Based on 1 partial tract) A) FHA, FSA/RHS & VA B) Conventional C) Refinancings D) Home Improvement Loans F) Non-occupant Loans on G) Loans On Manufactured Number Average Value Number Average Value Number Average Value Number Average Value Number Average Value Number Average Value
LOANS ORIGINATED 5 $118,272 125 $103,530 109 $111,760 20 $43,870 16 $118,204 1 $3,080 APPLICATIONS APPROVED, NOT ACCEPTED 0 $0 9 $106,398 27 $109,739 4 $43,948 3 $136,723 0 $0 APPLICATIONS DENIED 0 $0 8 $104,181 71 $119,614 10 $34,078 5 $105,010 0 $0 APPLICATIONS WITHDRAWN 1 $117,960 12 $122,525 62 $115,750 3 $145,720 4 $104,085 0 $0 FILES CLOSED FOR INCOMPLETENESS 0 $0 3 $131,327 7 $106,729 0 $0 1 $127,990 0 $0
Aggregated Statistics For Year 2004(Based on 1 partial tract) A) FHA, FSA/RHS & VA B) Conventional C) Refinancings D) Home Improvement Loans F) Non-occupant Loans on G) Loans On Manufactured Number Average Value Number Average Value Number Average Value Number Average Value Number Average Value Number Average Value
LOANS ORIGINATED 11 $123,921 102 $106,663 129 $104,228 16 $36,767 19 $102,827 1 $5,400 APPLICATIONS APPROVED, NOT ACCEPTED 0 $0 5 $70,316 27 $110,396 2 $13,105 2 $94,835 1 $15,420 APPLICATIONS DENIED 2 $60,140 15 $91,235 66 $104,868 9 $29,983 2 $44,330 3 $43,947 APPLICATIONS WITHDRAWN 2 $82,495 3 $102,543 40 $113,029 0 $0 2 $79,800 0 $0 FILES CLOSED FOR INCOMPLETENESS 2 $89,820 0 $0 23 $119,069 0 $0 1 $85,580 0 $0
Aggregated Statistics For Year 2003(Based on 1 partial tract) A) FHA, FSA/RHS & VA B) Conventional C) Refinancings D) Home Improvement Loans F) Non-occupant Loans on Number Average Value Number Average Value Number Average Value Number Average Value Number Average Value
LOANS ORIGINATED 19 $113,053 84 $111,373 396 $102,257 11 $34,555 28 $99,431 APPLICATIONS APPROVED, NOT ACCEPTED 2 $122,590 7 $131,180 53 $106,573 1 $1,540 2 $102,545 APPLICATIONS DENIED 1 $48,570 14 $86,572 64 $109,169 5 $25,752 0 $0 APPLICATIONS WITHDRAWN 0 $0 2 $45,875 39 $115,927 2 $22,745 0 $0 FILES CLOSED FOR INCOMPLETENESS 1 $99,460 2 $105,625 13 $90,800 0 $0 0 $0
Aggregated Statistics For Year 2002(Based on 1 partial tract) A) FHA, FSA/RHS & VA B) Conventional C) Refinancings D) Home Improvement Loans F) Non-occupant Loans on Number Average Value Number Average Value Number Average Value Number Average Value Number Average Value
LOANS ORIGINATED 10 $112,335 96 $91,420 283 $101,527 11 $17,803 16 $98,881 APPLICATIONS APPROVED, NOT ACCEPTED 0 $0 9 $114,622 15 $83,422 2 $15,420 0 $0 APPLICATIONS DENIED 1 $75,560 11 $68,689 39 $91,136 6 $11,693 1 $18,500 APPLICATIONS WITHDRAWN 2 $83,655 7 $117,191 41 $104,405 2 $12,335 3 $127,730 FILES CLOSED FOR INCOMPLETENESS 0 $0 3 $149,830 10 $99,767 0 $0 0 $0
Aggregated Statistics For Year 2001(Based on 1 partial tract) A) FHA, FSA/RHS & VA B) Conventional C) Refinancings D) Home Improvement Loans F) Non-occupant Loans on Number Average Value Number Average Value Number Average Value Number Average Value Number Average Value
LOANS ORIGINATED 19 $112,242 72 $90,668 237 $95,611 28 $19,302 9 $97,489 APPLICATIONS APPROVED, NOT ACCEPTED 1 $75,560 2 $23,130 18 $98,088 5 $12,798 2 $66,305 APPLICATIONS DENIED 2 $122,590 12 $46,517 52 $94,314 9 $9,509 1 $38,550 APPLICATIONS WITHDRAWN 2 $66,690 2 $94,835 30 $93,342 2 $3,470 0 $0 FILES CLOSED FOR INCOMPLETENESS 0 $0 0 $0 5 $97,454 1 $10,020 0 $0
Aggregated Statistics For Year 2000(Based on 1 partial tract) A) FHA, FSA/RHS & VA B) Conventional C) Refinancings D) Home Improvement Loans F) Non-occupant Loans on Number Average Value Number Average Value Number Average Value Number Average Value Number Average Value
LOANS ORIGINATED 14 $104,195 82 $83,879 61 $89,259 25 $14,063 8 $72,666 APPLICATIONS APPROVED, NOT ACCEPTED 2 $87,125 6 $61,295 17 $62,134 5 $18,966 1 $66,310 APPLICATIONS DENIED 2 $79,800 15 $42,097 24 $63,832 7 $19,826 1 $77,100 APPLICATIONS WITHDRAWN 2 $77,485 4 $117,770 6 $52,042 1 $19,270 0 $0 FILES CLOSED FOR INCOMPLETENESS 0 $0 1 $53,970 5 $94,832 0 $0 0 $0
Aggregated Statistics For Year 1999(Based on 1 partial tract) A) FHA, FSA/RHS & VA B) Conventional C) Refinancings D) Home Improvement Loans E) Loans on Dwellings For 5+ Families F) Non-occupant Loans on Number Average Value Number Average Value Number Average Value Number Average Value Number Average Value Number Average Value
LOANS ORIGINATED 19 $103,761 86 $86,750 112 $74,372 24 $18,910 2 $525,750 8 $63,940 APPLICATIONS APPROVED, NOT ACCEPTED 1 $73,840 8 $69,131 15 $66,254 7 $16,153 0 $0 2 $36,150 APPLICATIONS DENIED 1 $70,000 27 $40,824 25 $70,859 12 $10,320 0 $0 4 $46,345 APPLICATIONS WITHDRAWN 2 $96,535 5 $71,382 14 $71,096 1 $53,840 0 $0 0 $0 FILES CLOSED FOR INCOMPLETENESS 2 $71,920 0 $0 8 $71,728 1 $20,770 0 $0 0 $0
Detailed HMDA statistics for the following Tracts:
0229.00
Private Mortgage Insurance Companies Aggregated Statistics For Year 2009(Based on 1 partial tract) A) Conventional B) Refinancings C) Non-occupant Loans on Number Average Value Number Average Value Number Average Value
LOANS ORIGINATED 2 $68,620 4 $145,720 0 $0 APPLICATIONS APPROVED, NOT ACCEPTED 2 $84,425 1 $186,580 1 $65,530 APPLICATIONS DENIED 0 $0 0 $0 0 $0 APPLICATIONS WITHDRAWN 0 $0 2 $108,325 0 $0 FILES CLOSED FOR INCOMPLETENESS 0 $0 0 $0 0 $0
Aggregated Statistics For Year 2008(Based on 1 partial tract) A) Conventional B) Refinancings C) Non-occupant Loans on Number Average Value Number Average Value Number Average Value
LOANS ORIGINATED 12 $122,525 8 $130,202 2 $71,315 APPLICATIONS APPROVED, NOT ACCEPTED 3 $91,750 6 $149,317 0 $0 APPLICATIONS DENIED 1 $62,450 1 $124,900 0 $0 APPLICATIONS WITHDRAWN 1 $96,370 0 $0 0 $0 FILES CLOSED FOR INCOMPLETENESS 0 $0 1 $90,210 0 $0
Aggregated Statistics For Year 2007(Based on 1 partial tract) A) Conventional B) Refinancings C) Non-occupant Loans on Number Average Value Number Average Value Number Average Value
LOANS ORIGINATED 26 $121,581 12 $125,288 2 $100,230 APPLICATIONS APPROVED, NOT ACCEPTED 5 $115,650 1 $109,480 0 $0 APPLICATIONS DENIED 2 $135,310 0 $0 1 $117,960 APPLICATIONS WITHDRAWN 2 $93,290 0 $0 0 $0 FILES CLOSED FOR INCOMPLETENESS 0 $0 0 $0 0 $0
Aggregated Statistics For Year 2006(Based on 1 partial tract) A) Conventional B) Refinancings C) Non-occupant Loans on Number Average Value Number Average Value Number Average Value
LOANS ORIGINATED 22 $127,705 8 $134,540 1 $60,140 APPLICATIONS APPROVED, NOT ACCEPTED 3 $152,400 1 $99,460 0 $0 APPLICATIONS DENIED 0 $0 0 $0 0 $0 APPLICATIONS WITHDRAWN 0 $0 1 $92,520 0 $0 FILES CLOSED FOR INCOMPLETENESS 0 $0 1 $122,590 0 $0
Aggregated Statistics For Year 2005(Based on 1 partial tract) A) Conventional B) Refinancings C) Non-occupant Loans on Number Average Value Number Average Value Number Average Value
LOANS ORIGINATED 22 $129,949 6 $154,457 1 $94,830 APPLICATIONS APPROVED, NOT ACCEPTED 4 $173,668 2 $165,765 0 $0 APPLICATIONS DENIED 0 $0 0 $0 0 $0 APPLICATIONS WITHDRAWN 1 $90,210 0 $0 1 $90,210 FILES CLOSED FOR INCOMPLETENESS 0 $0 0 $0 0 $0
Aggregated Statistics For Year 2004(Based on 1 partial tract) A) Conventional B) Refinancings C) Non-occupant Loans on Number Average Value Number Average Value Number Average Value
LOANS ORIGINATED 15 $135,850 9 $151,116 2 $136,850 APPLICATIONS APPROVED, NOT ACCEPTED 4 $188,510 4 $118,928 0 $0 APPLICATIONS DENIED 0 $0 0 $0 0 $0 APPLICATIONS WITHDRAWN 0 $0 1 $73,240 0 $0 FILES CLOSED FOR INCOMPLETENESS 0 $0 0 $0 0 $0
Aggregated Statistics For Year 2003(Based on 1 partial tract) A) Conventional B) Refinancings C) Non-occupant Loans on Number Average Value Number Average Value Number Average Value
LOANS ORIGINATED 22 $127,110 30 $123,617 1 $132,610 APPLICATIONS APPROVED, NOT ACCEPTED 0 $0 9 $132,012 0 $0 APPLICATIONS DENIED 1 $97,150 1 $100,230 0 $0 APPLICATIONS WITHDRAWN 0 $0 3 $132,097 0 $0 FILES CLOSED FOR INCOMPLETENESS 0 $0 0 $0 0 $0
Aggregated Statistics For Year 2002(Based on 1 partial tract) A) Conventional B) Refinancings Number Average Value Number Average Value
LOANS ORIGINATED 19 $108,630 21 $116,274 APPLICATIONS APPROVED, NOT ACCEPTED 3 $105,113 2 $124,130 APPLICATIONS DENIED 0 $0 0 $0 APPLICATIONS WITHDRAWN 0 $0 0 $0 FILES CLOSED FOR INCOMPLETENESS 0 $0 0 $0
Aggregated Statistics For Year 2001(Based on 1 partial tract) A) Conventional B) Refinancings C) Non-occupant Loans on Number Average Value Number Average Value Number Average Value
LOANS ORIGINATED 38 $105,160 30 $118,066 1 $61,680 APPLICATIONS APPROVED, NOT ACCEPTED 2 $188,510 10 $123,745 0 $0 APPLICATIONS DENIED 0 $0 0 $0 0 $0 APPLICATIONS WITHDRAWN 0 $0 0 $0 0 $0 FILES CLOSED FOR INCOMPLETENESS 1 $69,390 0 $0 0 $0
Aggregated Statistics For Year 2000(Based on 1 partial tract) A) Conventional B) Refinancings Number Average Value Number Average Value
LOANS ORIGINATED 22 $95,464 5 $123,514 APPLICATIONS APPROVED, NOT ACCEPTED 2 $58,980 0 $0 APPLICATIONS DENIED 1 $55,510 2 $140,320 APPLICATIONS WITHDRAWN 0 $0 0 $0 FILES CLOSED FOR INCOMPLETENESS 0 $0 0 $0
Aggregated Statistics For Year 1999(Based on 1 partial tract) A) Conventional B) Refinancings Number Average Value Number Average Value
LOANS ORIGINATED 48 $96,150 14 $97,359 APPLICATIONS APPROVED, NOT ACCEPTED 3 $105,893 2 $83,460 APPLICATIONS DENIED 2 $84,610 0 $0 APPLICATIONS WITHDRAWN 1 $38,460 0 $0 FILES CLOSED FOR INCOMPLETENESS 0 $0 0 $0
Detailed PMIC statistics for the following Tracts:
0229.00
Most common first names in Zeeland, MI among deceased individuals Name Count Lived (average)
John 160 77.9 years Henry 86 81.1 years Jennie 60 85.2 years Gertrude 56 83.6 years William 54 80.1 years Gerrit 53 80.7 years Anna 41 81.6 years George 39 80.2 years Henrietta 38 80.0 years James 35 71.5 years
Most common last names in Zeeland, MI among deceased individuals Last name Count Lived (average)
Vandenbosch 31 79.2 years Walters 24 73.6 years Devries 24 81.2 years Dejonge 22 80.3 years Brower 21 79.2 years Timmer 19 77.7 years Nykamp 19 74.2 years Smith 18 75.8 years Bos 17 78.0 years Vanhaitsma 16 79.7 years
Zeeland compared to Michigan state average:
Unemployed percentage significantly below state average. Black race population percentage significantly below state average. Foreign-born population percentage significantly below state average. Institutionalized population percentage above state average.
#37 on the list of "Top 101 cities with the most residents born in Netherlands (population 500+)"
#71 on the list of "Top 101 cities that people commute into (largest positive percentage daily daytime population change due to commuting) (population 5,000+)"
#72 on the list of "Top 101 cities with largest percentage of females in industries: manufacturing (population 5,000+)"
#75 on the list of "Top 101 cities with the most full-time local library workers per 1000 residents (population 5,000+)"
#90 on the list of "Top 101 cities with largest percentage of males in occupations: architecture and engineering occupations (population 5,000+)"
#25 (49464) on the list of "Top 101 zip codes with the largest percentage of Dutch first ancestries"
#48 on the list of "Top 101 counties with the lowest percentage of residents relocating from foreign countries between 2010 and 2011"
#73 on the list of "Top 101 counties with the highest Sulfur Oxides Annual air pollution readings in 2012 (µg/m3 )"
#80 on the list of "Top 101 counties with the largest number of children under 18 without health insurance coverage in 2000 (pop. 50,000+)"
#82 on the list of "Top 101 counties with the lowest ground withdrawal of fresh water for public supply (pop. 50,000+)"
#98 on the list of "Top 101 counties with the largest number of people without health insurance coverage in 2000 (pop. 50,000+)"
Top Patent Applicants
David J. Cammenga (48)
Rodney K. Blank (32)
Todd R. Witkowski (31)
John A. Vanderploeg (22)
Gary J. Dozeman (18)
Kenneth L. Schierbeek (17)
Brian T. Dobrinski (15)
Mark E. Kramer (14)
Donald L. Bareman (13)
Michiel P. Van De Ven (13)
Total of 565 patent applications in 2008-2024.
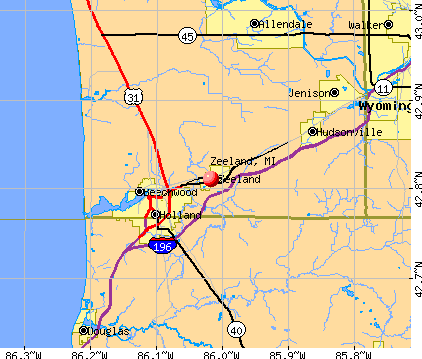


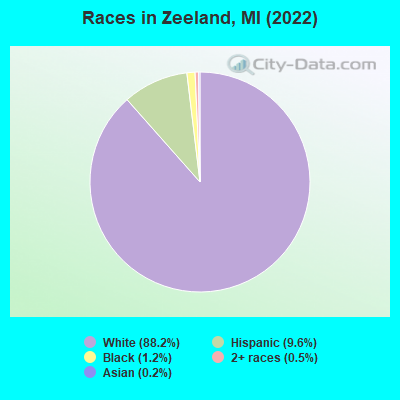
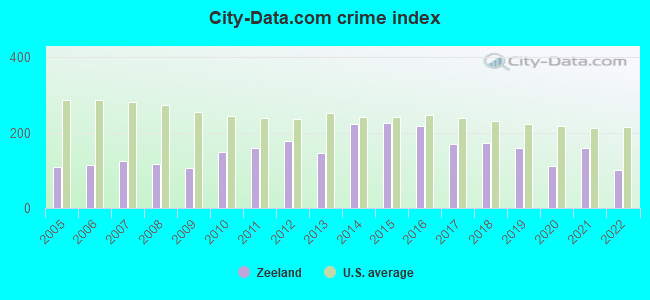
 Recent articles from our blog. Our writers, many of them Ph.D. graduates or candidates, create easy-to-read articles on a wide variety of topics.

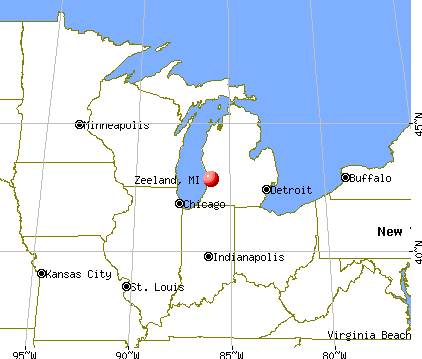
 (17.3 miles
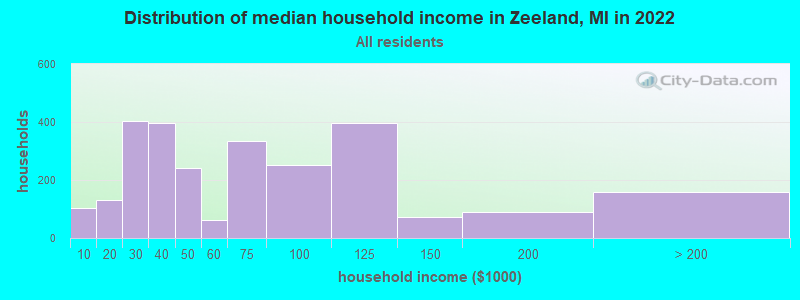
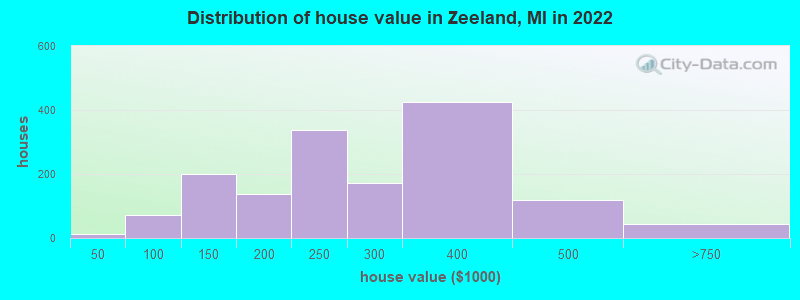
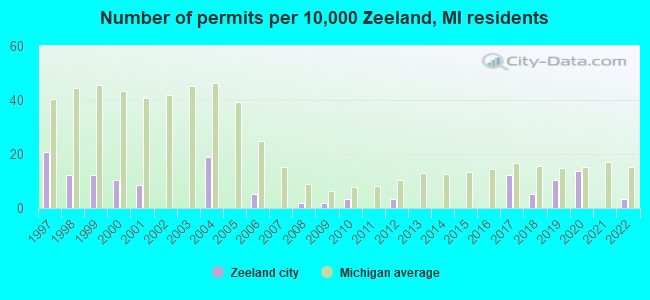
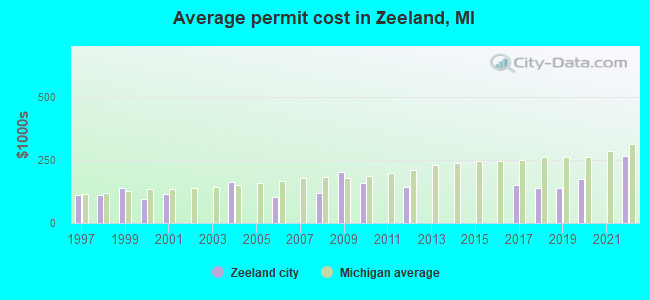
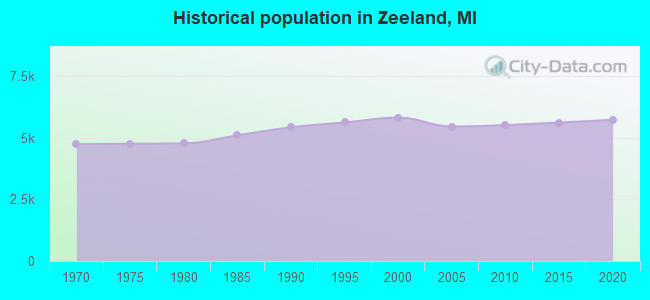
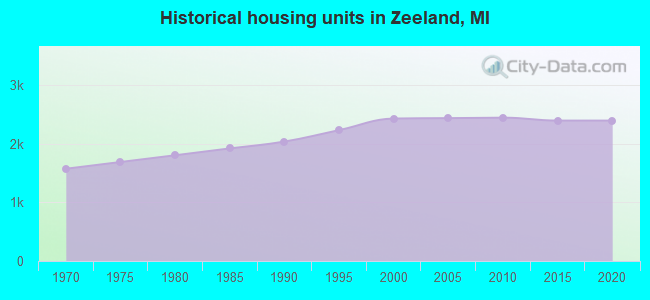
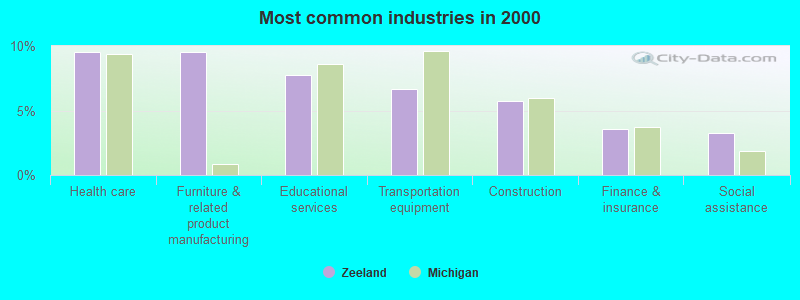
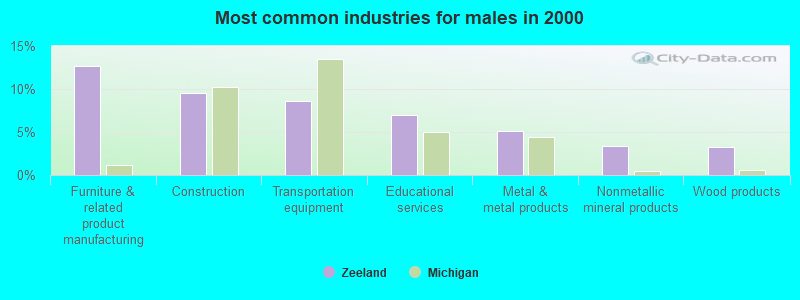
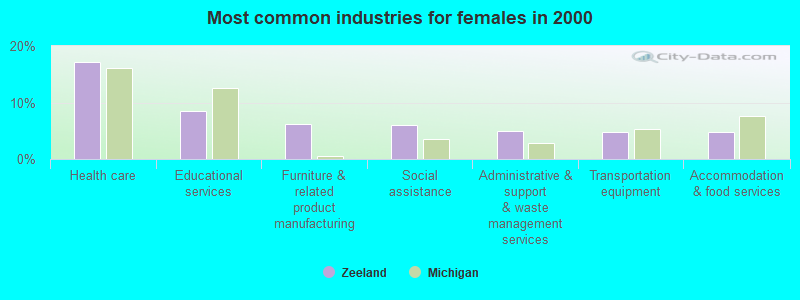
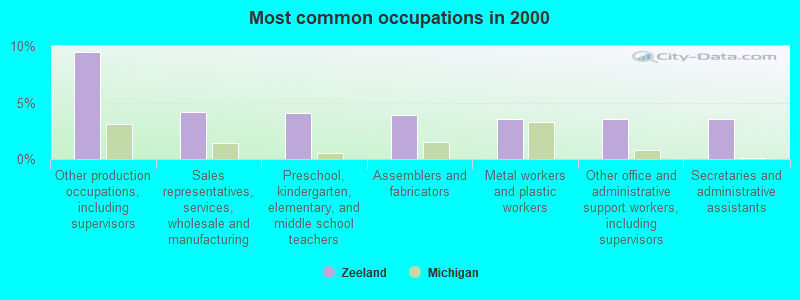
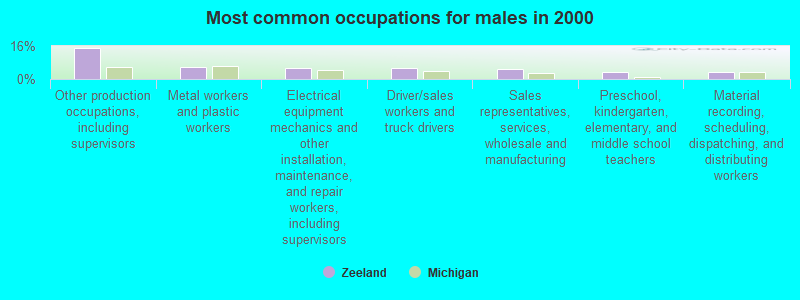
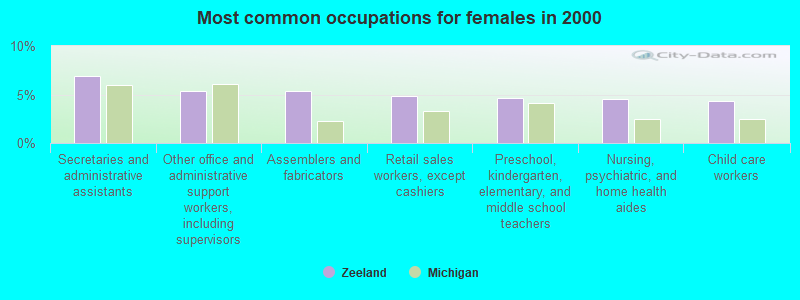
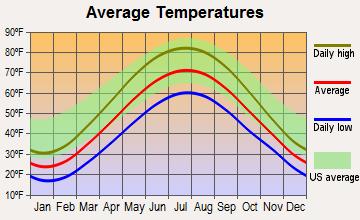
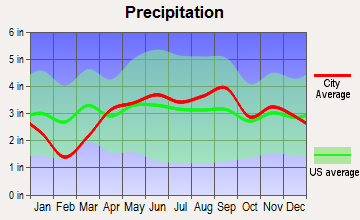
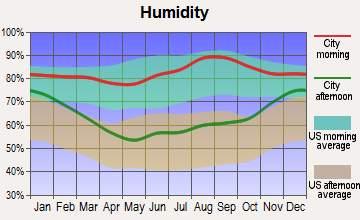
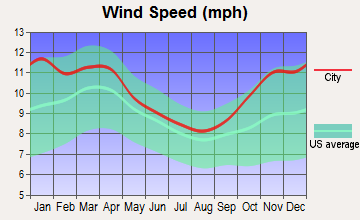
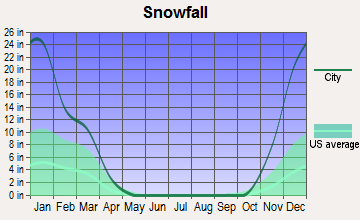
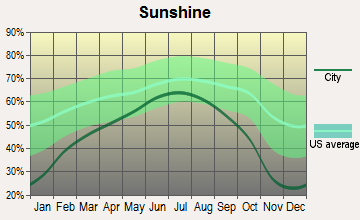
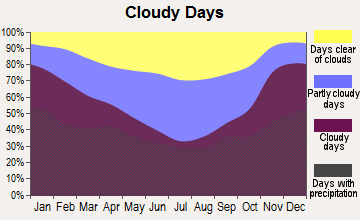
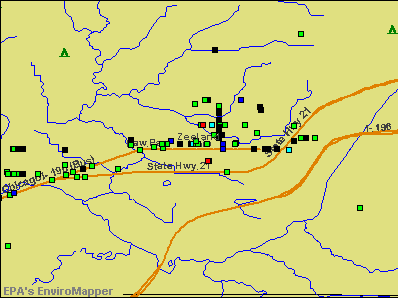

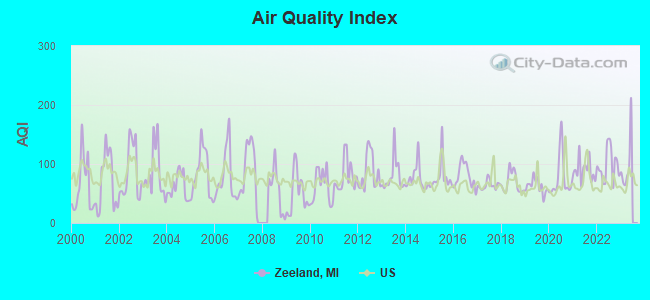
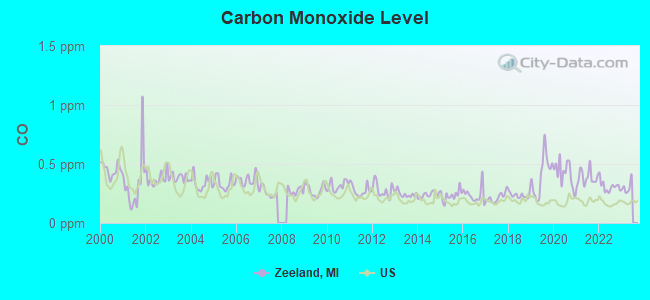
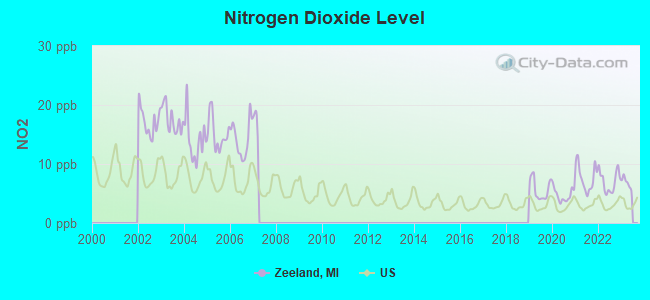
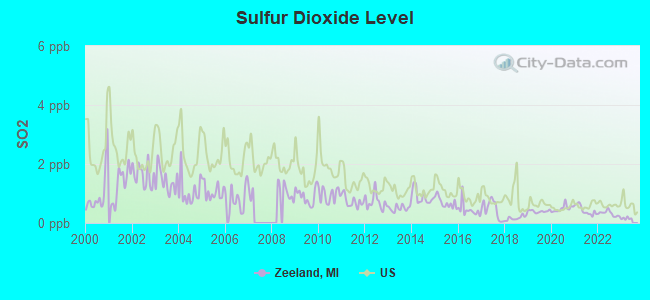
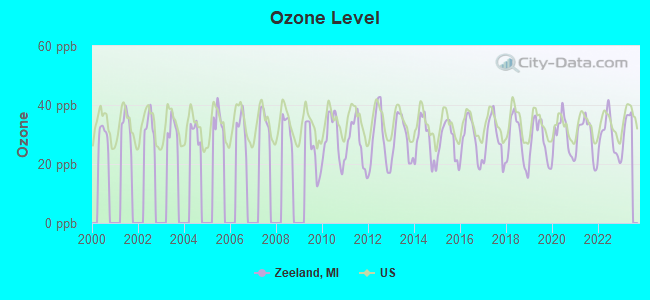
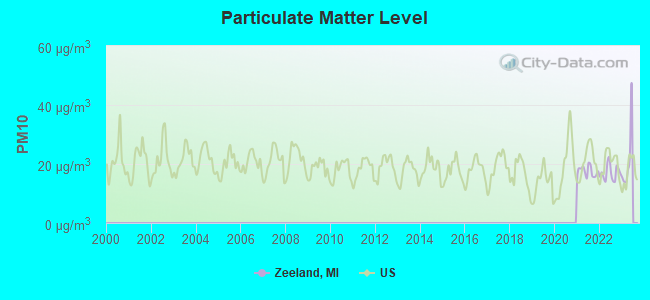
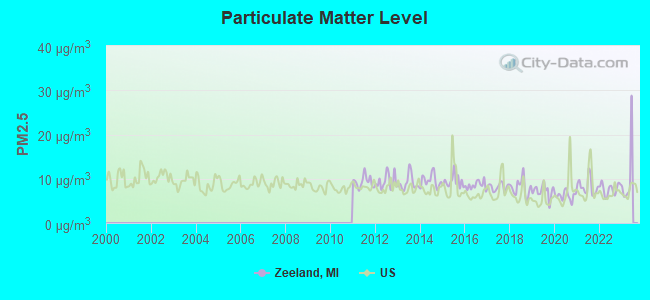
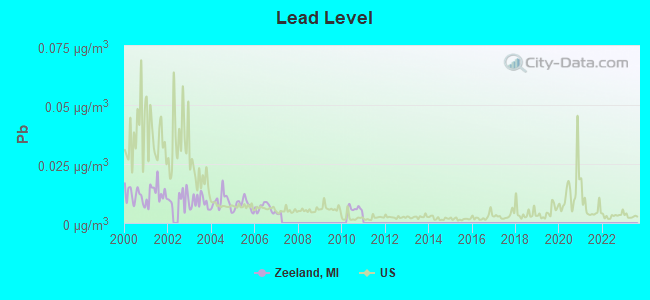
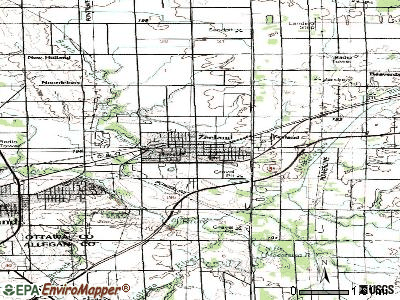
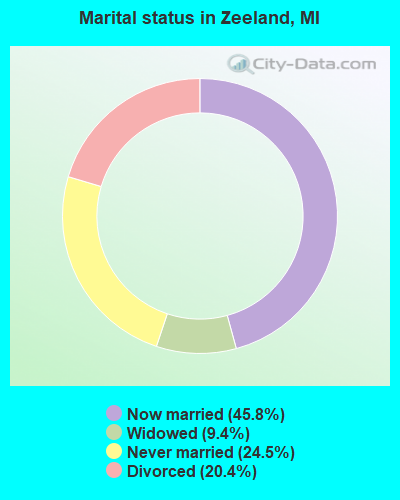
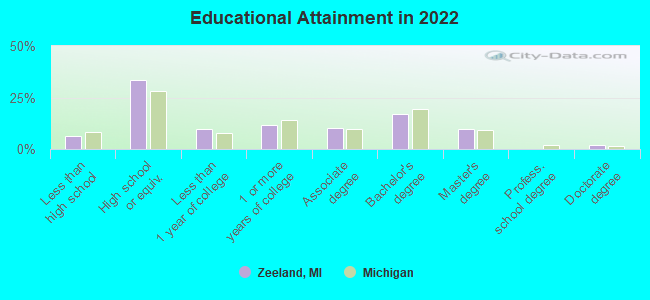
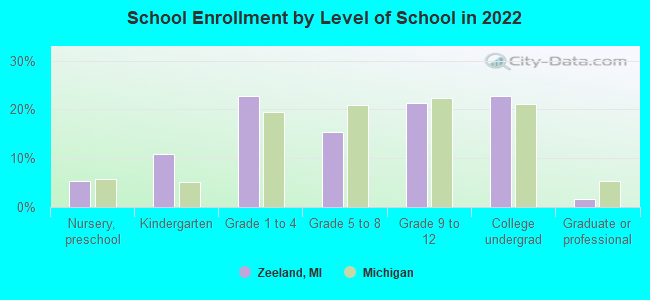
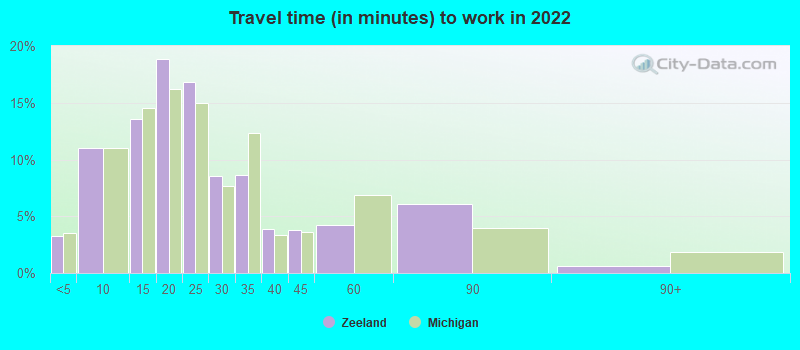
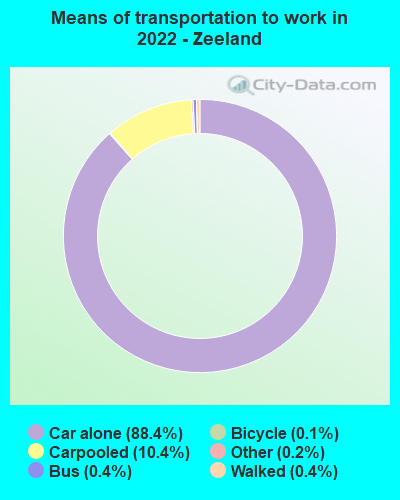
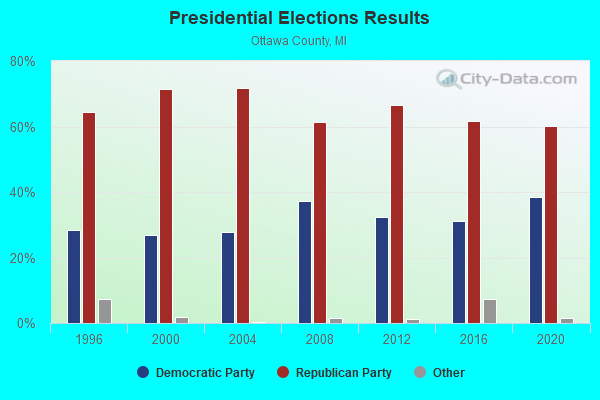
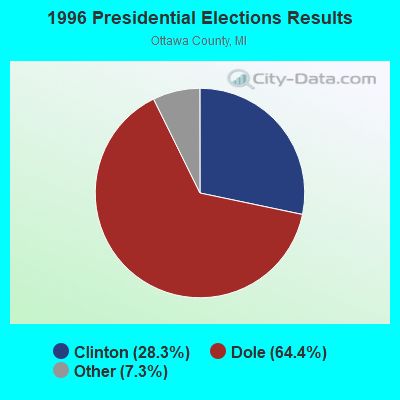

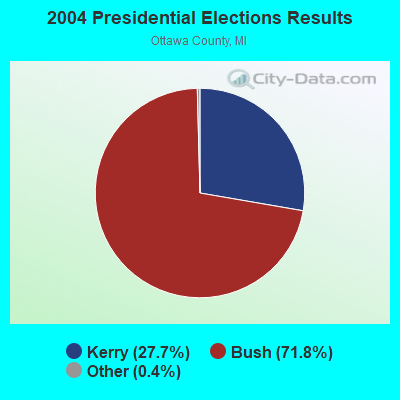
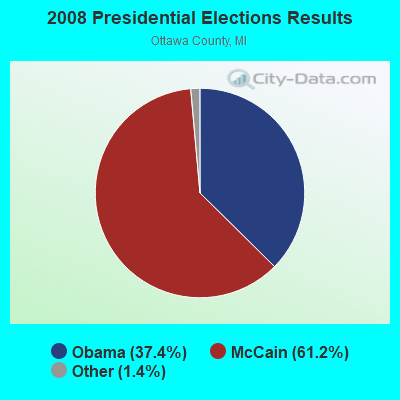
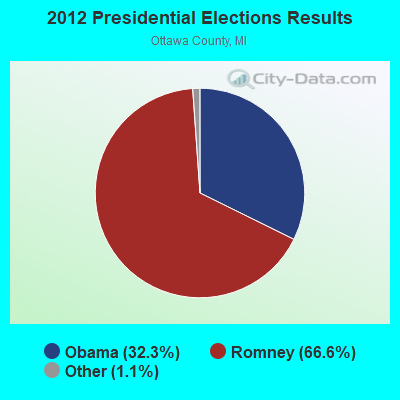
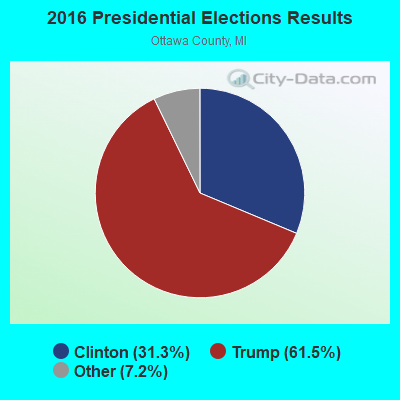

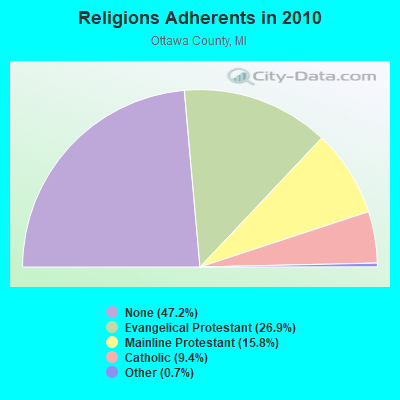
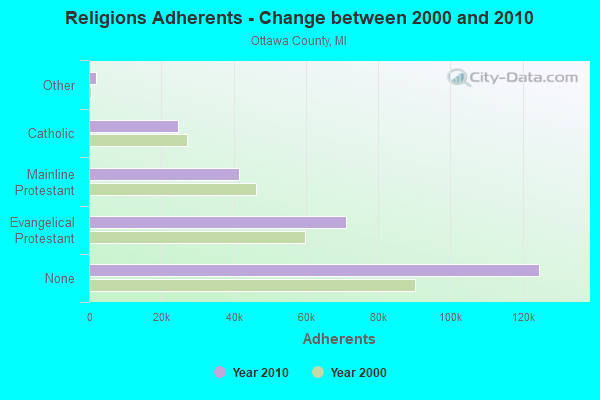
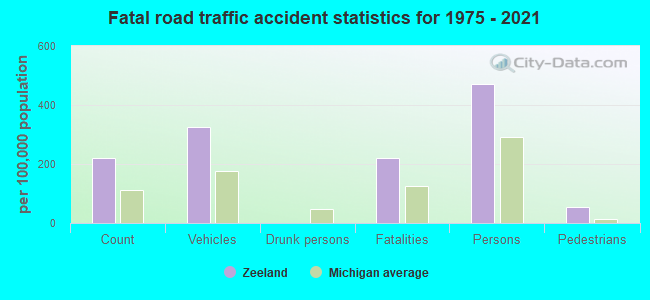
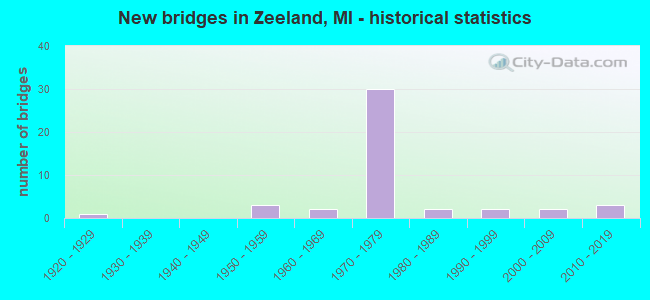
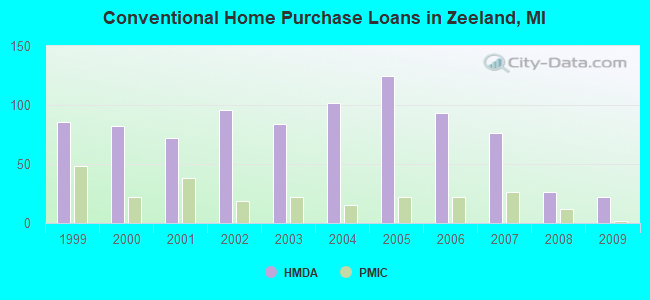
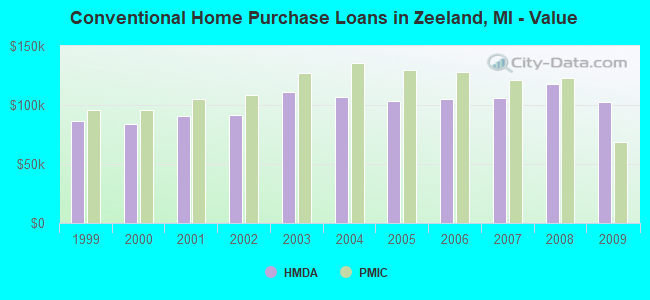
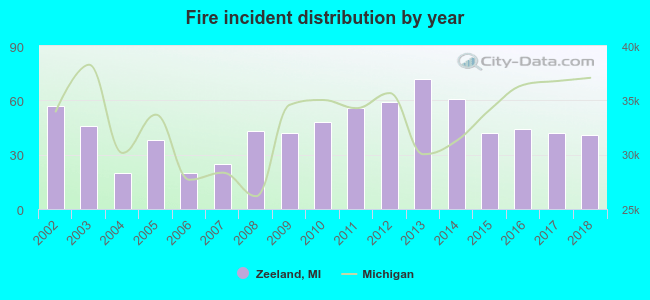 According to the data from the years 2002 - 2018 the average number of fires per year is 44. The highest number of fires - 72 took place in 2013, and the least - 20 in 2004. The data has a dropping trend.
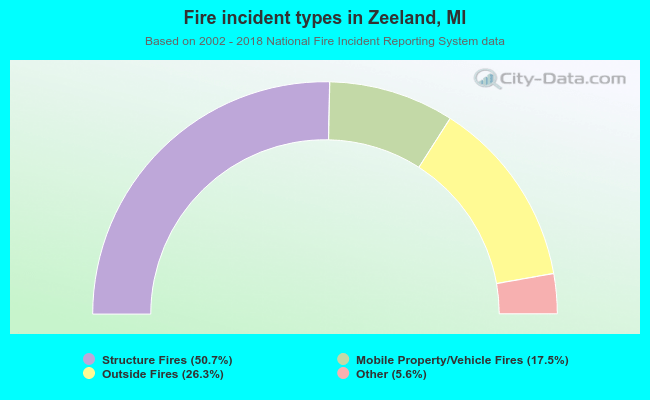 When looking into fire subcategories, the most reports belonged to: Structure Fires (50.7%), and Outside Fires (26.3%).