Estimated zip code population in 2022: 1,179 Zip code population in 2010: 1,756 Zip code population in 2000: 1,874
Houses and condos: 989 Renter-occupied apartments: 184
% of renters here:
27%
State:
44%
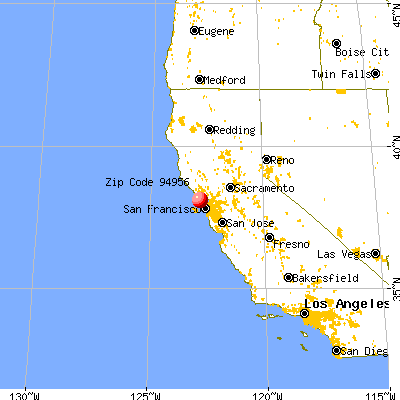
March 2022 cost of living index in zip code 94956: 126.3 (high, U.S. average is 100)
Land area: 58.4 sq. mi. Water area: 11.3 sq. mi.
Population density: 20 people per square mile
(very low).
OSM Map
General Map
Google Map
MSN Map
OSM Map
General Map
Google Map
MSN Map
OSM Map
General Map
Google Map
MSN Map
OSM Map
General Map
Google Map
MSN Map
Please wait while loading the map...
Real estate property taxes paid for housing units in 2022:
This zip code:
0.4% ($6,364)
California:
0.7% ($4,831)
Median real estate property taxes paid for housing units with mortgages in 2022: $10,330 (0.6%) Median real estate property taxes paid for housing units with no mortgage in 2022: $5,973 (0.3%)
Business Search- 14 Million verified businesses
Males: 507
(43.0%)
Females: 671
(57.0%)
For population 25 years and over in 94956:
High school or higher: 95.9%
Bachelor's degree or higher: 63.1%
Graduate or professional degree: 30.9%
Unemployed: 7.9%
Mean travel time to work (commute): 33.7 minutes
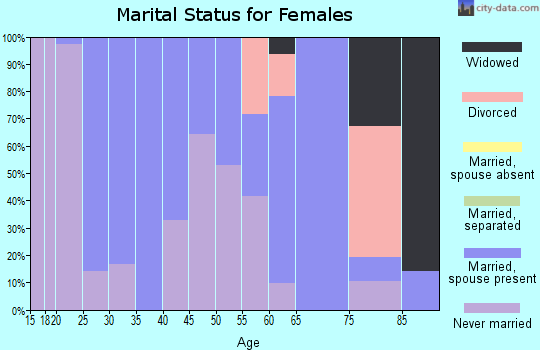
For population 15 years and over in 94956:
Never married: 25.6%
Now married: 53.8%
Separated: 2.0%
Widowed: 5.4%
Divorced: 13.2%
Zip code 94956 compared to state average:
Median house value significantly above state average.
Black race population percentage significantly below state average.
Hispanic race population percentage significantly below state average.
Median age significantly above state average.
Foreign-born population percentage significantly below state average.
Renting percentage below state average.
Length of stay since moving in above state average.
Number of rooms per house below state average.
Number of college students significantly below state average.
Percentage of population with a bachelor's degree or higher significantly above state average.
Estimated median house/condo value in 2022: $1,721,613
94956:
$1,721,613
California:
$715,900
Median resident age:
This zip code:
62.6 years
California median age:
37.9 years
Average household size:
This zip code:
1.7 people
California:
2.8 people
Averages for the 2020 tax year for zip code 94956, filed in 2021:
Average Adjusted Gross Income (AGI) in 2020: $88,656 (Individual Income Tax Returns)
Here:
$88,656
State:
$95,910
Salary/wage: $58,906 (reported on 59.5% of returns)
Here:
$58,906
State:
$77,331
(% of AGI for various income ranges: 1397.8% for AGIs below $25k, 3903.8% for AGIs $25k-50k, 7508.0% for AGIs $50k-75k, 12620.0% for AGIs $75k-100k, 12506.7% for AGIs $100k-200k)
Taxable interest for individuals: $2,851 (reported on 49.4% of returns)
This zip code:
$2,851
California:
$2,294
(% of AGI for various income ranges: 55.6% for AGIs below $25k, 112.5% for AGIs $25k-50k, 148.0% for AGIs $50k-75k, 130.0% for AGIs $75k-100k, 706.7% for AGIs $100k-200k)
Ordinary dividends: $17,810 (reported on 39.2% of returns)
Here:
$17,810
State:
$10,949
(% of AGI for various income ranges: 178.9% for AGIs below $25k, 233.8% for AGIs $25k-50k, 590.0% for AGIs $50k-75k, 946.7% for AGIs $75k-100k, 3050.0% for AGIs $100k-200k)
Net capital gain/loss in AGI: +$31,334 (reported on 36.7% of returns)
Here:
+$31,334
State:
+$49,306
(% of AGI for various income ranges: 84.4% for AGIs below $25k, 318.8% for AGIs $25k-50k, 564.0% for AGIs $50k-75k, 1360.0% for AGIs $75k-100k, 2453.3% for AGIs $100k-200k)
Profit/loss from business: +$24,154 (reported on 32.9% of returns)
Here:
+$24,154
State:
+$15,671
(% of AGI for various income ranges: 510.0% for AGIs below $25k, 1440.0% for AGIs $25k-50k, 1646.0% for AGIs $50k-75k, 580.0% for AGIs $75k-100k, 2881.7% for AGIs $100k-200k)
Taxable individual retirement arrangement distribution: $21,750 (reported on 15.2% of returns)
94956:
$21,750
California:
$23,505
(% of AGI for various income ranges: 325.6% for AGIs below $25k, 1240.0% for AGIs $50k-75k, 1316.7% for AGIs $100k-200k)
Self-employed (Keogh) retirement plans: $27,050 (reported on 2.5% of returns)
94956:
$27,050
California:
$30,163
(% of AGI for various income ranges: 676.2% for AGIs $25k-50k)
Total itemized deductions: $63,623 (reported on 16.5% of returns)
Here:
$63,623
State:
$39,517
(% of AGI for various income ranges: 785.6% for AGIs below $25k, 2032.0% for AGIs $50k-75k, 2336.7% for AGIs $100k-200k)
Charity contributions: $15,133 (reported on 15.2% of returns)
Here:
$15,133
State:
$12,598
(% of AGI for various income ranges: 280.0% for AGIs $50k-75k, 505.0% for AGIs $100k-200k)
Taxes paid: $8,431 (reported on 16.5% of returns)
94956:
$8,431
State:
$8,807
(% of AGI for various income ranges: 132.2% for AGIs below $25k, 360.0% for AGIs $50k-75k, 590.0% for AGIs $100k-200k)
Earned income credit: $1,600 (reported on 7.6% of returns)
Here:
$1,600
State:
$2,074
(% of AGI for various income ranges: 106.7% for AGIs below $25k)
Percentage of individuals using paid preparers for their 2020 taxes: 88.6%
Here:
89%
State:
92%
(% for various income ranges: 86.4% for AGIs below $25k, 88.2% for AGIs $25k-50k, 90.9% for AGIs $50k-75k, 87.5% for AGIs $75k-100k, 92.9% for AGIs $100k-200k, 85.7% for AGIs over 200k)
Averages for the 2012 tax year for zip code 94956, filed in 2013:
Average Adjusted Gross Income (AGI) in 2012: $74,408 (Individual Income Tax Returns)
Here:
$74,408
State:
$72,726
Salary/wage: $50,924 (reported on 64.0% of returns)
Here:
$50,924
State:
$59,079
(% of AGI for various income ranges: 60.4% for AGIs below $25k, 61.0% for AGIs $25k-50k, 57.9% for AGIs $50k-75k, 55.0% for AGIs $75k-100k, 49.6% for AGIs $100k-200k, 25.6% for AGIs over 200k)
Taxable interest for individuals: $1,915 (reported on 46.5% of returns)
This zip code:
$1,915
California:
$2,146
(% of AGI for various income ranges: 2.9% for AGIs below $25k, 1.3% for AGIs $25k-50k, 2.0% for AGIs $50k-75k, 1.3% for AGIs $75k-100k, 1.1% for AGIs $100k-200k, 0.7% for AGIs over 200k)
Ordinary dividends: $14,045 (reported on 33.7% of returns)
Here:
$14,045
State:
$9,308
(% of AGI for various income ranges: 4.9% for AGIs below $25k, 4.7% for AGIs $25k-50k, 5.6% for AGIs $50k-75k, 5.8% for AGIs $75k-100k, 5.2% for AGIs $100k-200k, 8.1% for AGIs over 200k)
Net capital gain/loss in AGI: +$23,455 (reported on 33.7% of returns)
Here:
+$23,455
State:
+$30,460
(% of AGI for various income ranges: 0.9% for AGIs $25k-50k, 2.6% for AGIs $50k-75k, 0.8% for AGIs $75k-100k, 5.6% for AGIs $100k-200k, 23.0% for AGIs over 200k)
Profit/loss from business: +$24,097 (reported on 34.9% of returns)
Here:
+$24,097
State:
+$17,064
(% of AGI for various income ranges: 24.4% for AGIs below $25k, 15.5% for AGIs $25k-50k, 12.7% for AGIs $50k-75k, 14.8% for AGIs $75k-100k, 23.6% for AGIs $100k-200k)
Taxable individual retirement arrangement distribution: $18,267 (reported on 14.0% of returns)
94956:
$18,267
California:
$19,557
(% of AGI for various income ranges: 3.8% for AGIs below $25k, 3.2% for AGIs $25k-50k, 8.9% for AGIs $50k-75k, 8.5% for AGIs $100k-200k)
Self-employment retirement plans: $20,533 (reported on 3.5% of returns)
94956:
$20,533
California:
$24,530
Total itemized deductions: $36,309 (26% of AGI, reported on 38.4% of returns)
Here:
$36,309
State:
$34,004
Here:
25.9% of AGI
State:
22.7% of AGI
(% of AGI for various income ranges: 18.6% for AGIs below $25k, 12.0% for AGIs $25k-50k, 14.9% for AGIs $50k-75k, 17.7% for AGIs $75k-100k, 18.8% for AGIs $100k-200k, 22.3% for AGIs over 200k)
Charity contributions: $7,020 (reported on 29.1% of returns)
Here:
$7,020
State:
$4,659
(% of AGI for various income ranges: 0.8% for AGIs $25k-50k, 1.9% for AGIs $50k-75k, 2.4% for AGIs $75k-100k, 2.0% for AGIs $100k-200k, 4.5% for AGIs over 200k)
Taxes paid: $14,455 (reported on 38.4% of returns)
94956:
$14,455
State:
$14,448
(% of AGI for various income ranges: 3.7% for AGIs below $25k, 3.5% for AGIs $25k-50k, 4.8% for AGIs $50k-75k, 5.5% for AGIs $75k-100k, 8.7% for AGIs $100k-200k, 9.9% for AGIs over 200k)
Earned income credit: $1,456 (reported on 10.5% of returns)
Here:
$1,456
State:
$2,286
(% of AGI for various income ranges: 3.6% for AGIs below $25k)
Percentage of individuals using paid preparers for their 2012 taxes: 62.8%
Here:
63%
State:
64%
(% for various income ranges: 55.2% for AGIs below $25k, 56.5% for AGIs $25k-50k, 63.6% for AGIs $50k-75k, 75.0% for AGIs $75k-100k, 80.0% for AGIs $100k-200k, 80.0% for AGIs over 200k)
Averages for the 2004 tax year for zip code 94956, filed in 2005:
Average Adjusted Gross Income (AGI) in 2004: $50,166 (Individual Income Tax Returns)
Here:
$50,166
State:
$58,600
Salary/wage: $36,381 (reported on 67.8% of returns)
Here:
$36,381
State:
$49,455
(% of AGI for various income ranges: 158.9% for AGIs below $10k, 70.0% for AGIs $10k-25k, 68.1% for AGIs $25k-50k, 51.7% for AGIs $50k-75k, 57.0% for AGIs $75k-100k, 33.3% for AGIs over 100k)
Taxable interest for individuals: $2,737 (reported on 60.5% of returns)
This zip code:
$2,737
California:
$2,365
(% of AGI for various income ranges: 28.3% for AGIs below $10k, 3.2% for AGIs $10k-25k, 3.3% for AGIs $25k-50k, 3.7% for AGIs $50k-75k, 2.6% for AGIs $75k-100k, 2.9% for AGIs over 100k)
Taxable dividends: $5,472 (reported on 42.0% of returns)
Here:
$5,472
State:
$4,746
(% of AGI for various income ranges: 26.4% for AGIs below $10k, 4.3% for AGIs $10k-25k, 4.1% for AGIs $25k-50k, 6.3% for AGIs $50k-75k, 3.3% for AGIs $75k-100k, 4.2% for AGIs over 100k)
Net capital gain/loss: +$16,613 (reported on 36.0% of returns)
Here:
+$16,613
State:
+$23,418
(% of AGI for various income ranges: -12.4% for AGIs below $10k, -0.1% for AGIs $10k-25k, 1.8% for AGIs $25k-50k, 4.1% for AGIs $50k-75k, 3.6% for AGIs $75k-100k, 23.4% for AGIs over 100k)
Profit/loss from business: +$23,057 (reported on 31.2% of returns)
Here:
+$23,057
State:
+$16,826
(% of AGI for various income ranges: -35.7% for AGIs below $10k, 20.5% for AGIs $10k-25k, 11.2% for AGIs $25k-50k, 17.3% for AGIs $50k-75k, 12.2% for AGIs $75k-100k, 14.9% for AGIs over 100k)
IRA payment deduction: $3,609 (reported on 5.4% of returns)
94956:
$3,609
California:
$3,192
(% of AGI for various income ranges: 1.3% for AGIs $10k-25k, 0.3% for AGIs $25k-50k, 0.6% for AGIs $50k-75k, 0.3% for AGIs over 100k)
Self-employed pension: $12,459 (reported on 4.4% of returns)
Here:
$12,459
California:
$17,688
(% of AGI for various income ranges: 2.5% for AGIs $10k-25k, 1.3% for AGIs $50k-75k, 1.5% for AGIs over 100k)
Total itemized deductions: $28,110 (33% of AGI, reported on 38.4% of returns)
Here:
$28,110
State:
$28,113
Here:
32.8% of AGI
State:
25.3% of AGI
(% of AGI for various income ranges: 135.0% for AGIs below $10k, 18.4% for AGIs $10k-25k, 15.1% for AGIs $25k-50k, 20.8% for AGIs $50k-75k, 22.9% for AGIs $75k-100k, 22.7% for AGIs over 100k)
Charity contributions deductions: $6,599 (7% of AGI, reported on 32.1% of returns)
Here:
$6,599
State:
$3,923
Here:
7.1% of AGI
State:
3.3% of AGI
(% of AGI for various income ranges: 4.8% for AGIs below $10k, 0.8% for AGIs $10k-25k, 1.9% for AGIs $25k-50k, 2.1% for AGIs $50k-75k, 2.4% for AGIs $75k-100k, 6.9% for AGIs over 100k)
Total tax: $7,472 (reported on 82.0% of returns)
94956:
$7,472
State:
$10,761
(% of AGI for various income ranges: 15.0% for AGIs below $10k, 6.9% for AGIs $10k-25k, 8.8% for AGIs $25k-50k, 10.9% for AGIs $50k-75k, 11.5% for AGIs $75k-100k, 15.1% for AGIs over 100k)
Earned income credit: $1,039 (reported on 9.1% of returns)
Here:
$1,039
State:
$1,763
Percentage of individuals using paid preparers for their 2004 taxes: 68.3%
Here:
68%
State:
66%
(% for various income ranges: 58.9% for AGIs below $10k, 62.6% for AGIs $10k-25k, 67.3% for AGIs $25k-50k, 72.6% for AGIs $50k-75k, 74.6% for AGIs $75k-100k, 86.9% for AGIs over 100k)
Household received Food Stamps/SNAP in the past 12 months: 93 Household did not receive Food Stamps/SNAP in the past 12 months: 586
Women who did not have a birth in the past 12 months: 149 (24 now married, 127 unmarried)
Housing units in zip code 94956 with a mortgage: 166 (43 second mortgage, 31 both second mortgage and home equity loan) Median monthly owner costs for units with a mortgage: $2,860 Median monthly owner costs for units without a mortgage: $1,176
Residents with income below the poverty level in 2022:
This zip code:
9.7%
Whole state:
12.2%
Residents with income below 50% of the poverty level in 2022:
This zip code:
2.0%
Whole state:
6.2%
Median number of rooms in houses and condos:
Here:
4.9
State:
6.0
Median number of rooms in apartments:
Here:
2.6
State:
3.9
Notable locations in this zip code not listed on our city pages
Notable locations in zip code 94956: Coast Campground (A), D Ranch (B), White House Pool (C), Sea Lion Overlook (D), Point Reyes Lighthouse Visitor Center (E), Glen Campground (F), Sky Campground (G), Laguna Ranch (H), Wildcat Camp (I), Point Reyes Lighthouse (J), Bear Valley Ranch (K), Point Reyes Station Branch Marin County Free Library (L), Kenneth C Patrick Visitor Center (M), Bear Valley Visitor Center (N), Marin County Fire Department Point Reyes (O). Display/hide their locations on the map
Creeks: Nicasio Creek (A), Santa Maria Creek (B), Olema Creek (C), Coast Creek (D), Alamere Creek (E), Lagunitas Creek (F). Display/hide their locations on the map
Parks in zip code 94956 include: Sir Francis Drake Historical Monument (1), Tomales Bay Ecological Reserve (2), Drakes Monument (3). Display/hide their locations on the map
Beaches: Drakes Beach (A), Kelham Beach (B), South Beach (C), Point Reyes Beach (D), North Beach (E), Wildcat Beach (F), Sculptured Beach (G), Santa Maria Beach (H), Alan Sieroty Beach (I). Display/hide their locations on the map
In group quarters: 27 (-1 institutionalized population)
Size of family households: 261 2-persons, 6 3-persons, 35 4-persons, 6 5-persons
Size of nonfamily households: 361 1-person, 14 2-persons
25 married couples with children.
0 single-parent households ().
97.5% of residents of 94956 zip code speak English at home.
3.0% of residents speak Spanish at home (37% very well, 63% well).
Foreign born population: 133 (11.3%) (28.0% of them are naturalized citizens)
This zip code:
11.3%
Whole state:
26.7%
40%United Kingdom, excluding England and Scotland
39%Sweden
24%Honduras
18%Chile
17%France
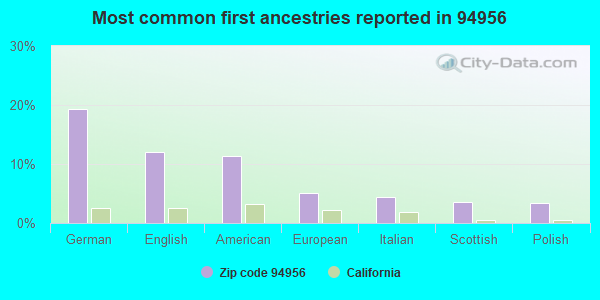
19%German
12%English
11%American
5%European
4%Italian
4%Scottish
3%Polish
Year of entry for the foreign-born population
212010 or later
02000 to 2009
301990 to 1999
79Before 1990
Facilities with environmental interests located in this zip code:
INVERNESS ELEMENTARY (BAY VIEW & MESA in POINT REYES STATION, CA)
(National Center for Education Statistics) - STATE ID-6024947 Organizations: SHORELINE UNIFIED (SCHOOL DISTRICT)
GULF OF THE FARALLONES NATIONAL MARINE SANCTUARY (OFF SHORE APPROX 3 MILES SOUTH OF POINT REYES in POINT REYES STATION, CA)
(Integrated Compliance Information System) - ICIS-09-2003-0151, FORMAL ENFORCEMENT ACTION, ICIS-09-2003-0152, Business SIC classification: LAND, MINERAL, WILDLIFE, AND FOREST CONSERVATION
AMER TELE & TELE CO THREE PEAKS G S (5.5 MI NNE OF in POINT REYES STATION, CA)
(Resource Conservation and Recovery Act (tracking hazardous waste)) Organizations: AMERICAN TELEPHONE AND TELEGRAPH COMPANY (CONTACT/OWNER)
MONTES DUMP AKA POINT REYES STATION (40 TOMASINI CANYON RD in POINT REYES STATION, CA)
CRITERIA AND HAZARDOUS AIR POLLUTANT INVENTORY (Inventory of air pollution sources) Business SIC classification: REFUSE SYSTEMS Business NAICS classification: SOLID WASTE LANDFILL.
CAFE REYES (11101 STATE ROUTE 1 in POINT REYES STATION, CA)
CRITERIA AND HAZARDOUS AIR POLLUTANT INVENTORY (Inventory of air pollution sources) Business SIC classification: ROASTED COFFEE
Housing units lacking complete plumbing facilities: 2.8% Housing units lacking complete kitchen facilities: 1.9%
40.0%Bottled, tank, or LP gas
26.6%Wood
22.9%Electricity
8.7%Utility gas
1.1%Fuel oil, kerosene, etc.
0.9%Solar energy
Population in 1990: 951. Population change in the 1990s: +923 (+97.1%).
Place of birth for U.S.-born residents:
This state: 680
Northeast: 175
Midwest: 170
South: 11
70% of the 94956 zip code residents lived in the same house 5 years ago. Out of people who lived in different houses, 39% lived in this county. Out of people who lived in different counties, 50% lived in California.
90% of the 94956 zip code residents lived in the same house 1 year ago. Out of people who lived in different houses, 20% moved from this county. Out of people who lived in different houses, 50% moved from different county within same state. Out of people who lived in different houses, 32% moved from different state.
Private vs. public school enrollment:
Students in private schools in grades 1 to 8 (elementary and middle school):
Here:
0.0%
California:
10.5%
Students in private schools in grades 9 to 12 (high school): 5
Here:
100.0%
California:
8.5%
Occupation by median earnings in the past 12 months ($)
201,841Management occupations
137,424Education, training, and library occupations
90,019Arts, design, entertainment, sports, and media occupations
85,395Community and social service occupations
51,770Building and grounds cleaning and maintenance occupations
16,656Sales and related occupations
Companies with federal contracts located in this zip code:
W S M CONSTRUCTION (4 FOX DR in POINT REYES STATION, CA; small business) 2 employees, $300000 revenue. : $232,000 in 13 contractsfrom 2000 to 2002
Contracts for Maintenance, Repair or Alteration of Real Property -- Miscellaneous Buildings, Maintenance, Repair or Alteration of Real Property -- Other Residential Buildings by National Park Service Signed by year:2000: $90,000; 2001: $121,000; 2002: $21,000; 2003: $0; 2004: $0; 2005: $0; 2006: $0.
Biggest contracts:
$47,000 with National Park Service for Maintenance, Repair or Alteration of Real Property -- Miscellaneous Buildings. Signed on 2001-07-15. Completion date: 2001-11-15.
$42,000, same as above.Signed on 2000-09-15. Completion date: 2001-04-15.
$38,000, same as above.Signed on 2000-12-15. Completion date: 2001-06-15.
$34,000, same as above.Signed on 2001-04-15. Completion date: 2001-10-15.
STARQUEST VENTURES, INC (11431 STATE ROUTE 1 STE 9 in POINT REYES ST, CA; small business) : $27,875 in 2 contractsin 2005
$24,995 with Defense Information Systems Agency for Other ADP and Telecommunications Services (includes data storage on tapes, compact disks, etc.). Taking place in AL. Signed on 2005-10-01. Completion date: 2006-09-30.
$2,880 with ENERGY, Department of for ADP Software. Taking place in AZ. Signed on 2005-08-10. Completion date: 2006-07-27.
Top industries in this zip code by the number of employees in 2005:
Administrative and Support and Waste Management and Remediation Services: Landscaping Services (20-49 employees: 1 establishment, 1-4 employees: 2 establishments)
Other Services (except Public Administration): Environment, Conservation and Wildlife Organizations (10-19: 2, 1-4: 2)
Accommodation and Food Services: Full-Service Restaurants (20-49: 1)
Health Care and Social Assistance: All Other Outpatient Care Centers (20-49: 1)
Health Care and Social Assistance: Other Individual and Family Services (20-49: 1)
Accommodation and Food Services: Limited-Service Restaurants (10-19: 2, 1-4: 1)
Health Care and Social Assistance: Child Day Care Services (10-19: 1, 1-4: 1)
Information: Newspaper Publishers (10-19: 1)
People in group quarters in 2010:
3 people in other noninstitutional facilities
People in group quarters in 2000:
50 people in other workers' dormitories
13 people in military barracks, etc.
12 people in religious group quarters
3 people in homes for the mentally ill
2 people in other noninstitutional group quarters
Fatal accident statistics in 2013:
Fatal accident count: 1
Vehicles involved in fatal accidents: 1
Fatal accidents caused by drunken drivers: 1
Fatalities: 1
Persons involved in fatal accidents: 1
Pedestrians involved in fatal accidents: 1
Home Mortgage Disclosure Act Aggregated Statistics For Year 2009 (Based on 4 partial tracts)
A) FHA, FSA/RHS & VA Home Purchase Loans
B) Conventional Home Purchase Loans
C) Refinancings
D) Home Improvement Loans
F) Non-occupant Loans on < 5 Family Dwellings (A B C & D)
Number
Average Value
Number
Average Value
Number
Average Value
Number
Average Value
Number
Average Value
LOANS ORIGINATED
0
$0
6
$459,975
61
$371,373
2
$401,470
28
$409,886
APPLICATIONS APPROVED, NOT ACCEPTED
0
$0
2
$587,350
9
$467,730
0
$0
6
$526,772
APPLICATIONS DENIED
0
$0
2
$420,475
18
$461,742
1
$276,400
6
$484,622
APPLICATIONS WITHDRAWN
1
$227,340
3
$352,640
10
$430,424
1
$120,930
3
$601,170
FILES CLOSED FOR INCOMPLETENESS
0
$0
1
$276,400
1
$848,550
0
$0
1
$696,530
Aggregated Statistics For Year 2008 (Based on 4 partial tracts)
B) Conventional Home Purchase Loans
C) Refinancings
D) Home Improvement Loans
F) Non-occupant Loans on < 5 Family Dwellings (A B C & D)
Number
Average Value
Number
Average Value
Number
Average Value
Number
Average Value
LOANS ORIGINATED
9
$448,536
26
$423,184
2
$200,045
17
$396,878
APPLICATIONS APPROVED, NOT ACCEPTED
1
$325,460
0
$0
0
$0
0
$0
APPLICATIONS DENIED
0
$0
10
$531,310
1
$153,400
1
$255,670
APPLICATIONS WITHDRAWN
1
$381,430
6
$250,833
1
$276,400
2
$279,510
FILES CLOSED FOR INCOMPLETENESS
1
$395,250
1
$93,290
1
$61,500
0
$0
Aggregated Statistics For Year 2007 (Based on 4 partial tracts)
B) Conventional Home Purchase Loans
C) Refinancings
D) Home Improvement Loans
F) Non-occupant Loans on < 5 Family Dwellings (A B C & D)
Number
Average Value
Number
Average Value
Number
Average Value
Number
Average Value
LOANS ORIGINATED
10
$577,261
29
$451,533
4
$378,495
17
$475,408
APPLICATIONS APPROVED, NOT ACCEPTED
2
$710,350
3
$346,420
1
$69,100
2
$554,875
APPLICATIONS DENIED
1
$876,880
6
$633,532
1
$103,650
2
$623,630
APPLICATIONS WITHDRAWN
0
$0
4
$530,170
0
$0
2
$529,995
FILES CLOSED FOR INCOMPLETENESS
0
$0
0
$0
1
$2,070
0
$0
Aggregated Statistics For Year 2006 (Based on 4 partial tracts)
B) Conventional Home Purchase Loans
C) Refinancings
D) Home Improvement Loans
F) Non-occupant Loans on < 5 Family Dwellings (A B C & D)
Number
Average Value
Number
Average Value
Number
Average Value
Number
Average Value
LOANS ORIGINATED
13
$567,949
28
$440,858
3
$361,853
13
$531,273
APPLICATIONS APPROVED, NOT ACCEPTED
3
$452,373
5
$482,732
0
$0
2
$725,550
APPLICATIONS DENIED
1
$234,940
11
$551,606
1
$500,980
1
$621,900
APPLICATIONS WITHDRAWN
2
$815,380
8
$548,136
1
$259,130
1
$1,098,690
FILES CLOSED FOR INCOMPLETENESS
0
$0
0
$0
0
$0
0
$0
Aggregated Statistics For Year 2005 (Based on 4 partial tracts)
B) Conventional Home Purchase Loans
C) Refinancings
D) Home Improvement Loans
F) Non-occupant Loans on < 5 Family Dwellings (A B C & D)
Number
Average Value
Number
Average Value
Number
Average Value
Number
Average Value
LOANS ORIGINATED
19
$549,599
37
$506,335
5
$387,512
18
$487,731
APPLICATIONS APPROVED, NOT ACCEPTED
5
$528,754
3
$754,803
0
$0
3
$533,913
APPLICATIONS DENIED
1
$641,250
8
$732,632
1
$183,120
1
$71,170
APPLICATIONS WITHDRAWN
6
$464,122
10
$386,545
0
$0
1
$1,119,420
FILES CLOSED FOR INCOMPLETENESS
1
$230,100
1
$204,540
0
$0
1
$204,540
Aggregated Statistics For Year 2004 (Based on 4 partial tracts)
B) Conventional Home Purchase Loans
C) Refinancings
D) Home Improvement Loans
F) Non-occupant Loans on < 5 Family Dwellings (A B C & D)
Number
Average Value
Number
Average Value
Number
Average Value
Number
Average Value
LOANS ORIGINATED
15
$555,610
50
$426,236
5
$326,152
15
$439,522
APPLICATIONS APPROVED, NOT ACCEPTED
3
$386,040
11
$421,887
1
$169,300
6
$352,987
APPLICATIONS DENIED
1
$266,040
9
$336,133
0
$0
3
$283,770
APPLICATIONS WITHDRAWN
3
$550,727
8
$326,930
3
$224,113
2
$610,845
FILES CLOSED FOR INCOMPLETENESS
3
$337,440
1
$138,200
0
$0
1
$138,200
Aggregated Statistics For Year 2003 (Based on 4 partial tracts)
B) Conventional Home Purchase Loans
C) Refinancings
D) Home Improvement Loans
F) Non-occupant Loans on < 5 Family Dwellings (A B C & D)
Number
Average Value
Number
Average Value
Number
Average Value
Number
Average Value
LOANS ORIGINATED
15
$516,545
145
$312,994
1
$17,280
37
$326,040
APPLICATIONS APPROVED, NOT ACCEPTED
6
$567,657
17
$359,035
0
$0
3
$278,473
APPLICATIONS DENIED
3
$396,403
15
$536,723
0
$0
3
$645,393
APPLICATIONS WITHDRAWN
3
$260,507
24
$269,029
0
$0
3
$230,333
FILES CLOSED FOR INCOMPLETENESS
1
$266,040
5
$220,844
0
$0
0
$0
Aggregated Statistics For Year 2002 (Based on 4 partial tracts)
B) Conventional Home Purchase Loans
C) Refinancings
D) Home Improvement Loans
F) Non-occupant Loans on < 5 Family Dwellings (A B C & D)
Number
Average Value
Number
Average Value
Number
Average Value
Number
Average Value
LOANS ORIGINATED
9
$437,863
93
$330,989
3
$45,837
28
$351,670
APPLICATIONS APPROVED, NOT ACCEPTED
3
$454,447
19
$277,346
0
$0
3
$289,760
APPLICATIONS DENIED
1
$179,660
10
$381,570
1
$6,910
4
$213,172
APPLICATIONS WITHDRAWN
1
$206,610
9
$249,604
0
$0
1
$462,280
FILES CLOSED FOR INCOMPLETENESS
1
$386,960
7
$301,770
0
$0
1
$155,480
Aggregated Statistics For Year 2001 (Based on 4 partial tracts)
B) Conventional Home Purchase Loans
C) Refinancings
D) Home Improvement Loans
F) Non-occupant Loans on < 5 Family Dwellings (A B C & D)
Number
Average Value
Number
Average Value
Number
Average Value
Number
Average Value
LOANS ORIGINATED
8
$349,041
70
$350,860
3
$65,647
16
$373,788
APPLICATIONS APPROVED, NOT ACCEPTED
1
$1,113,200
10
$344,533
1
$24,190
3
$180,813
APPLICATIONS DENIED
0
$0
7
$258,533
0
$0
0
$0
APPLICATIONS WITHDRAWN
1
$397,330
8
$275,622
1
$207,300
2
$373,830
FILES CLOSED FOR INCOMPLETENESS
1
$53,900
3
$174,823
0
$0
0
$0
Aggregated Statistics For Year 2000 (Based on 4 partial tracts)
B) Conventional Home Purchase Loans
C) Refinancings
D) Home Improvement Loans
F) Non-occupant Loans on < 5 Family Dwellings (A B C & D)
Number
Average Value
Number
Average Value
Number
Average Value
Number
Average Value
LOANS ORIGINATED
18
$397,056
19
$310,514
4
$78,948
8
$305,940
APPLICATIONS APPROVED, NOT ACCEPTED
1
$402,850
1
$183,810
0
$0
1
$221,120
APPLICATIONS DENIED
3
$257,743
6
$130,830
0
$0
1
$137,510
APPLICATIONS WITHDRAWN
1
$782,900
2
$31,095
0
$0
1
$483,700
FILES CLOSED FOR INCOMPLETENESS
0
$0
0
$0
0
$0
0
$0
Aggregated Statistics For Year 1999 (Based on 2 partial tracts)
B) Conventional Home Purchase Loans
C) Refinancings
D) Home Improvement Loans
F) Non-occupant Loans on < 5 Family Dwellings (A B C & D)
Detailed PMIC statistics for the following Tracts:1322.00
2005 - 2018 National Fire Incident Reporting System (NFIRS) incidents
According to the data from the years 2005 - 2018 the average number of fires per year is 8. The highest number of fires - 14 took place in 2011, and the least - 2 in 2005. The data has an increasing trend.
When looking into fire subcategories, the most incidents belonged to: Outside Fires (44.6%), and Structure Fires (29.5%).
Fire incident types reported to NFIRS in Zip Code 94956


 Nearest zip codes: 94937, 94950, 94940, 94938, 94924, 94933.


 According to the data from the years 2005 - 2018 the average number of fires per year is 8. The highest number of fires - 14 took place in 2011, and the least - 2 in 2005. The data has an increasing trend.
 When looking into fire subcategories, the most incidents belonged to: Outside Fires (44.6%), and Structure Fires (29.5%).