Estimated zip code population in 2022: 25,820 Zip code population in 2010: 27,080 Zip code population in 2000: 13,001
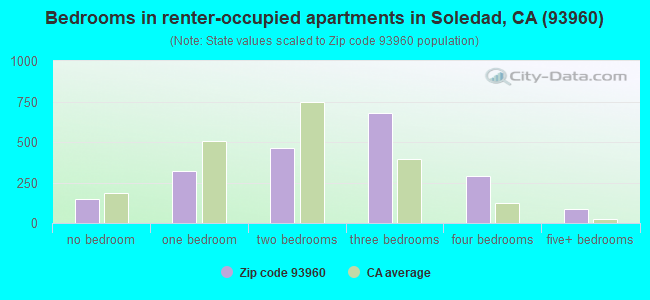
Houses and condos: 5,114 Renter-occupied apartments: 1,982
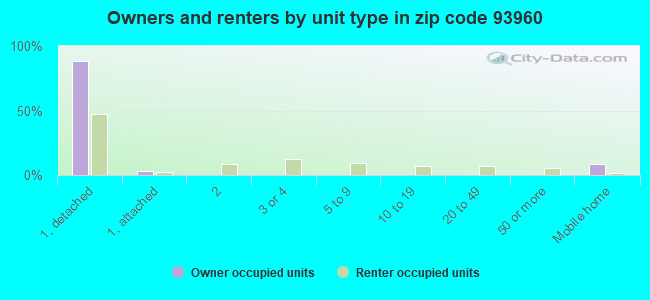
% of renters here:
41%
State:
44%
March 2022 cost of living index in zip code 93960: 104.9 (near average, U.S. average is 100)
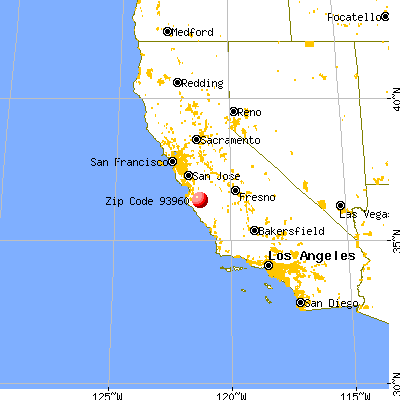
Land area: 204.0 sq. mi. Water area: 5.1 sq. mi.
Population density: 127 people per square mile
(very low).
OSM Map
General Map
Google Map
MSN Map
OSM Map
General Map
Google Map
MSN Map
OSM Map
General Map
Google Map
MSN Map
OSM Map
General Map
Google Map
MSN Map
Please wait while loading the map...
Real estate property taxes paid for housing units in 2022:
This zip code:
0.7% ($3,751)
California:
0.7% ($4,831)
Median real estate property taxes paid for housing units with mortgages in 2022: $4,292 (0.7%) Median real estate property taxes paid for housing units with no mortgage in 2022: $2,661 (0.6%)
Business Search- 14 Million verified businesses
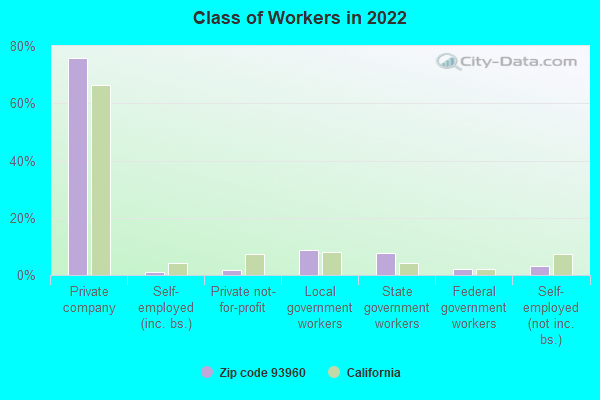
Males: 16,560
(64.1%)
Females: 9,256
(35.9%)
For population 25 years and over in 93960:
High school or higher: 57.2%
Bachelor's degree or higher: 6.4%
Graduate or professional degree: 1.7%
Unemployed: 2.2%
Mean travel time to work (commute): 25.2 minutes
For population 15 years and over in 93960:
Never married: 45.7%
Now married: 41.0%
Separated: 2.7%
Widowed: 2.3%
Divorced: 8.3%
Zip code 93960 compared to state average:
Unemployed percentage below state average.
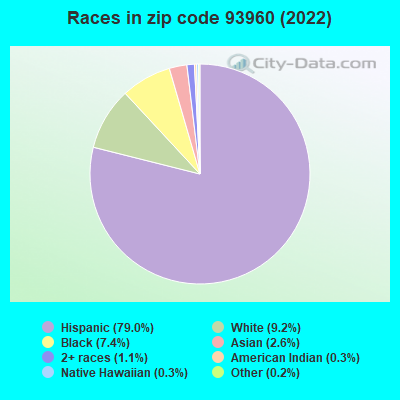
Hispanic race population percentage above state average.
Length of stay since moving in significantly above state average.
House age below state average.
Percentage of population with a bachelor's degree or higher significantly below state average.
Estimated median house/condo value in 2022: $566,161
93960:
$566,161
California:
$715,900
According to our research of California and other state lists, there were 12 registered sex offenders living in 93960 zip code as of June 07, 2024. The ratio of all residents to sex offenders in zip code 93960 is 2,268 to 1. The ratio of registered sex offenders to all residents in this zip code is much lower than the state average.
Median resident age:
This zip code:
35.9 years
California median age:
37.9 years
Average household size:
This zip code:
4.0 people
California:
2.8 people
Averages for the 2020 tax year for zip code 93960, filed in 2021:
Average Adjusted Gross Income (AGI) in 2020: $47,682 (Individual Income Tax Returns)
Here:
$47,682
State:
$95,910
Salary/wage: $47,097 (reported on 84.7% of returns)
Here:
$47,097
State:
$77,331
(% of AGI for various income ranges: 1840.8% for AGIs below $25k, 5092.6% for AGIs $25k-50k, 9486.2% for AGIs $50k-75k, 13214.0% for AGIs $75k-100k, 23801.8% for AGIs $100k-200k, 102575.0% for AGIs over 200k)
Taxable interest for individuals: $345 (reported on 27.1% of returns)
This zip code:
$345
California:
$2,294
(% of AGI for various income ranges: 2.3% for AGIs below $25k, 1.9% for AGIs $25k-50k, 6.2% for AGIs $50k-75k, 11.7% for AGIs $75k-100k, 44.2% for AGIs $100k-200k, 2705.0% for AGIs over 200k)
Ordinary dividends: $3,031 (reported on 3.2% of returns)
Here:
$3,031
State:
$10,949
(% of AGI for various income ranges: 1.2% for AGIs below $25k, 1.8% for AGIs $25k-50k, 4.0% for AGIs $50k-75k, 20.2% for AGIs $75k-100k, 84.7% for AGIs $100k-200k, 2030.0% for AGIs over 200k)
Net capital gain/loss in AGI: +$12,422 (reported on 3.8% of returns)
Here:
+$12,422
State:
+$49,306
(% of AGI for various income ranges: 1.5% for AGIs $25k-50k, 15.3% for AGIs $50k-75k, 57.7% for AGIs $75k-100k, 282.2% for AGIs $100k-200k, 14510.0% for AGIs over 200k)
Profit/loss from business: +$10,049 (reported on 7.3% of returns)
Here:
+$10,049
State:
+$15,671
(% of AGI for various income ranges: 83.1% for AGIs below $25k, 86.1% for AGIs $25k-50k, 186.0% for AGIs $50k-75k, 83.1% for AGIs $75k-100k, 518.0% for AGIs $100k-200k)
Taxable individual retirement arrangement distribution: $14,554 (reported on 1.3% of returns)
93960:
$14,554
California:
$23,505
(% of AGI for various income ranges: 5.4% for AGIs below $25k, 21.1% for AGIs $25k-50k, 81.0% for AGIs $75k-100k, 234.0% for AGIs $100k-200k)
Total itemized deductions: $28,088 (reported on 8.7% of returns)
Here:
$28,088
State:
$39,517
(% of AGI for various income ranges: 45.4% for AGIs below $25k, 126.8% for AGIs $25k-50k, 438.0% for AGIs $50k-75k, 975.4% for AGIs $75k-100k, 2206.0% for AGIs $100k-200k, 13675.0% for AGIs over 200k)
Charity contributions: $3,132 (reported on 7.0% of returns)
Here:
$3,132
State:
$12,598
(% of AGI for various income ranges: 12.2% for AGIs $25k-50k, 21.6% for AGIs $50k-75k, 57.1% for AGIs $75k-100k, 190.9% for AGIs $100k-200k, 3140.0% for AGIs over 200k)
Taxes paid: $8,683 (reported on 8.7% of returns)
93960:
$8,683
State:
$8,807
(% of AGI for various income ranges: 10.2% for AGIs below $25k, 34.9% for AGIs $25k-50k, 131.1% for AGIs $50k-75k, 326.9% for AGIs $75k-100k, 739.1% for AGIs $100k-200k, 3200.0% for AGIs over 200k)
Earned income credit: $2,461 (reported on 17.8% of returns)
Here:
$2,461
State:
$2,074
(% of AGI for various income ranges: 141.9% for AGIs below $25k, 112.4% for AGIs $25k-50k, 3.0% for AGIs $50k-75k)
Percentage of individuals using paid preparers for their 2020 taxes: 83.5%
Here:
83%
State:
92%
(% for various income ranges: 69.6% for AGIs below $25k, 91.3% for AGIs $25k-50k, 91.6% for AGIs $50k-75k, 92.7% for AGIs $75k-100k, 91.5% for AGIs $100k-200k, 100.0% for AGIs over 200k)
Averages for the 2012 tax year for zip code 93960, filed in 2013:
Average Adjusted Gross Income (AGI) in 2012: $41,408 (Individual Income Tax Returns)
Here:
$41,408
State:
$72,726
Salary/wage: $36,580 (reported on 93.9% of returns)
Here:
$36,580
State:
$59,079
(% of AGI for various income ranges: 85.9% for AGIs below $25k, 90.4% for AGIs $25k-50k, 91.2% for AGIs $50k-75k, 89.8% for AGIs $75k-100k, 85.6% for AGIs $100k-200k, 27.4% for AGIs over 200k)
Taxable interest for individuals: $747 (reported on 18.8% of returns)
This zip code:
$747
California:
$2,146
(% of AGI for various income ranges: 0.1% for AGIs below $25k, 0.3% for AGIs $50k-75k, 0.2% for AGIs $75k-100k, 0.5% for AGIs $100k-200k, 1.3% for AGIs over 200k)
Ordinary dividends: $3,152 (reported on 3.8% of returns)
Here:
$3,152
State:
$9,308
(% of AGI for various income ranges: 0.2% for AGIs below $25k, 0.2% for AGIs $50k-75k, 0.2% for AGIs $75k-100k, 0.6% for AGIs $100k-200k, 0.8% for AGIs over 200k)
Net capital gain/loss in AGI: +$3,630 (reported on 2.8% of returns)
Here:
+$3,630
State:
+$30,460
(% of AGI for various income ranges: 0.2% for AGIs $100k-200k, 2.4% for AGIs over 200k)
Profit/loss from business: +$8,589 (reported on 8.1% of returns)
Here:
+$8,589
State:
+$17,064
(% of AGI for various income ranges: 3.4% for AGIs below $25k, 2.2% for AGIs $25k-50k, 1.3% for AGIs $50k-75k, 1.1% for AGIs $75k-100k, 1.0% for AGIs $100k-200k)
Taxable individual retirement arrangement distribution: $9,906 (reported on 2.3% of returns)
93960:
$9,906
California:
$19,557
(% of AGI for various income ranges: 0.4% for AGIs below $25k, 0.2% for AGIs $25k-50k, 0.4% for AGIs $50k-75k, 0.6% for AGIs $75k-100k, 1.7% for AGIs $100k-200k)
Total itemized deductions: $24,081 (29% of AGI, reported on 24.3% of returns)
Here:
$24,081
State:
$34,004
Here:
28.6% of AGI
State:
22.7% of AGI
(% of AGI for various income ranges: 3.9% for AGIs below $25k, 9.6% for AGIs $25k-50k, 17.4% for AGIs $50k-75k, 19.6% for AGIs $75k-100k, 20.6% for AGIs $100k-200k, 17.4% for AGIs over 200k)
Charity contributions: $1,942 (reported on 19.4% of returns)
Here:
$1,942
State:
$4,659
(% of AGI for various income ranges: 0.1% for AGIs below $25k, 0.4% for AGIs $25k-50k, 1.1% for AGIs $50k-75k, 1.4% for AGIs $75k-100k, 1.6% for AGIs $100k-200k, 1.1% for AGIs over 200k)
Taxes paid: $6,945 (reported on 24.3% of returns)
93960:
$6,945
State:
$14,448
(% of AGI for various income ranges: 0.7% for AGIs below $25k, 2.1% for AGIs $25k-50k, 4.1% for AGIs $50k-75k, 4.9% for AGIs $75k-100k, 6.3% for AGIs $100k-200k, 9.8% for AGIs over 200k)
Earned income credit: $2,590 (reported on 28.0% of returns)
Here:
$2,590
State:
$2,286
(% of AGI for various income ranges: 7.8% for AGIs below $25k, 2.1% for AGIs $25k-50k)
Percentage of individuals using paid preparers for their 2012 taxes: 80.3%
Here:
80%
State:
64%
(% for various income ranges: 79.7% for AGIs below $25k, 83.1% for AGIs $25k-50k, 78.6% for AGIs $50k-75k, 79.1% for AGIs $75k-100k, 76.3% for AGIs $100k-200k, 83.3% for AGIs over 200k)
Averages for the 2004 tax year for zip code 93960, filed in 2005:
Average Adjusted Gross Income (AGI) in 2004: $38,950 (Individual Income Tax Returns)
Here:
$38,950
State:
$58,600
Salary/wage: $35,005 (reported on 93.7% of returns)
Here:
$35,005
State:
$49,455
(% of AGI for various income ranges: 131.8% for AGIs below $10k, 86.7% for AGIs $10k-25k, 92.0% for AGIs $25k-50k, 92.0% for AGIs $50k-75k, 94.6% for AGIs $75k-100k, 51.3% for AGIs over 100k)
Taxable interest for individuals: $777 (reported on 29.4% of returns)
This zip code:
$777
California:
$2,365
(% of AGI for various income ranges: 3.4% for AGIs below $10k, 0.3% for AGIs $10k-25k, 0.3% for AGIs $25k-50k, 0.5% for AGIs $50k-75k, 0.3% for AGIs $75k-100k, 1.3% for AGIs over 100k)
Taxable dividends: $2,786 (reported on 6.5% of returns)
Here:
$2,786
State:
$4,746
(% of AGI for various income ranges: 1.8% for AGIs below $10k, 0.2% for AGIs $10k-25k, 0.3% for AGIs $25k-50k, 0.3% for AGIs $50k-75k, 0.3% for AGIs $75k-100k, 1.1% for AGIs over 100k)
Net capital gain/loss: +$16,251 (reported on 4.7% of returns)
Here:
+$16,251
State:
+$23,418
(% of AGI for various income ranges: -0.5% for AGIs below $10k, -0.1% for AGIs $10k-25k, -0.0% for AGIs $25k-50k, 0.5% for AGIs $50k-75k, -0.0% for AGIs $75k-100k, 9.6% for AGIs over 100k)
Profit/loss from business: +$7,154 (reported on 9.4% of returns)
Here:
+$7,154
State:
+$16,826
(% of AGI for various income ranges: 3.0% for AGIs below $10k, 2.9% for AGIs $10k-25k, 1.3% for AGIs $25k-50k, 1.7% for AGIs $50k-75k, 1.1% for AGIs $75k-100k, 2.0% for AGIs over 100k)
Profit/loss from farming: +$1,190 (reported on 0.4% of returns)
Here:
+$1,190
State:
-$7,562
IRA payment deduction: $3,470 (reported on 1.2% of returns)
93960:
$3,470
California:
$3,192
Total itemized deductions: $24,018 (35% of AGI, reported on 34.2% of returns)
Here:
$24,018
State:
$28,113
Here:
34.7% of AGI
State:
25.3% of AGI
(% of AGI for various income ranges: 11.5% for AGIs below $10k, 6.6% for AGIs $10k-25k, 21.6% for AGIs $25k-50k, 27.1% for AGIs $50k-75k, 27.3% for AGIs $75k-100k, 19.2% for AGIs over 100k)
Charity contributions deductions: $1,683 (2% of AGI, reported on 28.8% of returns)
Here:
$1,683
State:
$3,923
Here:
2.4% of AGI
State:
3.3% of AGI
(% of AGI for various income ranges: 0.3% for AGIs below $10k, 0.3% for AGIs $10k-25k, 0.8% for AGIs $25k-50k, 1.3% for AGIs $50k-75k, 1.7% for AGIs $75k-100k, 2.2% for AGIs over 100k)
Total tax: $4,634 (reported on 57.4% of returns)
93960:
$4,634
State:
$10,761
(% of AGI for various income ranges: 3.5% for AGIs below $10k, 2.1% for AGIs $10k-25k, 3.7% for AGIs $25k-50k, 5.4% for AGIs $50k-75k, 7.2% for AGIs $75k-100k, 15.9% for AGIs over 100k)
Earned income credit: $1,954 (reported on 26.1% of returns)
Here:
$1,954
State:
$1,763
Percentage of individuals using paid preparers for their 2004 taxes: 78.7%
Here:
79%
State:
66%
(% for various income ranges: 68.6% for AGIs below $10k, 80.9% for AGIs $10k-25k, 80.3% for AGIs $25k-50k, 81.0% for AGIs $50k-75k, 74.9% for AGIs $75k-100k, 85.1% for AGIs over 100k)
Household received Food Stamps/SNAP in the past 12 months: 789 Household did not receive Food Stamps/SNAP in the past 12 months: 4,033
Women who had a birth in the past 12 months: 175 (174 now married, 0 unmarried) Women who did not have a birth in the past 12 months: 4,833 (2,013 now married, 2,815 unmarried)
Housing units in zip code 93960 with a mortgage: 1,786 (141 second mortgage, 102 both second mortgage and home equity loan) Houses without a mortgage: 31
Median monthly owner costs for units with a mortgage: $2,238 Median monthly owner costs for units without a mortgage: $609
Residents with income below the poverty level in 2022:
This zip code:
18.8%
Whole state:
12.2%
Residents with income below 50% of the poverty level in 2022:
This zip code:
10.0%
Whole state:
6.2%
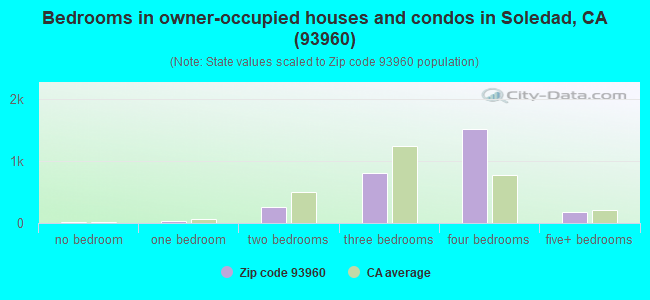
Median number of rooms in houses and condos:
Here:
5.9
State:
6.0
Median number of rooms in apartments:
Here:
4.7
State:
3.9
Notable locations in this zip code not listed on our city pages
Notable locations in zip code 93960: Hermits Cabin (A), Hicks Ranch (B), Smith and Hook Winery (C), Paul Masson Vineyards (D), Olson Ranch (E), Purd Camp (F), Vineyard of Mission Soledad (G), George Ranch (H), Gonzales Fire Station (I), Los Coches Substation (J), Soledad State Prison (K), Soledad Branch Monterey County Free Libraries (L), Los Coche Adobe (M), American Medical Response Soledad (N), Correctional Training Facility Fire Department (O), Department of Forestry and Fire Protection Gonzales Unit (P), Department of Forestry and Fire Protection Gabilan Unit (Q), Soledad Fire Department (R). Display/hide their locations on the map
3,300 married couples with children.
1,884 single-parent households (487 men, 1,397 women).
31.4% of residents of 93960 zip code speak English at home.
65.7% of residents speak Spanish at home (54% very well, 15% well, 16% not well, 15% not at all).
0.4% of residents speak other Indo-European language at home (90% very well, 9% well, 1% not well, 1% not at all).
1.8% of residents speak Asian or Pacific Island language at home (65% very well, 23% well, 6% not well, 5% not at all).
0.6% of residents speak other language at home (100% very well).
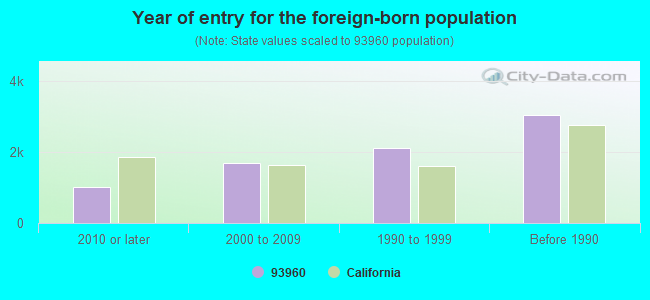
Foreign born population: 7,792 (30.2%) (19.3% of them are naturalized citizens)
This zip code:
30.2%
Whole state:
26.7%
84%Honduras
3%Costa Rica
2%Malaysia
2%Chile
2%El Salvador
1%Thailand
1%Serbia
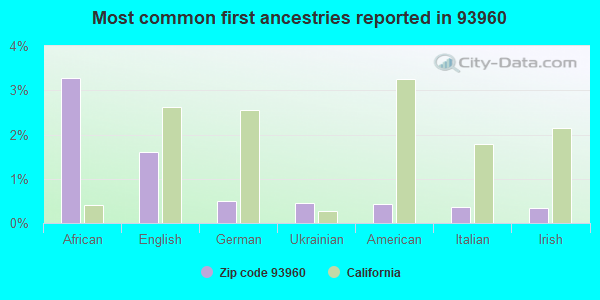
3%African
2%English
0%German
0%Ukrainian
0%American
0%Italian
0%Irish
Year of entry for the foreign-born population
1,0212010 or later
1,6772000 to 2009
2,1171990 to 1999
3,033Before 1990
Facilities with environmental interests located in this zip code:
GABILAN ELEMENTARY (330 N. WALKER DR. in SOLEDAD, CA)
(National Center for Education Statistics) - STATE ID-6105472 Organizations: SOLEDAD UNIFIED (SCHOOL DISTRICT)
MAIN STREET MIDDLE (441 MAIN ST. in SOLEDAD, CA)
(National Center for Education Statistics) - STATE ID-6026678 Organizations: SOLEDAD UNIFIED (SCHOOL DISTRICT)
CHALONE HIGH (690 MAIN ST. in SOLEDAD, CA)
(National Center for Education Statistics) - STATE ID-2730216 Organizations: SOLEDAD UNIFIED (SCHOOL DISTRICT)
MISSION ELEMENTARY (36825 FOOTHILL ROAD in SOLEDAD, CA)
(National Center for Education Statistics) - STATE ID-6026157 Organizations: MISSION UNION ELEMENTARY (SCHOOL DISTRICT)
CHALONE VINEYARDS (HWY 146 AND in SOLEDAD, CA)
Small Quantity Generators, between 100 kg and 1000 kg of hazardous waste/month (Resource Conservation and Recovery Act (tracking hazardous waste)) Organizations: DAN KARLSON (CONTACT/OPERATOR)
, CHALONE WINE GROUP (CONTACT/OWNER)
LEX ALLRED CHEVRON STATION (HIGHWAY 101 in SOLEDAD, CA)
CRITERIA AND HAZARDOUS AIR POLLUTANT INVENTORY (Inventory of air pollution sources) Business SIC classification: GASOLINE SERVICE STATIONS
TRI REPORTER (Tracking of toxic chemicals releasing facilities) Business SIC classification: GRAPES; WINES, BRANDY, AND BRANDY SPIRITS
GILBERT SHAW (1200 FRONT STREET in SOLEDAD, CA)
CRITERIA AND HAZARDOUS AIR POLLUTANT INVENTORY (Inventory of air pollution sources) Business SIC classification: GASOLINE SERVICE STATIONS
JACO HILL COMPANY (101 FRONT STREET in SOLEDAD, CA)
CRITERIA AND HAZARDOUS AIR POLLUTANT INVENTORY (Inventory of air pollution sources) Business SIC classification: GASOLINE SERVICE STATIONS
LASSENS MARKET (HIGHWAY 1 & SAN VICENTE in SOLEDAD, CA)
CRITERIA AND HAZARDOUS AIR POLLUTANT INVENTORY (Inventory of air pollution sources) Business SIC classification: GASOLINE SERVICE STATIONS
MO'S SOLEDAD TEXACO (1200 FRONT STREET in SOLEDAD, CA)
CRITERIA AND HAZARDOUS AIR POLLUTANT INVENTORY (Inventory of air pollution sources) Business SIC classification: GASOLINE SERVICE STATIONS
MODESTO GUTIERREZ (100 FRONT STREET in SOLEDAD, CA)
CRITERIA AND HAZARDOUS AIR POLLUTANT INVENTORY (Inventory of air pollution sources) Business SIC classification: GASOLINE SERVICE STATIONS
Housing units lacking complete plumbing facilities: 0.1% Housing units lacking complete kitchen facilities: 0.1%
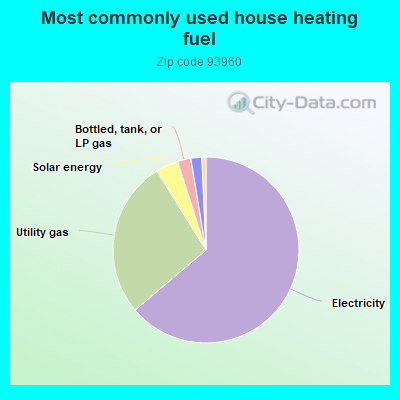
63.5%Electricity
27.2%Utility gas
3.9%Solar energy
2.3%Bottled, tank, or LP gas
1.9%No fuel used
0.7%Wood
Population in 1990: 9,046. Population change in the 1990s: +3,955 (+43.7%).
Place of birth for U.S.-born residents:
This state: 16,410
Northeast: 170
Midwest: 187
South: 630
West: 510
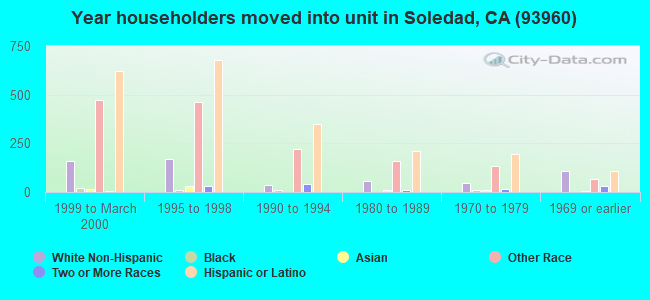
49% of the 93960 zip code residents lived in the same house 5 years ago. Out of people who lived in different houses, 83% lived in this county. Out of people who lived in different counties, 50% lived in California.
90% of the 93960 zip code residents lived in the same house 1 year ago. Out of people who lived in different houses, 15% moved from this county. Out of people who lived in different houses, 85% moved from different county within same state. Out of people who lived in different houses, 2% moved from different state. Out of people who lived in different houses, 0% moved from abroad.
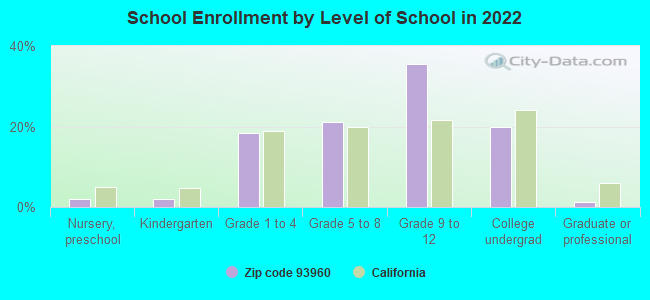
Private vs. public school enrollment:
Students in private schools in grades 1 to 8 (elementary and middle school): 99
Here:
3.1%
California:
10.5%
Students in private schools in grades 9 to 12 (high school): 307
Here:
10.7%
California:
8.5%
Students in private undergraduate colleges: 178
Here:
11.1%
California:
15.9%
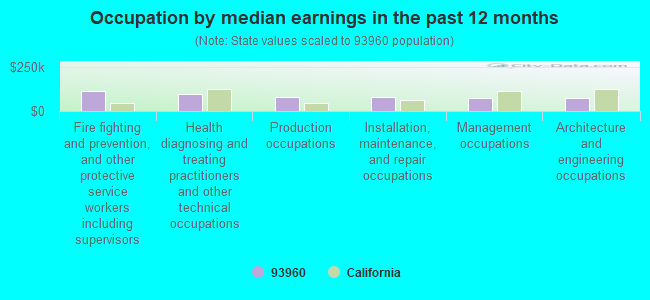
Occupation by median earnings in the past 12 months ($)
114,811Fire fighting and prevention, and other protective service workers including supervisors
98,381Health diagnosing and treating practitioners and other technical occupations
80,640Production occupations
76,856Installation, maintenance, and repair occupations
75,498Management occupations
71,867Architecture and engineering occupations
Top industries in this zip code by the number of employees in 2005:
2005 - 2018 National Fire Incident Reporting System (NFIRS) incidents
According to the data from the years 2005 - 2018 the average number of fire incidents per year is 58. The highest number of fires - 98 took place in 2008, and the least - 6 in 2005. The data has a rising trend.
When looking into fire subcategories, the most reports belonged to: Outside Fires (53.9%), and Structure Fires (26.2%).
Fire incident types reported to NFIRS in Zip Code 93960


+$1,190
-$7,562
 Nearest zip codes: 93926, 93927, 93925, 93924, 93920, 93928.
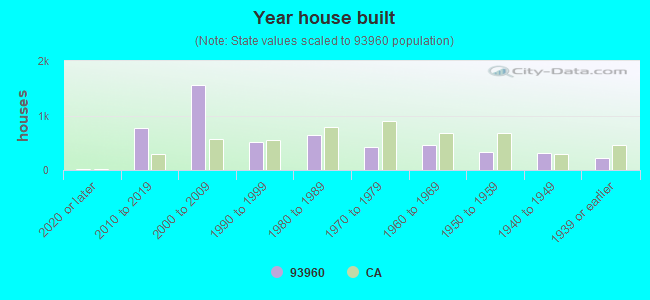


 According to the data from the years 2005 - 2018 the average number of fire incidents per year is 58. The highest number of fires - 98 took place in 2008, and the least - 6 in 2005. The data has a rising trend.
 When looking into fire subcategories, the most reports belonged to: Outside Fires (53.9%), and Structure Fires (26.2%).