Estimated zip code population in 2022: 11,729 Zip code population in 2010: 11,874 Zip code population in 2000: 9,775
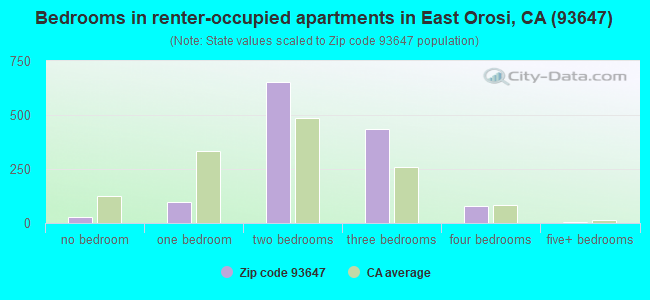
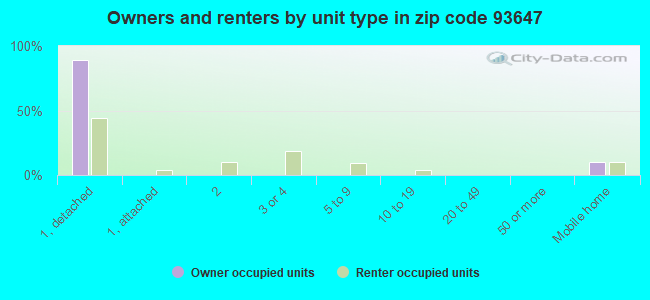
Houses and condos: 2,875 Renter-occupied apartments: 1,301
% of renters here:
47%
State:
44%
March 2022 cost of living index in zip code 93647: 88.0 (less than average, U.S. average is 100)
Land area: 106.9 sq. mi. Water area: 0.0 sq. mi.
Population density: 110 people per square mile
(very low).
OSM Map
General Map
Google Map
MSN Map
OSM Map
General Map
Google Map
MSN Map
OSM Map
General Map
Google Map
MSN Map
OSM Map
General Map
Google Map
MSN Map
Please wait while loading the map...
Real estate property taxes paid for housing units in 2022:
This zip code:
0.6% ($1,489)
California:
0.7% ($4,831)
Median real estate property taxes paid for housing units with mortgages in 2022: $1,506 (0.6%) Median real estate property taxes paid for housing units with no mortgage in 2022: $1,477 (0.8%)
Business Search- 14 Million verified businesses
Males: 5,826
(49.7%)
Females: 5,903
(50.3%)
For population 25 years and over in 93647:
High school or higher: 48.6%
Bachelor's degree or higher: 5.8%
Graduate or professional degree: 1.2%
Unemployed: 9.5%
Mean travel time to work (commute): 26.6 minutes
For population 15 years and over in 93647:
Never married: 41.9%
Now married: 43.3%
Separated: 3.7%
Widowed: 3.7%
Divorced: 7.4%
Zip code 93647 compared to state average:
Median household income below state average.
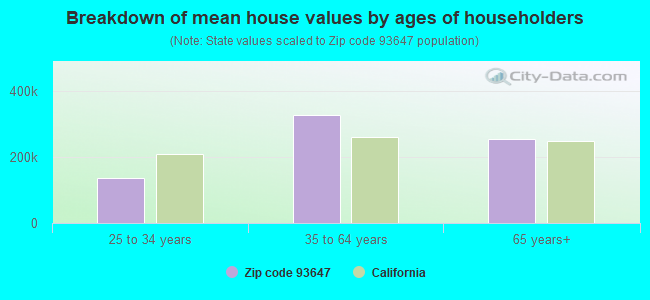
Median house value significantly below state average.
Unemployed percentage above state average.
Black race population percentage significantly below state average.
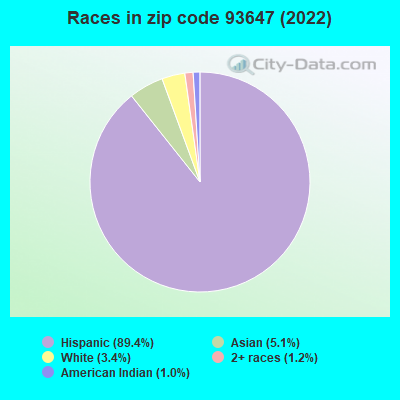
Hispanic race population percentage above state average.
Median age significantly below state average.
Foreign-born population percentage above state average.
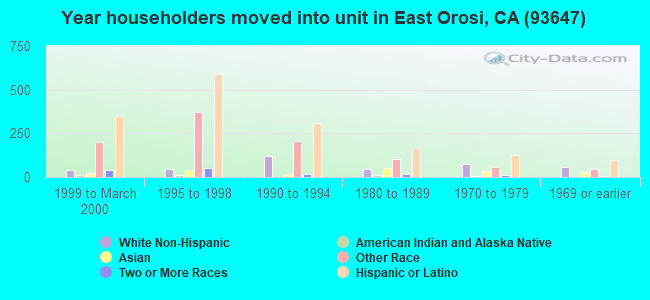
Length of stay since moving in significantly above state average.
Percentage of population with a bachelor's degree or higher significantly below state average.
Estimated median house/condo value in 2022: $242,470
93647:
$242,470
California:
$715,900
According to our research of California and other state lists, there were 11 registered sex offenders living in 93647 zip code as of June 01, 2024. The ratio of all residents to sex offenders in zip code 93647 is 1,034 to 1. The ratio of registered sex offenders to all residents in this zip code is lower than the state average.
Median resident age:
This zip code:
29.9 years
California median age:
37.9 years
Average household size:
This zip code:
4.2 people
California:
2.8 people
Averages for the 2020 tax year for zip code 93647, filed in 2021:
Average Adjusted Gross Income (AGI) in 2020: $32,996 (Individual Income Tax Returns)
Here:
$32,996
State:
$95,910
Salary/wage: $27,515 (reported on 91.0% of returns)
Here:
$27,515
State:
$77,331
(% of AGI for various income ranges: 1864.0% for AGIs below $25k, 4551.6% for AGIs $25k-50k, 8463.4% for AGIs $50k-75k, 11845.6% for AGIs $75k-100k, 26867.5% for AGIs $100k-200k)
Taxable interest for individuals: $485 (reported on 11.6% of returns)
This zip code:
$485
California:
$2,294
(% of AGI for various income ranges: 1.0% for AGIs below $25k, 1.2% for AGIs $25k-50k, 26.6% for AGIs $50k-75k, 13.3% for AGIs $75k-100k, 240.0% for AGIs $100k-200k)
Ordinary dividends: $4,157 (reported on 1.5% of returns)
Here:
$4,157
State:
$10,949
(% of AGI for various income ranges: 6.9% for AGIs $25k-50k, 545.0% for AGIs $100k-200k)
Net capital gain/loss in AGI: +$11,746 (reported on 2.8% of returns)
Here:
+$11,746
State:
+$49,306
(% of AGI for various income ranges: 0.2% for AGIs below $25k, 53.4% for AGIs $50k-75k, 3480.0% for AGIs $100k-200k)
Profit/loss from business: +$9,313 (reported on 8.4% of returns)
Here:
+$9,313
State:
+$15,671
(% of AGI for various income ranges: 89.7% for AGIs below $25k, 88.7% for AGIs $25k-50k, 265.2% for AGIs $50k-75k, 921.1% for AGIs $75k-100k)
Taxable individual retirement arrangement distribution: $8,140 (reported on 1.1% of returns)
93647:
$8,140
California:
$23,505
(% of AGI for various income ranges: 10.4% for AGIs below $25k, 96.6% for AGIs $50k-75k)
Total itemized deductions: $28,589 (reported on 1.9% of returns)
Here:
$28,589
State:
$39,517
(% of AGI for various income ranges: 542.1% for AGIs $50k-75k, 2502.5% for AGIs $100k-200k)
Charity contributions: $5,529 (reported on 1.5% of returns)
Here:
$5,529
State:
$12,598
(% of AGI for various income ranges: 60.0% for AGIs $50k-75k, 532.5% for AGIs $100k-200k)
Taxes paid: $7,278 (reported on 1.9% of returns)
93647:
$7,278
State:
$8,807
(% of AGI for various income ranges: 145.9% for AGIs $50k-75k, 580.0% for AGIs $100k-200k)
Earned income credit: $2,552 (reported on 33.6% of returns)
Here:
$2,552
State:
$2,074
(% of AGI for various income ranges: 193.9% for AGIs below $25k, 153.8% for AGIs $25k-50k, 3.8% for AGIs $50k-75k)
Percentage of individuals using paid preparers for their 2020 taxes: 91.6%
Here:
92%
State:
92%
(% for various income ranges: 90.5% for AGIs below $25k, 92.3% for AGIs $25k-50k, 94.1% for AGIs $50k-75k, 93.8% for AGIs $75k-100k, 90.0% for AGIs $100k-200k, 100.0% for AGIs over 200k)
Averages for the 2012 tax year for zip code 93647, filed in 2013:
Average Adjusted Gross Income (AGI) in 2012: $25,075 (Individual Income Tax Returns)
Here:
$25,075
State:
$72,726
Salary/wage: $21,603 (reported on 93.8% of returns)
Here:
$21,603
State:
$59,079
(% of AGI for various income ranges: 83.5% for AGIs below $25k, 86.6% for AGIs $25k-50k, 79.7% for AGIs $50k-75k, 77.4% for AGIs $75k-100k, 51.6% for AGIs $100k-200k)
Taxable interest for individuals: $797 (reported on 9.6% of returns)
This zip code:
$797
California:
$2,146
(% of AGI for various income ranges: 0.3% for AGIs $50k-75k, 0.5% for AGIs $75k-100k, 2.0% for AGIs $100k-200k)
Ordinary dividends: $1,786 (reported on 1.7% of returns)
Here:
$1,786
State:
$9,308
(% of AGI for various income ranges: 0.1% for AGIs $25k-50k, 0.4% for AGIs $100k-200k)
Net capital gain/loss in AGI: +$14,800 (reported on 1.2% of returns)
Here:
+$14,800
State:
+$30,460
Profit/loss from business: +$9,665 (reported on 7.6% of returns)
Here:
+$9,665
State:
+$17,064
(% of AGI for various income ranges: 3.8% for AGIs below $25k, 2.8% for AGIs $25k-50k, 1.2% for AGIs $50k-75k, 7.6% for AGIs $75k-100k)
Taxable individual retirement arrangement distribution: $7,320 (reported on 1.2% of returns)
93647:
$7,320
California:
$19,557
Total itemized deductions: $18,643 (31% of AGI, reported on 8.6% of returns)
Here:
$18,643
State:
$34,004
Here:
30.6% of AGI
State:
22.7% of AGI
(% of AGI for various income ranges: 2.0% for AGIs below $25k, 5.3% for AGIs $25k-50k, 10.9% for AGIs $50k-75k, 15.8% for AGIs $75k-100k, 17.2% for AGIs $100k-200k)
Charity contributions: $2,571 (reported on 6.9% of returns)
Here:
$2,571
State:
$4,659
(% of AGI for various income ranges: 0.5% for AGIs $25k-50k, 1.5% for AGIs $50k-75k, 2.3% for AGIs $75k-100k, 2.2% for AGIs $100k-200k)
Taxes paid: $5,054 (reported on 8.6% of returns)
93647:
$5,054
State:
$14,448
(% of AGI for various income ranges: 0.4% for AGIs below $25k, 1.3% for AGIs $25k-50k, 2.2% for AGIs $50k-75k, 4.9% for AGIs $75k-100k, 6.6% for AGIs $100k-200k)
Earned income credit: $2,698 (reported on 41.6% of returns)
Here:
$2,698
State:
$2,286
(% of AGI for various income ranges: 9.3% for AGIs below $25k, 2.9% for AGIs $25k-50k)
Percentage of individuals using paid preparers for their 2012 taxes: 77.6%
Here:
78%
State:
64%
(% for various income ranges: 76.4% for AGIs below $25k, 79.3% for AGIs $25k-50k, 75.0% for AGIs $50k-75k, 83.3% for AGIs $75k-100k, 100.0% for AGIs $100k-200k)
Averages for the 2004 tax year for zip code 93647, filed in 2005:
Average Adjusted Gross Income (AGI) in 2004: $22,554 (Individual Income Tax Returns)
Here:
$22,554
State:
$58,600
Salary/wage: $19,879 (reported on 92.7% of returns)
Here:
$19,879
State:
$49,455
(% of AGI for various income ranges: 125.0% for AGIs below $10k, 82.5% for AGIs $10k-25k, 85.2% for AGIs $25k-50k, 80.0% for AGIs $50k-75k, 73.5% for AGIs $75k-100k, 51.2% for AGIs over 100k)
Taxable interest for individuals: $1,204 (reported on 18.5% of returns)
This zip code:
$1,204
California:
$2,365
(% of AGI for various income ranges: 2.1% for AGIs below $10k, 0.4% for AGIs $10k-25k, 0.7% for AGIs $25k-50k, 1.3% for AGIs $50k-75k, 1.2% for AGIs $75k-100k, 3.3% for AGIs over 100k)
Taxable dividends: $3,701 (reported on 4.7% of returns)
Here:
$3,701
State:
$4,746
(% of AGI for various income ranges: 0.7% for AGIs below $10k, 0.3% for AGIs $10k-25k, 0.3% for AGIs $25k-50k, 1.0% for AGIs $50k-75k, 0.8% for AGIs $75k-100k, 4.6% for AGIs over 100k)
Net capital gain/loss: +$7,043 (reported on 4.5% of returns)
Here:
+$7,043
State:
+$23,418
(% of AGI for various income ranges: -0.4% for AGIs below $10k, 0.3% for AGIs $10k-25k, 1.1% for AGIs $25k-50k, 0.8% for AGIs $50k-75k, 0.6% for AGIs $75k-100k, 9.5% for AGIs over 100k)
Profit/loss from business: +$9,700 (reported on 8.1% of returns)
Here:
+$9,700
State:
+$16,826
(% of AGI for various income ranges: 11.6% for AGIs below $10k, 3.8% for AGIs $10k-25k, 4.2% for AGIs $25k-50k, 1.9% for AGIs $50k-75k, -0.2% for AGIs $75k-100k)
IRA payment deduction: $2,238 (reported on 0.7% of returns)
93647:
$2,238
California:
$3,192
Total itemized deductions: $15,637 (28% of AGI, reported on 10.8% of returns)
Here:
$15,637
State:
$28,113
Here:
28.3% of AGI
State:
25.3% of AGI
(% of AGI for various income ranges: 3.3% for AGIs $10k-25k, 7.7% for AGIs $25k-50k, 13.0% for AGIs $50k-75k, 12.1% for AGIs $75k-100k, 15.1% for AGIs over 100k)
Charity contributions deductions: $2,507 (4% of AGI, reported on 9.1% of returns)
Here:
$2,507
State:
$3,923
Here:
4.3% of AGI
State:
3.3% of AGI
(% of AGI for various income ranges: 0.3% for AGIs $10k-25k, 0.9% for AGIs $25k-50k, 2.0% for AGIs $50k-75k, 2.2% for AGIs $75k-100k, 2.5% for AGIs over 100k)
Total tax: $2,535 (reported on 43.5% of returns)
93647:
$2,535
State:
$10,761
(% of AGI for various income ranges: 2.0% for AGIs below $10k, 2.0% for AGIs $10k-25k, 3.7% for AGIs $25k-50k, 7.2% for AGIs $50k-75k, 11.3% for AGIs $75k-100k, 14.7% for AGIs over 100k)
Earned income credit: $2,126 (reported on 49.1% of returns)
Here:
$2,126
State:
$1,763
Percentage of individuals using paid preparers for their 2004 taxes: 80.7%
Here:
81%
State:
66%
(% for various income ranges: 74.9% for AGIs below $10k, 83.6% for AGIs $10k-25k, 81.0% for AGIs $25k-50k, 79.5% for AGIs $50k-75k, 72.9% for AGIs $75k-100k, 97.3% for AGIs over 100k)
Household received Food Stamps/SNAP in the past 12 months: 1,013 Household did not receive Food Stamps/SNAP in the past 12 months: 1,911
Women who had a birth in the past 12 months: 91 (8 now married, 84 unmarried) Women who did not have a birth in the past 12 months: 2,812 (1,107 now married, 1,705 unmarried)
Housing units in zip code 93647 with a mortgage: 1,100 (75 second mortgage, 37 home equity loan, 41 both second mortgage and home equity loan) Median monthly owner costs for units with a mortgage: $1,305 Median monthly owner costs for units without a mortgage: $468
Residents with income below the poverty level in 2022:
This zip code:
32.6%
Whole state:
12.2%
Residents with income below 50% of the poverty level in 2022:
This zip code:
21.4%
Whole state:
6.2%
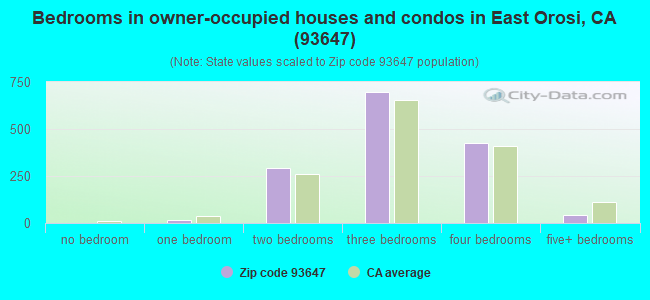
Median number of rooms in houses and condos:
Here:
5.4
State:
6.0
Median number of rooms in apartments:
Here:
4.3
State:
3.9
Notable locations in this zip code not listed on our city pages
Notable locations in zip code 93647: Stillwell Ranch (A), Moore Creek Ranch (B), Badger Fire Control Station (C), Dudley Ranch (D), Auckland Ranch (E), Orosi Branch Tulare County Library (F). Display/hide their locations on the map
Creeks: Buckeye Creek (A), Long Creek (B), Negro Creek (C), Persian Creek (D), Murry Creek (E), Story Creek (F), Indian Creek (G), Bull Creek (H), Rattlesnake Creek (I). Display/hide their locations on the map
Size of family households: 411 2-persons, 389 3-persons, 677 4-persons, 403 5-persons, 352 6-persons, 255 7-or-more-persons
Size of nonfamily households: 153 1-person, 46 2-persons, 52 4-persons
1,764 married couples with children.
1,337 single-parent households (241 men, 1,096 women).
17.6% of residents of 93647 zip code speak English at home.
78.5% of residents speak Spanish at home (51% very well, 15% well, 10% not well, 23% not at all).
0.1% of residents speak other Indo-European language at home (100% very well).
4.2% of residents speak Asian or Pacific Island language at home (44% very well, 40% well, 13% not well, 3% not at all).
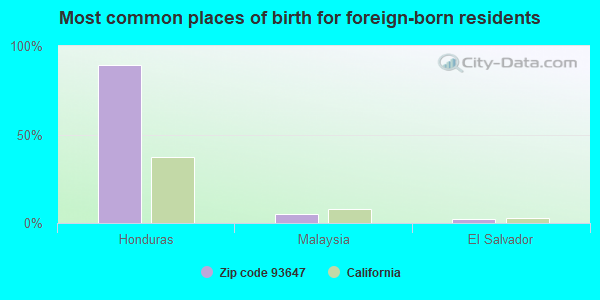
Foreign born population: 4,750 (40.5%) (23.3% of them are naturalized citizens)
This zip code:
40.5%
Whole state:
26.7%
89%Honduras
5%Malaysia
2%El Salvador
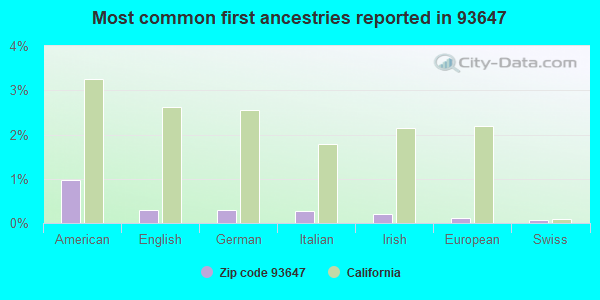
1%American
0%English
0%German
0%Italian
0%Irish
0%European
0%Swiss
Year of entry for the foreign-born population
7042010 or later
1,6062000 to 2009
1,1761990 to 1999
1,434Before 1990
Facilities with environmental interests located in this zip code:
EL MONTE ELEMENTARY (41465 ROAD 127 in OROSI, CA)
(National Center for Education Statistics) - STATE ID-6053912 Organizations: CUTLER-OROSI JOINT UNIFIED (SCHOOL DISTRICT)
EL MONTE JR. HIGH (41465 ROAD 127 in OROSI, CA)
(National Center for Education Statistics) - STATE ID-6118111 Organizations: CUTLER-OROSI JOINT UNIFIED (SCHOOL DISTRICT)
ESPERANZA HIGH (IND STUDY) (12724 AVE. 392 in OROSI, CA)
(National Center for Education Statistics) - STATE ID-5430095 Organizations: CUTLER-OROSI JOINT UNIFIED (SCHOOL DISTRICT)
GOLDEN VALLEY ELEMENTARY (42111 ROAD 128 in OROSI, CA)
(National Center for Education Statistics) - STATE ID-6112684 Organizations: CUTLER-OROSI JOINT UNIFIED (SCHOOL DISTRICT)
LOVELL HIGH (CONT.) (12724 AVE. 392 in OROSI, CA)
(National Center for Education Statistics) - STATE ID-5430806 Organizations: CUTLER-OROSI JOINT UNIFIED (SCHOOL DISTRICT)
FORMER PARMENTER & BRYAN PROPE (13133 AVE 416 in OROSI, CA)
Small Quantity Generators, between 100 kg and 1000 kg of hazardous waste/month (Resource Conservation and Recovery Act (tracking hazardous waste))
Housing units lacking complete plumbing facilities: 0.1% Housing units lacking complete kitchen facilities: 0.1%
54.4%Utility gas
36.1%Electricity
7.3%Bottled, tank, or LP gas
2.2%Wood
Population in 1990: 7,545. Population change in the 1990s: +2,230 (+29.6%).
Place of birth for U.S.-born residents:
This state: 6,552
Northeast: 31
Midwest: 37
South: 111
West: 74
57% of the 93647 zip code residents lived in the same house 5 years ago. Out of people who lived in different houses, 83% lived in this county. Out of people who lived in different counties, 50% lived in California.
96% of the 93647 zip code residents lived in the same house 1 year ago. Out of people who lived in different houses, 35% moved from this county. Out of people who lived in different houses, 63% moved from different county within same state. Out of people who lived in different houses, 12% moved from abroad.
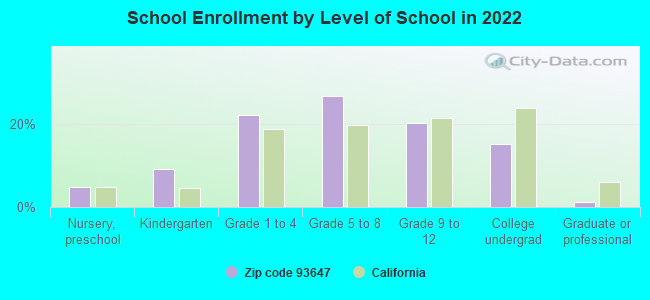
Private vs. public school enrollment:
Students in private schools in grades 1 to 8 (elementary and middle school): 78
Here:
4.6%
California:
10.5%
Students in private schools in grades 9 to 12 (high school): 20
Here:
2.9%
California:
8.5%
Students in private undergraduate colleges: 108
Here:
20.1%
California:
15.9%
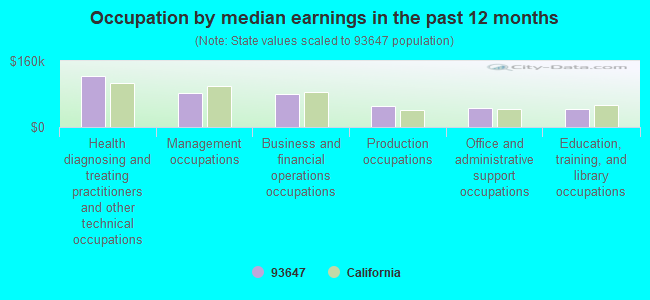
Occupation by median earnings in the past 12 months ($)
123,564Health diagnosing and treating practitioners and other technical occupations
82,867Management occupations
80,145Business and financial operations occupations
50,919Production occupations
46,319Office and administrative support occupations
43,477Education, training, and library occupations
Top industries in this zip code by the number of employees in 2005:
Wholesale Trade: Fresh Fruit and Vegetable Merchant Wholesalers (20-49 employees: 1 establishment, 5-9 employees: 1 establishment)
Construction: Poured Concrete Foundation and Structure Contractors (20-49: 1, 1-4: 1)
Health Care and Social Assistance: Offices of Dentists (20-49: 1, 1-4: 1)
Administrative and Support and Waste Management and Remediation Services: Solid Waste Collection (20-49: 1, 1-4: 1)
Construction: Electrical Contractors (20-49: 1)
Health Care and Social Assistance: Other Individual and Family Services (20-49: 1)
Accommodation and Food Services: Full-Service Restaurants (5-9: 1, 1-4: 4)
People in group quarters in 2000:
5 people in agriculture workers' dormitories on farms
4 people in unknown juvenile institutions
Fatal accident statistics in 2014:
Fatal accident count: 1
Vehicles involved in fatal accidents: 1
Fatal accidents caused by drunken drivers: 0
Fatalities: 1
Persons involved in fatal accidents: 1
Pedestrians involved in fatal accidents: 1
Fatal accident statistics in 2013:
Fatal accident count: 2
Vehicles involved in fatal accidents: 3
Fatal accidents caused by drunken drivers: 1
Fatalities: 2
Persons involved in fatal accidents: 6
Pedestrians involved in fatal accidents: 0
Home Mortgage Disclosure Act Aggregated Statistics For Year 2009 (Based on 2 full and 2 partial tracts)
A) FHA, FSA/RHS & VA Home Purchase Loans
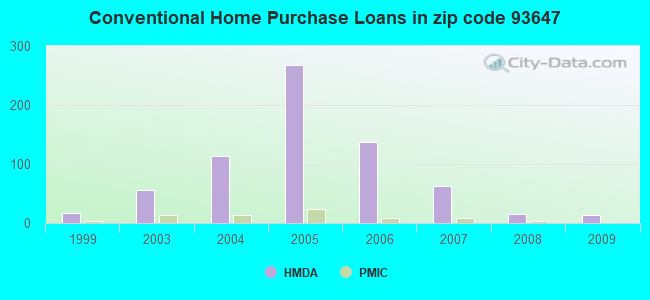
B) Conventional Home Purchase Loans
C) Refinancings
D) Home Improvement Loans
F) Non-occupant Loans on < 5 Family Dwellings (A B C & D)
Number
Average Value
Number
Average Value
Number
Average Value
Number
Average Value
Number
Average Value
LOANS ORIGINATED
42
$109,420
14
$115,229
48
$113,551
8
$99,750
6
$142,925
APPLICATIONS APPROVED, NOT ACCEPTED
2
$92,000
2
$38,000
15
$116,415
3
$86,710
2
$118,000
APPLICATIONS DENIED
0
$0
5
$86,822
46
$127,855
12
$100,572
5
$88,362
APPLICATIONS WITHDRAWN
4
$144,500
2
$38,000
11
$132,048
0
$0
2
$30,000
FILES CLOSED FOR INCOMPLETENESS
0
$0
2
$99,000
11
$144,296
0
$0
0
$0
Aggregated Statistics For Year 2008 (Based on 2 full and 2 partial tracts)
A) FHA, FSA/RHS & VA Home Purchase Loans
B) Conventional Home Purchase Loans
C) Refinancings
D) Home Improvement Loans
F) Non-occupant Loans on < 5 Family Dwellings (A B C & D)
G) Loans On Manufactured Home Dwelling (A B C & D)
Number
Average Value
Number
Average Value
Number
Average Value
Number
Average Value
Number
Average Value
Number
Average Value
LOANS ORIGINATED
14
$193,714
16
$123,304
101
$131,422
14
$127,312
15
$98,867
2
$190,000
APPLICATIONS APPROVED, NOT ACCEPTED
0
$0
11
$112,036
41
$119,668
8
$105,000
5
$129,680
4
$53,500
APPLICATIONS DENIED
7
$161,311
25
$139,168
187
$163,058
40
$107,176
19
$119,471
5
$159,684
APPLICATIONS WITHDRAWN
0
$0
0
$0
42
$156,596
5
$84,960
5
$114,080
0
$0
FILES CLOSED FOR INCOMPLETENESS
3
$240,393
7
$236,499
16
$142,375
4
$66,500
2
$156,000
0
$0
Aggregated Statistics For Year 2007 (Based on 2 full and 2 partial tracts)
B) Conventional Home Purchase Loans
C) Refinancings
D) Home Improvement Loans
F) Non-occupant Loans on < 5 Family Dwellings (A B C & D)
G) Loans On Manufactured Home Dwelling (A B C & D)
Number
Average Value
Number
Average Value
Number
Average Value
Number
Average Value
Number
Average Value
LOANS ORIGINATED
62
$164,518
289
$154,488
57
$109,266
46
$151,816
1
$140,300
APPLICATIONS APPROVED, NOT ACCEPTED
20
$158,482
121
$135,686
19
$83,811
12
$145,667
4
$59,500
APPLICATIONS DENIED
47
$194,031
272
$164,359
50
$94,556
28
$146,271
10
$72,800
APPLICATIONS WITHDRAWN
16
$185,921
125
$167,572
13
$148,185
10
$142,400
0
$0
FILES CLOSED FOR INCOMPLETENESS
9
$256,533
32
$146,307
6
$142,333
0
$0
1
$94,800
Aggregated Statistics For Year 2006 (Based on 2 full and 2 partial tracts)
A) FHA, FSA/RHS & VA Home Purchase Loans
B) Conventional Home Purchase Loans
C) Refinancings
D) Home Improvement Loans
F) Non-occupant Loans on < 5 Family Dwellings (A B C & D)
G) Loans On Manufactured Home Dwelling (A B C & D)
Number
Average Value
Number
Average Value
Number
Average Value
Number
Average Value
Number
Average Value
Number
Average Value
LOANS ORIGINATED
2
$187,000
138
$139,143
472
$142,331
52
$97,086
64
$137,304
3
$177,280
APPLICATIONS APPROVED, NOT ACCEPTED
2
$217,000
68
$153,090
99
$157,806
17
$137,189
17
$139,784
2
$132,000
APPLICATIONS DENIED
2
$135,000
81
$136,930
328
$155,139
77
$87,627
39
$151,995
11
$73,629
APPLICATIONS WITHDRAWN
0
$0
50
$135,242
257
$147,540
13
$88,183
23
$115,841
3
$61,413
FILES CLOSED FOR INCOMPLETENESS
0
$0
8
$112,010
49
$149,594
0
$0
5
$127,604
0
$0
Aggregated Statistics For Year 2005 (Based on 2 full and 2 partial tracts)
A) FHA, FSA/RHS & VA Home Purchase Loans
B) Conventional Home Purchase Loans
C) Refinancings
D) Home Improvement Loans
F) Non-occupant Loans on < 5 Family Dwellings (A B C & D)
G) Loans On Manufactured Home Dwelling (A B C & D)
Number
Average Value
Number
Average Value
Number
Average Value
Number
Average Value
Number
Average Value
Number
Average Value
LOANS ORIGINATED
49
$129,409
267
$109,550
366
$114,465
50
$77,651
48
$114,292
9
$91,650
APPLICATIONS APPROVED, NOT ACCEPTED
0
$0
56
$121,071
92
$106,983
9
$45,247
19
$121,262
4
$76,500
APPLICATIONS DENIED
6
$136,000
77
$120,360
279
$119,987
57
$75,720
23
$145,846
5
$88,122
APPLICATIONS WITHDRAWN
0
$0
84
$120,585
296
$125,403
24
$114,235
26
$113,846
1
$159,260
FILES CLOSED FOR INCOMPLETENESS
0
$0
6
$104,000
59
$111,198
0
$0
0
$0
0
$0
Aggregated Statistics For Year 2004 (Based on 2 full and 2 partial tracts)
A) FHA, FSA/RHS & VA Home Purchase Loans
B) Conventional Home Purchase Loans
C) Refinancings
D) Home Improvement Loans
F) Non-occupant Loans on < 5 Family Dwellings (A B C & D)
G) Loans On Manufactured Home Dwelling (A B C & D)
Number
Average Value
Number
Average Value
Number
Average Value
Number
Average Value
Number
Average Value
Number
Average Value
LOANS ORIGINATED
18
$104,556
114
$80,443
362
$100,089
32
$43,428
40
$85,978
3
$96,063
APPLICATIONS APPROVED, NOT ACCEPTED
2
$104,000
42
$99,528
123
$102,919
4
$101,000
10
$94,794
1
$18,960
APPLICATIONS DENIED
0
$0
79
$112,176
316
$100,518
51
$79,633
19
$106,975
4
$84,372
APPLICATIONS WITHDRAWN
6
$87,333
53
$106,369
265
$103,360
12
$93,407
9
$144,192
1
$146,620
FILES CLOSED FOR INCOMPLETENESS
0
$0
1
$520,770
56
$94,375
4
$60,000
2
$95,000
2
$67,000
Aggregated Statistics For Year 2003 (Based on 2 full and 2 partial tracts)
A) FHA, FSA/RHS & VA Home Purchase Loans
B) Conventional Home Purchase Loans
C) Refinancings
D) Home Improvement Loans
E) Loans on Dwellings For 5+ Families
F) Non-occupant Loans on < 5 Family Dwellings (A B C & D)
Number
Average Value
Number
Average Value
Number
Average Value
Number
Average Value
Number
Average Value
Number
Average Value
LOANS ORIGINATED
85
$98,320
56
$84,732
304
$84,398
10
$13,800
2
$742,000
50
$77,314
APPLICATIONS APPROVED, NOT ACCEPTED
1
$82,160
10
$113,934
58
$90,337
5
$20,260
0
$0
9
$84,291
APPLICATIONS DENIED
4
$109,000
38
$81,102
294
$88,808
11
$28,773
0
$0
31
$80,425
APPLICATIONS WITHDRAWN
2
$80,000
11
$78,841
191
$108,498
4
$33,500
0
$0
10
$124,000
FILES CLOSED FOR INCOMPLETENESS
0
$0
3
$123,660
29
$78,426
3
$29,493
0
$0
2
$65,000
Aggregated Statistics For Year 1999 (Based on 1 partial tract)
A) FHA, FSA/RHS & VA Home Purchase Loans
B) Conventional Home Purchase Loans
C) Refinancings
D) Home Improvement Loans
F) Non-occupant Loans on < 5 Family Dwellings (A B C & D)
Detailed PMIC statistics for the following Tracts:0002.01
, 0002.02
2005 - 2018 National Fire Incident Reporting System (NFIRS) incidents
Based on the data from the years 2005 - 2018 the average number of fires per year is 29. The highest number of fire incidents - 77 took place in 2017, and the least - 3 in 2009. The data has a rising trend.
When looking into fire subcategories, the most reports belonged to: Outside Fires (60.1%), and Structure Fires (19.6%).
Fire incident types reported to NFIRS in Zip Code 93647

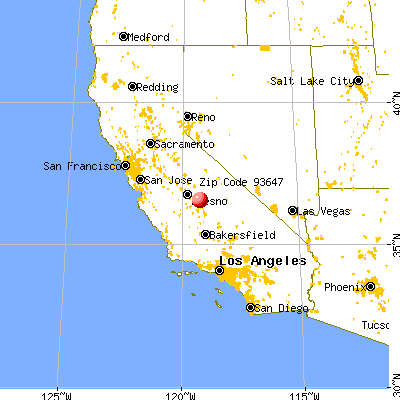


 Nearest zip codes: 93646, 93675, 93615, 93286, 93666, 93641.


 Based on the data from the years 2005 - 2018 the average number of fires per year is 29. The highest number of fire incidents - 77 took place in 2017, and the least - 3 in 2009. The data has a rising trend.
 When looking into fire subcategories, the most reports belonged to: Outside Fires (60.1%), and Structure Fires (19.6%).