Estimated zip code population in 2022: 12,960 Zip code population in 2010: 12,995 Zip code population in 2000: 13,557
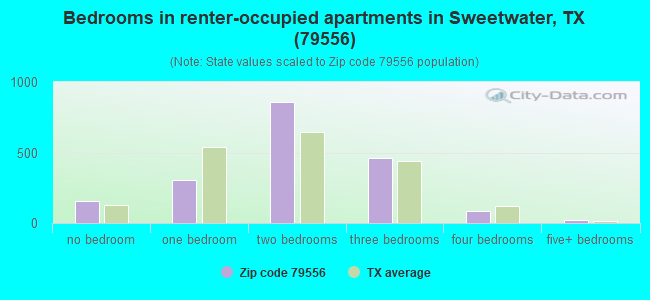
Houses and condos: 6,360 Renter-occupied apartments: 1,888
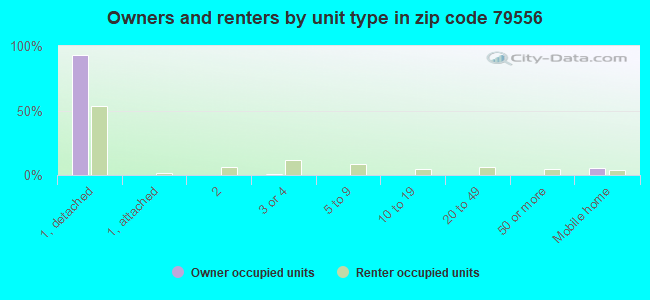
% of renters here:
37%
State:
38%
March 2022 cost of living index in zip code 79556: 76.6 (low, U.S. average is 100)
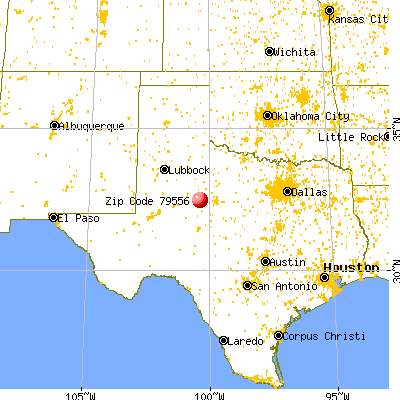
Land area: 304.2 sq. mi. Water area: 1.9 sq. mi.
Population density: 43 people per square mile
(very low).
OSM Map
General Map
Google Map
MSN Map
OSM Map
General Map
Google Map
MSN Map
OSM Map
General Map
Google Map
MSN Map
OSM Map
General Map
Google Map
MSN Map
Please wait while loading the map...
Real estate property taxes paid for housing units in 2022:
This zip code:
1.4% ($1,473)
Texas:
1.5% ($4,050)
Median real estate property taxes paid for housing units with mortgages in 2022: $2,398 (1.7%) Median real estate property taxes paid for housing units with no mortgage in 2022: $1,029 (1.1%)
Averages for the 2020 tax year for zip code 79556, filed in 2021:
Average Adjusted Gross Income (AGI) in 2020: $52,901 (Individual Income Tax Returns)
Here:
$52,901
State:
$77,054
Salary/wage: $44,774 (reported on 85.0% of returns)
Here:
$44,774
State:
$62,766
(% of AGI for various income ranges: 1266.5% for AGIs below $25k, 3453.4% for AGIs $25k-50k, 6554.0% for AGIs $50k-75k, 9759.7% for AGIs $75k-100k, 15711.5% for AGIs $100k-200k, 61510.0% for AGIs over 200k)
Taxable interest for individuals: $1,619 (reported on 16.1% of returns)
This zip code:
$1,619
Texas:
$2,665
(% of AGI for various income ranges: 8.9% for AGIs below $25k, 9.3% for AGIs $25k-50k, 14.3% for AGIs $50k-75k, 42.9% for AGIs $75k-100k, 63.0% for AGIs $100k-200k, 2290.0% for AGIs over 200k)
Ordinary dividends: $5,631 (reported on 10.2% of returns)
Here:
$5,631
State:
$10,044
(% of AGI for various income ranges: 11.4% for AGIs below $25k, 13.4% for AGIs $25k-50k, 56.8% for AGIs $50k-75k, 82.1% for AGIs $75k-100k, 272.4% for AGIs $100k-200k, 3960.0% for AGIs over 200k)
Net capital gain/loss in AGI: +$12,570 (reported on 10.2% of returns)
Here:
+$12,570
State:
+$39,590
(% of AGI for various income ranges: 11.0% for AGIs below $25k, 13.7% for AGIs $25k-50k, 100.2% for AGIs $50k-75k, 101.8% for AGIs $75k-100k, 613.0% for AGIs $100k-200k, 11620.0% for AGIs over 200k)
Profit/loss from business: +$10,117 (reported on 14.6% of returns)
Here:
+$10,117
State:
+$10,888
(% of AGI for various income ranges: 61.7% for AGIs below $25k, 40.0% for AGIs $50k-75k, 122.1% for AGIs $75k-100k, 362.1% for AGIs $100k-200k, 16493.3% for AGIs over 200k)
Taxable individual retirement arrangement distribution: $22,103 (reported on 7.0% of returns)
79556:
$22,103
Texas:
$24,740
(% of AGI for various income ranges: 39.9% for AGIs below $25k, 76.4% for AGIs $25k-50k, 204.7% for AGIs $50k-75k, 347.1% for AGIs $75k-100k, 773.9% for AGIs $100k-200k, 5760.0% for AGIs over 200k)
Self-employed (Keogh) retirement plans: $26,750 (reported on 0.4% of returns)
79556:
$26,750
Texas:
$29,298
(% of AGI for various income ranges: 162.1% for AGIs $100k-200k)
Total itemized deductions: $36,662 (reported on 3.0% of returns)
Here:
$36,662
State:
$40,428
(% of AGI for various income ranges: 42.3% for AGIs below $25k, 123.8% for AGIs $50k-75k, 190.6% for AGIs $75k-100k, 504.8% for AGIs $100k-200k, 6996.7% for AGIs over 200k)
Charity contributions: $16,175 (reported on 2.3% of returns)
Here:
$16,175
State:
$18,201
(% of AGI for various income ranges: 53.3% for AGIs $50k-75k, 172.7% for AGIs $100k-200k, 3503.3% for AGIs over 200k)
Taxes paid: $6,267 (reported on 2.8% of returns)
79556:
$6,267
State:
$7,821
(% of AGI for various income ranges: 5.8% for AGIs below $25k, 12.5% for AGIs $50k-75k, 30.9% for AGIs $75k-100k, 68.2% for AGIs $100k-200k, 1456.7% for AGIs over 200k)
Earned income credit: $2,726 (reported on 25.6% of returns)
Here:
$2,726
State:
$2,584
(% of AGI for various income ranges: 156.2% for AGIs below $25k, 97.6% for AGIs $25k-50k, 2.0% for AGIs $50k-75k)
Percentage of individuals using paid preparers for their 2020 taxes: 95.1%
Here:
95%
State:
92%
(% for various income ranges: 94.8% for AGIs below $25k, 95.2% for AGIs $25k-50k, 94.9% for AGIs $50k-75k, 95.8% for AGIs $75k-100k, 94.3% for AGIs $100k-200k, 100.0% for AGIs over 200k)
Averages for the 2012 tax year for zip code 79556, filed in 2013:
Average Adjusted Gross Income (AGI) in 2012: $48,407 (Individual Income Tax Returns)
Here:
$48,407
State:
$65,384
Salary/wage: $36,677 (reported on 85.9% of returns)
Here:
$36,677
State:
$52,524
(% of AGI for various income ranges: 81.4% for AGIs below $25k, 83.2% for AGIs $25k-50k, 83.1% for AGIs $50k-75k, 73.1% for AGIs $75k-100k, 65.7% for AGIs $100k-200k, 21.5% for AGIs over 200k)
Taxable interest for individuals: $1,590 (reported on 18.4% of returns)
This zip code:
$1,590
Texas:
$2,372
(% of AGI for various income ranges: 0.6% for AGIs below $25k, 0.4% for AGIs $25k-50k, 0.6% for AGIs $50k-75k, 0.5% for AGIs $75k-100k, 0.6% for AGIs $100k-200k, 0.9% for AGIs over 200k)
Ordinary dividends: $6,752 (reported on 11.1% of returns)
Here:
$6,752
State:
$9,721
(% of AGI for various income ranges: 1.0% for AGIs below $25k, 0.8% for AGIs $25k-50k, 0.6% for AGIs $50k-75k, 0.8% for AGIs $75k-100k, 1.4% for AGIs $100k-200k, 3.8% for AGIs over 200k)
Net capital gain/loss in AGI: +$8,969 (reported on 9.9% of returns)
Here:
+$8,969
State:
+$35,319
(% of AGI for various income ranges: 0.2% for AGIs below $25k, 0.4% for AGIs $25k-50k, 0.4% for AGIs $50k-75k, 0.9% for AGIs $75k-100k, 1.3% for AGIs $100k-200k, 6.0% for AGIs over 200k)
Profit/loss from business: +$12,423 (reported on 16.6% of returns)
Here:
+$12,423
State:
+$13,732
(% of AGI for various income ranges: 6.1% for AGIs below $25k, 1.7% for AGIs $25k-50k, 1.8% for AGIs $50k-75k, 3.5% for AGIs $75k-100k, 4.6% for AGIs $100k-200k, 7.5% for AGIs over 200k)
Taxable individual retirement arrangement distribution: $14,282 (reported on 7.3% of returns)
79556:
$14,282
Texas:
$19,511
(% of AGI for various income ranges: 1.8% for AGIs below $25k, 2.1% for AGIs $25k-50k, 1.8% for AGIs $50k-75k, 2.5% for AGIs $75k-100k, 3.3% for AGIs $100k-200k, 1.5% for AGIs over 200k)
Self-employment retirement plans: $16,933 (reported on 0.5% of returns)
79556:
$16,933
Texas:
$23,938
(% of AGI for various income ranges: 0.9% for AGIs over 200k)
Total itemized deductions: $23,663 (17% of AGI, reported on 10.9% of returns)
Here:
$23,663
State:
$24,724
Here:
16.9% of AGI
State:
15.9% of AGI
(% of AGI for various income ranges: 2.8% for AGIs below $25k, 3.8% for AGIs $25k-50k, 4.0% for AGIs $50k-75k, 6.1% for AGIs $75k-100k, 6.7% for AGIs $100k-200k, 7.6% for AGIs over 200k)
Charity contributions: $9,154 (reported on 7.5% of returns)
Here:
$9,154
State:
$6,808
(% of AGI for various income ranges: 0.2% for AGIs below $25k, 0.7% for AGIs $25k-50k, 0.6% for AGIs $50k-75k, 1.6% for AGIs $75k-100k, 2.0% for AGIs $100k-200k, 2.7% for AGIs over 200k)
Taxes paid: $4,769 (reported on 10.8% of returns)
79556:
$4,769
State:
$6,921
(% of AGI for various income ranges: 0.4% for AGIs below $25k, 0.5% for AGIs $25k-50k, 0.7% for AGIs $50k-75k, 1.0% for AGIs $75k-100k, 1.6% for AGIs $100k-200k, 1.7% for AGIs over 200k)
Earned income credit: $2,597 (reported on 29.0% of returns)
Here:
$2,597
State:
$2,570
(% of AGI for various income ranges: 10.6% for AGIs below $25k, 1.7% for AGIs $25k-50k)
Percentage of individuals using paid preparers for their 2012 taxes: 61.3%
Here:
61%
State:
51%
(% for various income ranges: 59.2% for AGIs below $25k, 60.0% for AGIs $25k-50k, 58.7% for AGIs $50k-75k, 64.1% for AGIs $75k-100k, 70.3% for AGIs $100k-200k, 100.0% for AGIs over 200k)
Averages for the 2004 tax year for zip code 79556, filed in 2005:
Average Adjusted Gross Income (AGI) in 2004: $32,058 (Individual Income Tax Returns)
Here:
$32,058
State:
$47,881
Salary/wage: $27,533 (reported on 83.3% of returns)
Here:
$27,533
State:
$41,947
(% of AGI for various income ranges: 121.3% for AGIs below $10k, 79.0% for AGIs $10k-25k, 82.4% for AGIs $25k-50k, 78.1% for AGIs $50k-75k, 74.3% for AGIs $75k-100k, 38.6% for AGIs over 100k)
Taxable interest for individuals: $2,106 (reported on 28.2% of returns)
This zip code:
$2,106
Texas:
$2,255
(% of AGI for various income ranges: 5.1% for AGIs below $10k, 2.2% for AGIs $10k-25k, 1.7% for AGIs $25k-50k, 1.3% for AGIs $50k-75k, 1.4% for AGIs $75k-100k, 2.2% for AGIs over 100k)
Taxable dividends: $3,413 (reported on 14.4% of returns)
Here:
$3,413
State:
$4,261
(% of AGI for various income ranges: 2.5% for AGIs below $10k, 0.9% for AGIs $10k-25k, 0.8% for AGIs $25k-50k, 1.0% for AGIs $50k-75k, 1.8% for AGIs $75k-100k, 3.1% for AGIs over 100k)
Net capital gain/loss: +$4,097 (reported on 13.1% of returns)
Here:
+$4,097
State:
+$16,110
(% of AGI for various income ranges: -0.4% for AGIs below $10k, 0.2% for AGIs $10k-25k, 0.2% for AGIs $25k-50k, 0.4% for AGIs $50k-75k, 3.1% for AGIs $75k-100k, 5.2% for AGIs over 100k)
Profit/loss from business: +$11,558 (reported on 16.4% of returns)
Here:
+$11,558
State:
+$11,013
(% of AGI for various income ranges: 7.5% for AGIs below $10k, 4.5% for AGIs $10k-25k, 2.9% for AGIs $25k-50k, 3.8% for AGIs $50k-75k, 4.7% for AGIs $75k-100k, 13.0% for AGIs over 100k)
IRA payment deduction: $3,653 (reported on 1.9% of returns)
79556:
$3,653
Texas:
$3,120
(% of AGI for various income ranges: 0.1% for AGIs $10k-25k, 0.2% for AGIs $25k-50k, 0.2% for AGIs $50k-75k, 0.3% for AGIs $75k-100k, 0.3% for AGIs over 100k)
Self-employed pension: $6,133 (reported on 0.3% of returns)
Here:
$6,133
Texas:
$16,401
Total itemized deductions: $16,682 (22% of AGI, reported on 11.9% of returns)
Here:
$16,682
State:
$19,631
Here:
22.3% of AGI
State:
18.9% of AGI
(% of AGI for various income ranges: 5.9% for AGIs below $10k, 4.1% for AGIs $10k-25k, 6.0% for AGIs $25k-50k, 6.2% for AGIs $50k-75k, 8.7% for AGIs $75k-100k, 6.7% for AGIs over 100k)
Charity contributions deductions: $5,222 (6% of AGI, reported on 9.2% of returns)
Here:
$5,222
State:
$4,753
Here:
6.3% of AGI
State:
4.2% of AGI
(% of AGI for various income ranges: 0.5% for AGIs below $10k, 0.5% for AGIs $10k-25k, 1.0% for AGIs $25k-50k, 1.4% for AGIs $50k-75k, 2.2% for AGIs $75k-100k, 2.8% for AGIs over 100k)
Total tax: $5,297 (reported on 63.1% of returns)
79556:
$5,297
State:
$9,058
(% of AGI for various income ranges: 3.3% for AGIs below $10k, 3.1% for AGIs $10k-25k, 6.2% for AGIs $25k-50k, 9.0% for AGIs $50k-75k, 11.2% for AGIs $75k-100k, 22.8% for AGIs over 100k)
Earned income credit: $1,986 (reported on 29.8% of returns)
Here:
$1,986
State:
$2,024
Percentage of individuals using paid preparers for their 2004 taxes: 71.9%
Here:
72%
State:
57%
(% for various income ranges: 69.9% for AGIs below $10k, 74.5% for AGIs $10k-25k, 70.9% for AGIs $25k-50k, 69.9% for AGIs $50k-75k, 66.2% for AGIs $75k-100k, 84.0% for AGIs over 100k)
Likely homosexual households (counted as self-reported same-sex unmarried-partner households)
Lesbian couples: 0.4% of all households
Gay men: 0.0% of all households
Household received Food Stamps/SNAP in the past 12 months: 1,076 Household did not receive Food Stamps/SNAP in the past 12 months: 4,085
Women who had a birth in the past 12 months: 177 (104 now married, 72 unmarried) Women who did not have a birth in the past 12 months: 2,313 (1,145 now married, 1,164 unmarried)
Housing units in zip code 79556 with a mortgage: 1,004 (53 second mortgage, 6 home equity loan, 50 both second mortgage and home equity loan) Median monthly owner costs for units with a mortgage: $1,373 Median monthly owner costs for units without a mortgage: $510
Residents with income below the poverty level in 2022:
This zip code:
16.0%
Whole state:
14.0%
Residents with income below 50% of the poverty level in 2022:
This zip code:
9.5%
Whole state:
7.4%
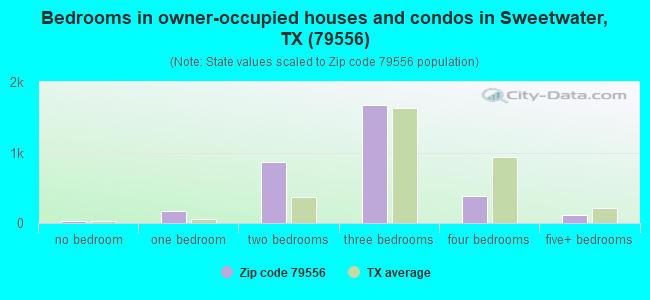
Median number of rooms in houses and condos:
Here:
5.7
State:
6.3
Median number of rooms in apartments:
Here:
4.4
State:
4.0
Notable locations in this zip code not listed on our city pages
Notable locations in zip code 79556: Tecific (A), Double Heart Ranch (B), Sweetwater Commercial Historic District (C), First National Bank Building (D), Lake Sweetwater Volunteer Fire Department (E), Pioneer Museum (F), Sweetwater Fire Department (G), R A Ragland Building (H). Display/hide their locations on the map
Churches in zip code 79556 include: Highland Heights United Methodist Church (A), Evangelical Methodist Church (B), Faith Lutheran Church (C), Saint Stephens Episcopal Church (D), Church of God of Prophecy (E), Church of Christ (F), Trinity Baptist Church (G), Highland Baptist Church (H), Greater Zion Baptist Church (I). Display/hide their locations on the map
Reservoirs: Willow Tank (A), Lake Sweetwater (B), Boothe Lake (C), Santa Fe Lake (D), Nolan Divide Lake (E), Lake Trammell (F), Country Club Lake (G), Headrick Lake (H). Display/hide their locations on the map
Streams, rivers, and creeks: Town Creek (A), Salt Branch (B), Rough Creek (C), Rock Creek (D), Prong Creek (E), Dulaney Creek (F), Finn Creek (G), Holder Creek (H), Idlewild Creek (I). Display/hide their locations on the map
Parks in zip code 79556 include: Lake Sweetwater Municipal Park (1), Santa Fe Park (2), Fraley Park (3), Sweetwater Park (4), Newman Park (5), Rolling Plains Girls Softball Park (6), Mustang Bowl (7). Display/hide their locations on the map
1,798 married couples with children.
978 single-parent households (263 men, 715 women).
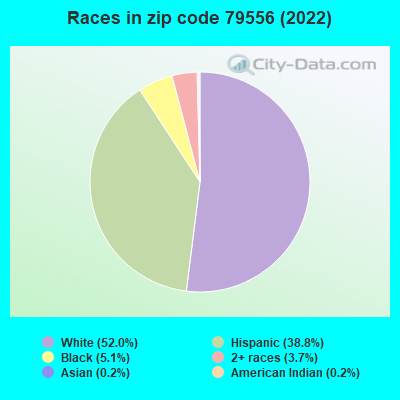
76.2% of residents of 79556 zip code speak English at home.
23.3% of residents speak Spanish at home (77% very well, 13% well, 6% not well, 4% not at all).
0.8% of residents speak other Indo-European language at home (67% very well, 33% well).
0.2% of residents speak Asian or Pacific Island language at home (52% very well, 19% well, 29% not well).
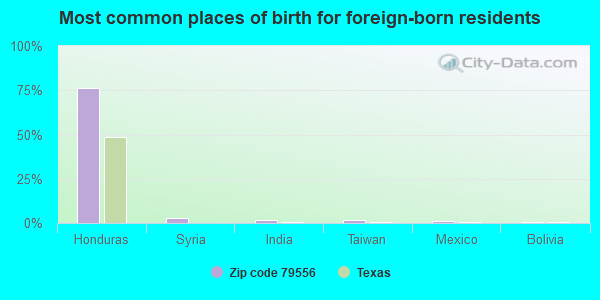
Foreign born population: 601 (4.6%) (48.6% of them are naturalized citizens)
This zip code:
4.6%
Whole state:
17.2%
77%Honduras
3%Syria
2%India
2%Taiwan
1%Mexico
1%Bolivia
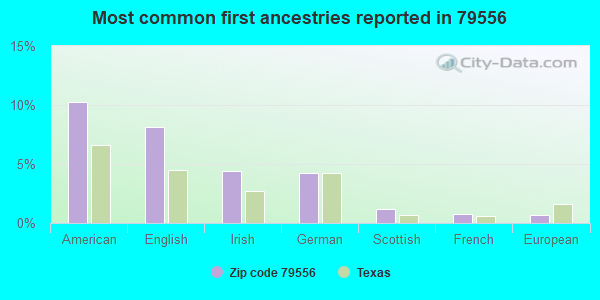
10%American
8%English
4%Irish
4%German
1%Scottish
1%French
1%European
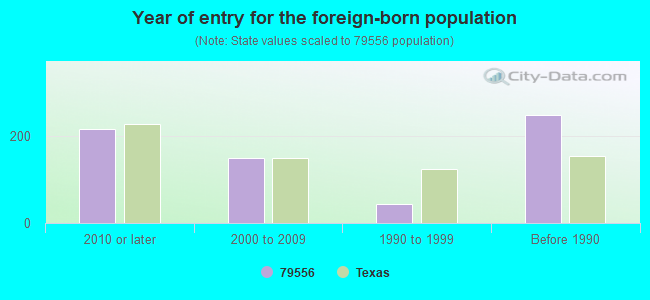
Year of entry for the foreign-born population
2162010 or later
1502000 to 2009
441990 to 1999
249Before 1990
Facilities with environmental interests located in this zip code:
7 11 AUTO SUPPLY (207 W BROADWAY in SWEETWATER, TX)
(Resource Conservation and Recovery Act (tracking hazardous waste)) Business NAICS classification: ALL OTHER AUTOMOTIVE REPAIR AND MAINTENANCE. Alternative names: 7-11 AUTO
A & A AIRCRAFT & REFINISHING (421 COLLEGE DR in SWEETWATER, TX)
(Resource Conservation and Recovery Act (tracking hazardous waste)) Business NAICS classification: CONSUMER ELECTRONICS REPAIR AND MAINTENANCE. Organizations: AGUERORAYMOND AND DIANE (CONTACT/OPERATOR)
AMERICAN TELEPHONE AND TELEGRAPH COMPANY (STATE HWY 70 2 MI N OF in SWEETWATER, TX)
(Resource Conservation and Recovery Act (tracking hazardous waste)) Alternative names: AMERICAN TEL & TEL CO LONG LINES
ARCHER DANIELS MIDLAND COMPANY (ON OR NEAR F.M. 419 N. in SWEETWATER, TX)
AIR MINOR (AIRS/AFS) CRITERIA AND HAZARDOUS AIR POLLUTANT INVENTORY (Inventory of air pollution sources) Business SIC classification: COTTONSEED OIL MILLS Alternative names: ARCHER-DANIELS-MIDLAND CO.
BAHLMAN CLEANERS INC (910 E 3RD ST in SWEETWATER, TX)
(Resource Conservation and Recovery Act (tracking hazardous waste)) Alternative names: BAHLMAN CLNRS
AFCO NO 10111 (911 HAILEY in SWEETWATER, TX)
Conditionally Exempt Small Quantity Generators, less than 100 kg/month of hazardous waste (Resource Conservation and Recovery Act (tracking hazardous waste)) - notification Organizations: MICOR ENERGY LLC DBA AFCO (CONTACT/OWNER)
Housing units lacking complete plumbing facilities: 3.2% Housing units lacking complete kitchen facilities: 8.4%
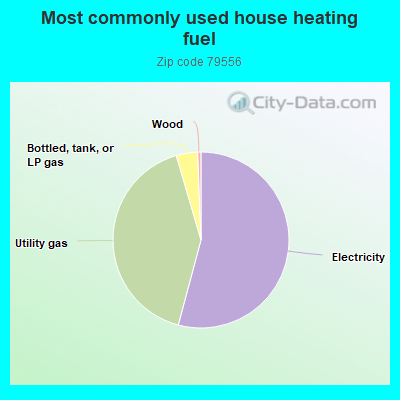
53.9%Electricity
41.1%Utility gas
3.9%Bottled, tank, or LP gas
0.6%Wood
Population in 1990: 14,064.
Place of birth for U.S.-born residents:
This state: 10,128
Northeast: 203
Midwest: 368
South: 729
West: 791
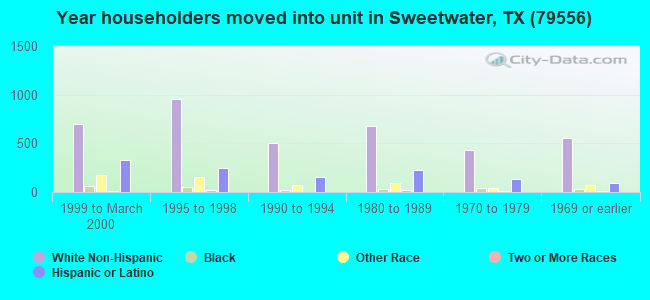
57% of the 79556 zip code residents lived in the same house 5 years ago. Out of people who lived in different houses, 52% lived in this county. Out of people who lived in different counties, 50% lived in Texas.
87% of the 79556 zip code residents lived in the same house 1 year ago. Out of people who lived in different houses, 57% moved from this county. Out of people who lived in different houses, 22% moved from different county within same state. Out of people who lived in different houses, 14% moved from different state. Out of people who lived in different houses, 6% moved from abroad.
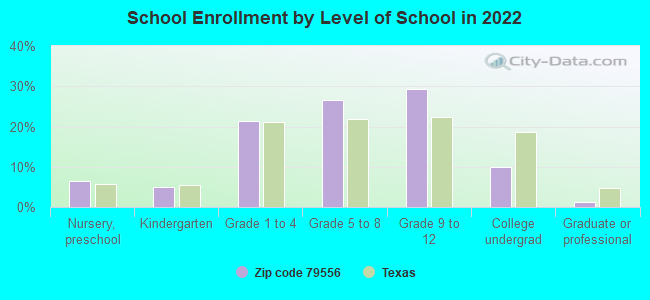
Private vs. public school enrollment:
Students in private schools in grades 1 to 8 (elementary and middle school): 58
Here:
4.1%
Texas:
8.8%
Students in private schools in grades 9 to 12 (high school): 35
Here:
4.0%
Texas:
8.0%
Students in private undergraduate colleges: 35
Here:
12.1%
Texas:
16.2%
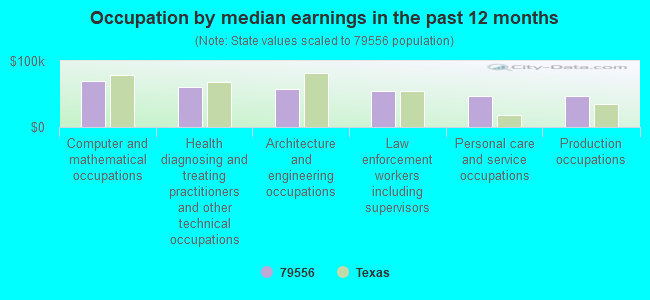
Occupation by median earnings in the past 12 months ($)
69,971Computer and mathematical occupations
60,637Health diagnosing and treating practitioners and other technical occupations
57,308Architecture and engineering occupations
55,009Law enforcement workers including supervisors
47,720Personal care and service occupations
46,798Production occupations
Companies with federal contracts located in this zip code:
JIMMIE LEE ALLDREDGE (1407 E 12TH ST in SWEETWATER, TX; small business)
$8,400 with Army for Logistics Support Services. Signed on 2006-03-06. Completion date: 2006-04-01.
Top industries in this zip code by the number of employees in 2005:
Health Care and Social Assistance: General Medical and Surgical Hospitals (250-499 employees: 1 establishment)
128 people in nursing facilities/skilled-nursing facilities
49 people in local jails and other municipal confinement facilities
12 people in group homes intended for adults
12 people in residential treatment centers for adults
3 people in workers' group living quarters and job corps centers
People in group quarters in 2000:
113 people in college dormitories (includes college quarters off campus)
103 people in nursing homes
90 people in halfway houses
63 people in training schools for juvenile delinquents
44 people in local jails and other confinement facilities (including police lockups)
30 people in homes for the mentally retarded
15 people in homes for the mentally ill
4 people in other noninstitutional group quarters
Fatal accident statistics in 2014:
Fatal accident count: 3
Vehicles involved in fatal accidents: 3
Fatal accidents caused by drunken drivers: 1
Fatalities: 4
Persons involved in fatal accidents: 4
Pedestrians involved in fatal accidents: 0
Fatal accident statistics in 2013:
Fatal accident count: 2
Vehicles involved in fatal accidents: 2
Fatal accidents caused by drunken drivers: 0
Fatalities: 2
Persons involved in fatal accidents: 2
Pedestrians involved in fatal accidents: 1
2005 - 2018 National Fire Incident Reporting System (NFIRS) incidents
Based on the data from the years 2005 - 2018 the average number of fire incidents per year is 116. The highest number of reported fires - 147 took place in 2014, and the least - 84 in 2013. The data has a growing trend.
When looking into fire subcategories, the most reports belonged to: Outside Fires (57.8%), and Structure Fires (24.2%).
Fire incident types reported to NFIRS in Zip Code 79556


 Nearest zip codes: 79561, 79545, 79537, 79560, 79543, 79535.
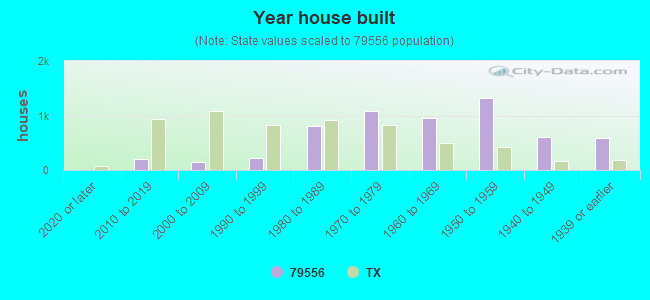


 Based on the data from the years 2005 - 2018 the average number of fire incidents per year is 116. The highest number of reported fires - 147 took place in 2014, and the least - 84 in 2013. The data has a growing trend.
 When looking into fire subcategories, the most reports belonged to: Outside Fires (57.8%), and Structure Fires (24.2%).