Estimated zip code population in 2022: 10,089 Zip code population in 2010: 8,863 Zip code population in 2000: 8,056
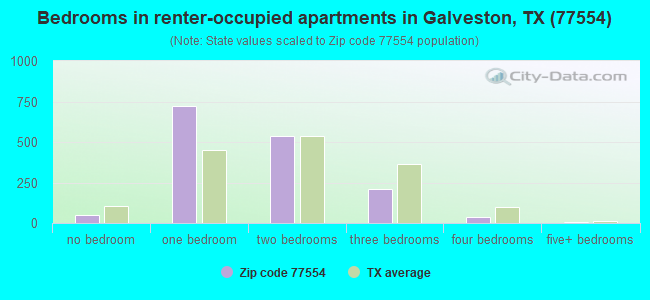
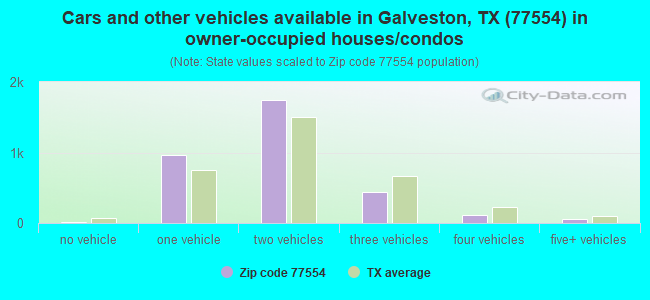
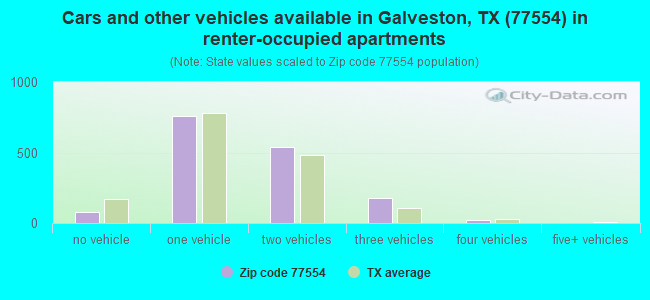
Houses and condos: 10,834 Renter-occupied apartments: 1,583
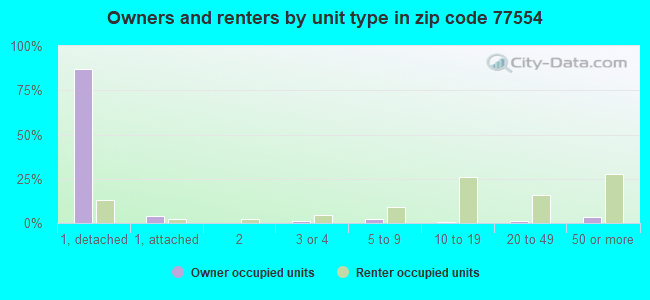
% of renters here:
32%
State:
38%
March 2022 cost of living index in zip code 77554: 90.8 (less than average, U.S. average is 100)
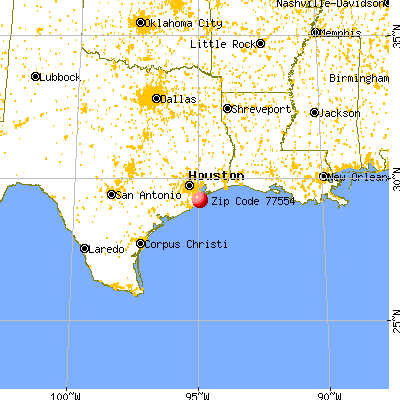
Land area: 35.4 sq. mi. Water area: 28.7 sq. mi.
Population density: 285 people per square mile
(very low).
OSM Map
General Map
Google Map
MSN Map
OSM Map
General Map
Google Map
MSN Map
OSM Map
General Map
Google Map
MSN Map
OSM Map
General Map
Google Map
MSN Map
Please wait while loading the map...
Real estate property taxes paid for housing units in 2022:
This zip code:
1.3% ($6,063)
Texas:
1.5% ($4,050)
Median real estate property taxes paid for housing units with mortgages in 2022: $6,385 (1.3%) Median real estate property taxes paid for housing units with no mortgage in 2022: $5,918 (1.4%)
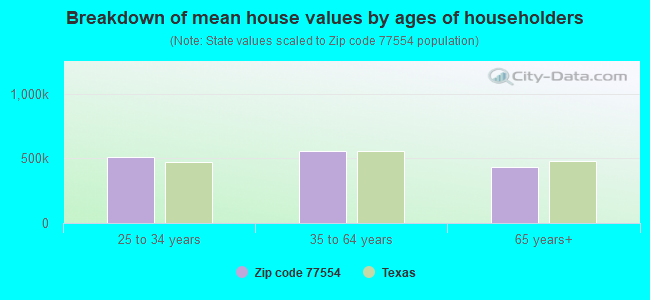
Estimated median house/condo value in 2022: $453,369
77554:
$453,369
Texas:
$275,400
According to our research of Texas and other state lists, there were 14 registered sex offenders living in 77554 zip code as of June 07, 2024. The ratio of all residents to sex offenders in zip code 77554 is 596 to 1. The ratio of registered sex offenders to all residents in this zip code is lower than the state average.
Median resident age:
This zip code:
54.0 years
Texas median age:
35.6 years
Average household size:
This zip code:
1.9 people
Texas:
2.6 people
Averages for the 2020 tax year for zip code 77554, filed in 2021:
Average Adjusted Gross Income (AGI) in 2020: $131,366 (Individual Income Tax Returns)
Here:
$131,366
State:
$77,054
Salary/wage: $99,442 (reported on 73.8% of returns)
Here:
$99,442
State:
$62,766
(% of AGI for various income ranges: 1088.4% for AGIs below $25k, 3368.0% for AGIs $25k-50k, 5743.8% for AGIs $50k-75k, 8889.6% for AGIs $75k-100k, 15975.8% for AGIs $100k-200k, 96681.1% for AGIs over 200k)
Taxable interest for individuals: $3,583 (reported on 43.9% of returns)
This zip code:
$3,583
Texas:
$2,665
(% of AGI for various income ranges: 31.8% for AGIs below $25k, 60.8% for AGIs $25k-50k, 73.8% for AGIs $50k-75k, 157.0% for AGIs $75k-100k, 297.4% for AGIs $100k-200k, 2324.4% for AGIs over 200k)
Ordinary dividends: $15,936 (reported on 32.3% of returns)
Here:
$15,936
State:
$10,044
(% of AGI for various income ranges: 67.0% for AGIs below $25k, 102.8% for AGIs $25k-50k, 201.0% for AGIs $50k-75k, 383.0% for AGIs $75k-100k, 892.3% for AGIs $100k-200k, 8493.3% for AGIs over 200k)
Net capital gain/loss in AGI: +$27,825 (reported on 32.5% of returns)
Here:
+$27,825
State:
+$39,590
(% of AGI for various income ranges: 44.5% for AGIs below $25k, 81.8% for AGIs $25k-50k, 87.5% for AGIs $50k-75k, 382.2% for AGIs $75k-100k, 1052.6% for AGIs $100k-200k, 17720.0% for AGIs over 200k)
Profit/loss from business: +$24,568 (reported on 21.9% of returns)
Here:
+$24,568
State:
+$10,888
(% of AGI for various income ranges: 95.0% for AGIs below $25k, 370.4% for AGIs $25k-50k, 347.5% for AGIs $50k-75k, 498.7% for AGIs $75k-100k, 984.2% for AGIs $100k-200k, 7502.8% for AGIs over 200k)
Taxable individual retirement arrangement distribution: $37,168 (reported on 15.3% of returns)
77554:
$37,168
Texas:
$24,740
(% of AGI for various income ranges: 63.0% for AGIs below $25k, 204.2% for AGIs $25k-50k, 514.8% for AGIs $50k-75k, 750.0% for AGIs $75k-100k, 2057.7% for AGIs $100k-200k, 5570.6% for AGIs over 200k)
Self-employed (Keogh) retirement plans: $33,133 (reported on 1.4% of returns)
77554:
$33,133
Texas:
$29,298
(% of AGI for various income ranges: 1104.4% for AGIs over 200k)
Total itemized deductions: $37,568 (reported on 15.6% of returns)
Here:
$37,568
State:
$40,428
(% of AGI for various income ranges: 88.0% for AGIs below $25k, 202.4% for AGIs $25k-50k, 336.5% for AGIs $50k-75k, 742.2% for AGIs $75k-100k, 1452.3% for AGIs $100k-200k, 7675.6% for AGIs over 200k)
Charity contributions: $13,291 (reported on 12.5% of returns)
Here:
$13,291
State:
$18,201
(% of AGI for various income ranges: 26.8% for AGIs $25k-50k, 48.2% for AGIs $50k-75k, 113.9% for AGIs $75k-100k, 303.0% for AGIs $100k-200k, 2862.2% for AGIs over 200k)
Taxes paid: $8,162 (reported on 15.3% of returns)
77554:
$8,162
State:
$7,821
(% of AGI for various income ranges: 19.2% for AGIs below $25k, 44.0% for AGIs $25k-50k, 75.0% for AGIs $50k-75k, 181.3% for AGIs $75k-100k, 359.3% for AGIs $100k-200k, 1487.2% for AGIs over 200k)
Earned income credit: $1,697 (reported on 7.8% of returns)
Here:
$1,697
State:
$2,584
(% of AGI for various income ranges: 53.4% for AGIs below $25k, 30.8% for AGIs $25k-50k)
Percentage of individuals using paid preparers for their 2020 taxes: 89.6%
Here:
90%
State:
92%
(% for various income ranges: 88.8% for AGIs below $25k, 90.1% for AGIs $25k-50k, 89.8% for AGIs $50k-75k, 87.5% for AGIs $75k-100k, 89.2% for AGIs $100k-200k, 92.2% for AGIs over 200k)
Averages for the 2012 tax year for zip code 77554, filed in 2013:
Average Adjusted Gross Income (AGI) in 2012: $101,706 (Individual Income Tax Returns)
Here:
$101,706
State:
$65,384
Salary/wage: $75,973 (reported on 79.1% of returns)
Here:
$75,973
State:
$52,524
(% of AGI for various income ranges: 72.1% for AGIs below $25k, 75.6% for AGIs $25k-50k, 63.5% for AGIs $50k-75k, 67.1% for AGIs $75k-100k, 69.7% for AGIs $100k-200k, 49.6% for AGIs over 200k)
Taxable interest for individuals: $3,048 (reported on 41.7% of returns)
This zip code:
$3,048
Texas:
$2,372
(% of AGI for various income ranges: 1.7% for AGIs below $25k, 0.9% for AGIs $25k-50k, 1.1% for AGIs $50k-75k, 1.3% for AGIs $75k-100k, 1.3% for AGIs $100k-200k, 1.3% for AGIs over 200k)
Ordinary dividends: $12,689 (reported on 27.5% of returns)
Here:
$12,689
State:
$9,721
(% of AGI for various income ranges: 5.2% for AGIs below $25k, 1.7% for AGIs $25k-50k, 2.1% for AGIs $50k-75k, 1.8% for AGIs $75k-100k, 2.5% for AGIs $100k-200k, 4.4% for AGIs over 200k)
Net capital gain/loss in AGI: +$27,232 (reported on 24.3% of returns)
Here:
+$27,232
State:
+$35,319
(% of AGI for various income ranges: 0.1% for AGIs $25k-50k, 1.2% for AGIs $50k-75k, 1.0% for AGIs $75k-100k, 2.3% for AGIs $100k-200k, 11.2% for AGIs over 200k)
Profit/loss from business: +$22,143 (reported on 19.8% of returns)
Here:
+$22,143
State:
+$13,732
(% of AGI for various income ranges: 5.7% for AGIs below $25k, 5.0% for AGIs $25k-50k, 7.5% for AGIs $50k-75k, 5.2% for AGIs $75k-100k, 4.4% for AGIs $100k-200k, 3.5% for AGIs over 200k)
Taxable individual retirement arrangement distribution: $31,473 (reported on 14.7% of returns)
77554:
$31,473
Texas:
$19,511
(% of AGI for various income ranges: 4.9% for AGIs below $25k, 4.9% for AGIs $25k-50k, 5.8% for AGIs $50k-75k, 4.4% for AGIs $75k-100k, 4.1% for AGIs $100k-200k, 4.5% for AGIs over 200k)
Self-employment retirement plans: $21,380 (reported on 1.3% of returns)
77554:
$21,380
Texas:
$23,938
(% of AGI for various income ranges: 1.4% for AGIs $75k-100k, 0.3% for AGIs over 200k)
Total itemized deductions: $26,181 (13% of AGI, reported on 36.1% of returns)
Here:
$26,181
State:
$24,724
Here:
12.9% of AGI
State:
15.9% of AGI
(% of AGI for various income ranges: 11.4% for AGIs below $25k, 9.5% for AGIs $25k-50k, 11.8% for AGIs $50k-75k, 10.7% for AGIs $75k-100k, 11.5% for AGIs $100k-200k, 7.6% for AGIs over 200k)
Charity contributions: $4,704 (reported on 29.4% of returns)
Here:
$4,704
State:
$6,808
(% of AGI for various income ranges: 0.7% for AGIs below $25k, 0.9% for AGIs $25k-50k, 1.2% for AGIs $50k-75k, 1.1% for AGIs $75k-100k, 1.6% for AGIs $100k-200k, 1.4% for AGIs over 200k)
Taxes paid: $9,163 (reported on 35.8% of returns)
77554:
$9,163
State:
$6,921
(% of AGI for various income ranges: 3.0% for AGIs below $25k, 2.5% for AGIs $25k-50k, 3.2% for AGIs $50k-75k, 3.5% for AGIs $75k-100k, 4.1% for AGIs $100k-200k, 2.9% for AGIs over 200k)
Earned income credit: $1,721 (reported on 10.4% of returns)
Here:
$1,721
State:
$2,570
(% of AGI for various income ranges: 3.7% for AGIs below $25k, 0.5% for AGIs $25k-50k)
Percentage of individuals using paid preparers for their 2012 taxes: 48.4%
Here:
48%
State:
51%
(% for various income ranges: 38.2% for AGIs below $25k, 39.7% for AGIs $25k-50k, 48.9% for AGIs $50k-75k, 52.9% for AGIs $75k-100k, 60.0% for AGIs $100k-200k, 75.7% for AGIs over 200k)
Averages for the 2004 tax year for zip code 77554, filed in 2005:
Average Adjusted Gross Income (AGI) in 2004: $74,641 (Individual Income Tax Returns)
Here:
$74,641
State:
$47,881
Salary/wage: $58,384 (reported on 79.2% of returns)
Here:
$58,384
State:
$41,947
(% of AGI for various income ranges: 433.2% for AGIs below $10k, 76.4% for AGIs $10k-25k, 77.4% for AGIs $25k-50k, 69.5% for AGIs $50k-75k, 74.3% for AGIs $75k-100k, 53.3% for AGIs over 100k)
Taxable interest for individuals: $2,958 (reported on 53.0% of returns)
This zip code:
$2,958
Texas:
$2,255
(% of AGI for various income ranges: 32.6% for AGIs below $10k, 3.0% for AGIs $10k-25k, 2.0% for AGIs $25k-50k, 1.7% for AGIs $50k-75k, 1.8% for AGIs $75k-100k, 2.1% for AGIs over 100k)
Taxable dividends: $8,170 (reported on 31.6% of returns)
Here:
$8,170
State:
$4,261
(% of AGI for various income ranges: 21.6% for AGIs below $10k, 2.7% for AGIs $10k-25k, 1.4% for AGIs $25k-50k, 1.3% for AGIs $50k-75k, 1.0% for AGIs $75k-100k, 4.6% for AGIs over 100k)
Net capital gain/loss: +$28,098 (reported on 28.9% of returns)
Here:
+$28,098
State:
+$16,110
(% of AGI for various income ranges: 4.5% for AGIs below $10k, -0.1% for AGIs $10k-25k, 1.2% for AGIs $25k-50k, 1.7% for AGIs $50k-75k, 2.2% for AGIs $75k-100k, 16.6% for AGIs over 100k)
Profit/loss from business: +$21,819 (reported on 20.8% of returns)
Here:
+$21,819
State:
+$11,013
(% of AGI for various income ranges: 68.8% for AGIs below $10k, 5.6% for AGIs $10k-25k, 5.0% for AGIs $25k-50k, 4.8% for AGIs $50k-75k, 4.5% for AGIs $75k-100k, 6.6% for AGIs over 100k)
IRA payment deduction: $3,826 (reported on 3.3% of returns)
77554:
$3,826
Texas:
$3,120
(% of AGI for various income ranges: 0.5% for AGIs $25k-50k, 0.2% for AGIs $50k-75k, 0.2% for AGIs $75k-100k, 0.1% for AGIs over 100k)
Self-employed pension: $17,318 (reported on 1.8% of returns)
Here:
$17,318
Texas:
$16,401
(% of AGI for various income ranges: 10.4% for AGIs below $10k, 0.4% for AGIs $50k-75k, 0.6% for AGIs over 100k)
Total itemized deductions: $20,255 (16% of AGI, reported on 39.0% of returns)
Here:
$20,255
State:
$19,631
Here:
16.2% of AGI
State:
18.9% of AGI
(% of AGI for various income ranges: 70.0% for AGIs below $10k, 12.2% for AGIs $10k-25k, 13.1% for AGIs $25k-50k, 13.8% for AGIs $50k-75k, 12.7% for AGIs $75k-100k, 8.9% for AGIs over 100k)
Charity contributions deductions: $3,417 (3% of AGI, reported on 32.7% of returns)
Here:
$3,417
State:
$4,753
Here:
2.6% of AGI
State:
4.2% of AGI
(% of AGI for various income ranges: 2.9% for AGIs below $10k, 1.0% for AGIs $10k-25k, 1.3% for AGIs $25k-50k, 1.5% for AGIs $50k-75k, 1.4% for AGIs $75k-100k, 1.6% for AGIs over 100k)
Total tax: $15,263 (reported on 80.8% of returns)
77554:
$15,263
State:
$9,058
(% of AGI for various income ranges: 16.0% for AGIs below $10k, 4.7% for AGIs $10k-25k, 7.8% for AGIs $25k-50k, 10.8% for AGIs $50k-75k, 12.0% for AGIs $75k-100k, 20.7% for AGIs over 100k)
Earned income credit: $1,582 (reported on 11.3% of returns)
Here:
$1,582
State:
$2,024
Percentage of individuals using paid preparers for their 2004 taxes: 52.9%
Here:
53%
State:
57%
(% for various income ranges: 48.2% for AGIs below $10k, 55.2% for AGIs $10k-25k, 47.5% for AGIs $25k-50k, 51.1% for AGIs $50k-75k, 47.4% for AGIs $75k-100k, 65.3% for AGIs over 100k)
Likely homosexual households (counted as self-reported same-sex unmarried-partner households)
Lesbian couples: 0.1% of all households
Gay men: 0.1% of all households
Household received Food Stamps/SNAP in the past 12 months: 87 Household did not receive Food Stamps/SNAP in the past 12 months: 4,780
Women who had a birth in the past 12 months: 88 (66 now married, 22 unmarried) Women who did not have a birth in the past 12 months: 1,559 (656 now married, 903 unmarried)
Housing units in zip code 77554 with a mortgage: 1,480 (109 second mortgage, 65 both second mortgage and home equity loan) Houses without a mortgage: 42
Median monthly owner costs for units with a mortgage: $2,372 Median monthly owner costs for units without a mortgage: $1,154
Residents with income below the poverty level in 2022:
This zip code:
9.1%
Whole state:
14.0%
Residents with income below 50% of the poverty level in 2022:
This zip code:
2.9%
Whole state:
7.4%
Median number of rooms in houses and condos:
Here:
5.6
State:
6.3
Median number of rooms in apartments:
Here:
3.9
State:
4.0
Notable locations in this zip code not listed on our city pages
Notable locations in zip code 77554: Scholes International Airport Terminal (A), Island (B), Marina at Sea Isle (C), Payco Marina (D), Pirates Beach Marina (E), Galveston Fire Department Station 8 (F), Galveston Fire Department Station 7 (G), Galveston Fire Department Station 4 (H), Jamaica Beach Volunteer Fire Department (I), Jamaica Beach Police Department (J), Lone Star Flight Museum (K), Ocean Star-Offshore Energy Center (L), Lone Star Flight Museum (M). Display/hide their locations on the map
Churches in zip code 77554 include: West Isle Presbyterian Church (A), Jerusalem Church (B), West Isle Church (C), Mary Star of the Sea Church (D). Display/hide their locations on the map
Parks in zip code 77554 include: Moody Gardens (1), Galveston Island State Park (2), Schreiber Park (3), Sand Castle Beach Pocket Park 2 (4), Schlitterbahn Galveston Island Waterpark (5), Moody Gardens (6), Dellanera RV Park (7), Sea Gull Shores Beach Pocket Park 1 (8). Display/hide their locations on the map
Beaches: West Beach (A), Bermuda Beach (B), Pirates Beach (C), Palm Beach (D), Pirates Beach (E), Bermuda Beach (F), Jamaica Beach (G). Display/hide their locations on the map
601 married couples with children.
58 single-parent households (46 men, 12 women).
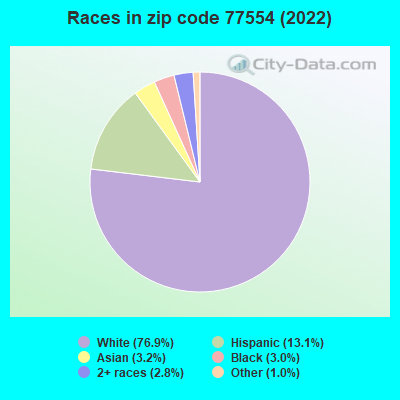
87.8% of residents of 77554 zip code speak English at home.
5.9% of residents speak Spanish at home (89% very well, 8% well, 4% not well).
3.9% of residents speak other Indo-European language at home (84% very well, 16% well).
2.2% of residents speak Asian or Pacific Island language at home (95% very well, 4% well, 2% not well).
0.8% of residents speak other language at home (100% very well).
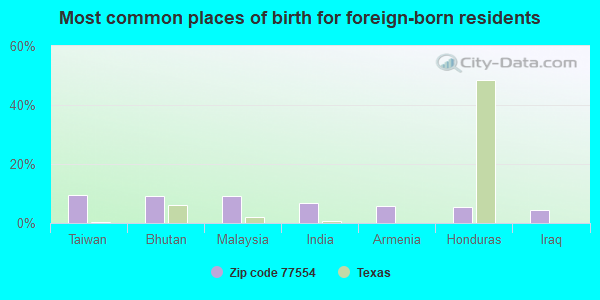
Foreign born population: 670 (6.6%) (64.8% of them are naturalized citizens)
This zip code:
6.6%
Whole state:
17.2%
9%Taiwan
9%Bhutan
9%Malaysia
7%India
6%Armenia
6%Honduras
4%Iraq
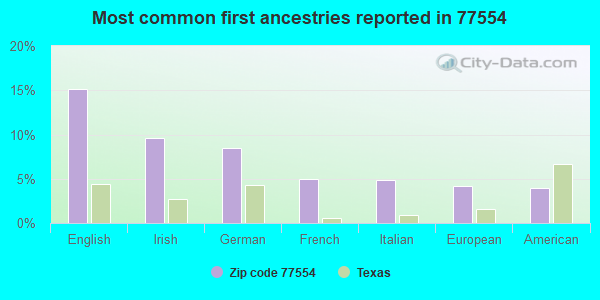
15%English
10%Irish
8%German
5%French
5%Italian
4%European
4%American
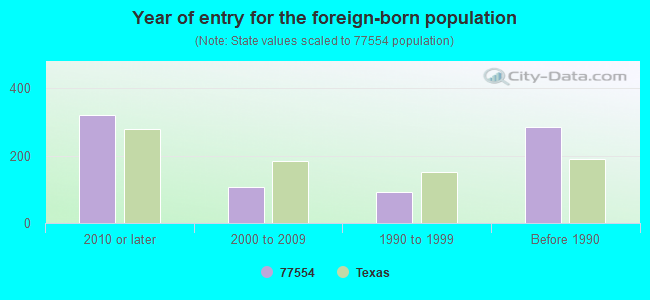
Year of entry for the foreign-born population
3212010 or later
1082000 to 2009
931990 to 1999
285Before 1990
Facilities with environmental interests located in this zip code:
AIR LOGISTICS (8420 AIRPORT BLVD in GALVESTON, TX)
(Resource Conservation and Recovery Act (tracking hazardous waste)) Business NAICS classification: NONSCHEDULED CHARTERED PASSENGER AIR TRANSPORTATION.
AFCO NO 10504 (200 TIKI BLVD in GALVESTON, TX)
Conditionally Exempt Small Quantity Generators, less than 100 kg/month of hazardous waste (Resource Conservation and Recovery Act (tracking hazardous waste)) - notification Organizations: MICRO ENERGY LLC DBA AFCO (CONTACT/OWNER)
Housing units lacking complete plumbing facilities: 0.4% Housing units lacking complete kitchen facilities: 1.0%
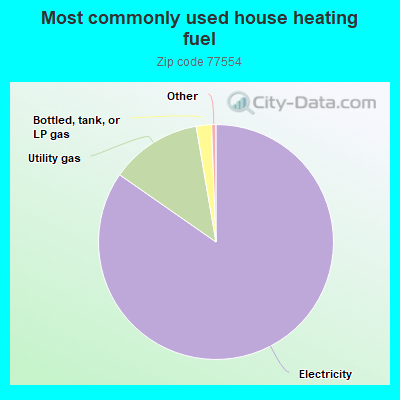
84.7%Electricity
12.6%Utility gas
2.1%Bottled, tank, or LP gas
Population in 1990: 5,495. Population change in the 1990s: +2,561 (+46.6%).
Place of birth for U.S.-born residents:
This state: 5,185
Northeast: 518
Midwest: 1,311
South: 1,664
West: 626
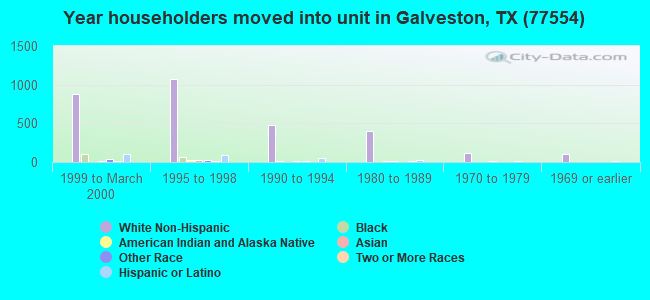
40% of the 77554 zip code residents lived in the same house 5 years ago. Out of people who lived in different houses, 44% lived in this county. Out of people who lived in different counties, 50% lived in Texas.
84% of the 77554 zip code residents lived in the same house 1 year ago. Out of people who lived in different houses, 30% moved from this county. Out of people who lived in different houses, 50% moved from different county within same state. Out of people who lived in different houses, 22% moved from different state.
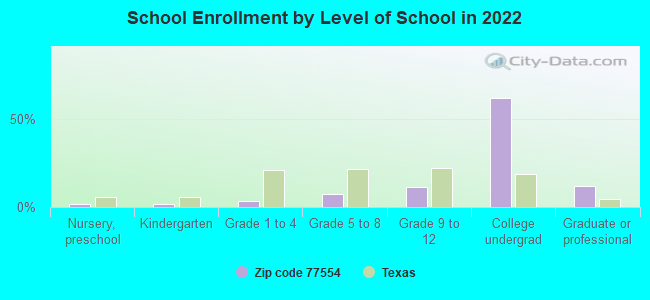
Private vs. public school enrollment:
Students in private schools in grades 1 to 8 (elementary and middle school): 99
Here:
41.9%
Texas:
8.8%
Students in private schools in grades 9 to 12 (high school): 100
Here:
39.9%
Texas:
8.0%
Students in private undergraduate colleges: 445
Here:
34.1%
Texas:
16.2%
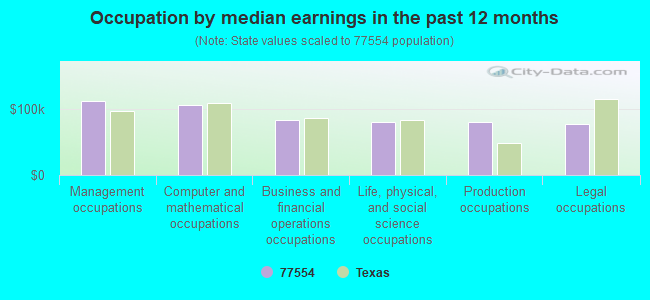
Occupation by median earnings in the past 12 months ($)
113,023Management occupations
106,967Computer and mathematical occupations
83,171Business and financial operations occupations
81,372Life, physical, and social science occupations
80,998Production occupations
78,329Legal occupations
Companies with federal contracts located in this zip code (GALVESTON, TX):
TEXAS GULF CONSTRUCTION CO INC (7225 HARBORSIDE DRIVE; small business) : $569,225 in 2 contractsin 2001
$300,000 with U.S. Army Corps of Engineers - civil program financing only for Maintenance, Repair or Alteration of Real Property -- Other Conservation and Development Facilities. Signed on 2001-03-12. Completion date: 2001-03-30.
$269,225 with U.S. Army Corps of Engineers - civil program financing only for Construction of Structures and Facilities -- Other Conservation and Development Facilities. Signed on 2001-09-28. Completion date: 2002-02-28.
TEXAS AVIATION HALL OF FAME IN (2002 TERMINAL DR) : $361,338 in 26 contractsfrom 2002 to 2006
Contracts for Recreational Services, Other Administrative Support Services, Facilities Operations Support Services, Other Professional Services, and moreby Air Force, Army Signed by year:2000: $0; 2001: $0; 2002: $51,615; 2003: $13,150; 2004: $138,520; 2005: $85,262; 2006: $72,791.
Biggest contracts:
$48,790 with Air Force for Recreational Services. Signed on 2004-10-07. Completion date: 2004-11-07.
$48,750 with Air Force for Other Administrative Support Services. Taking place in AL. Signed on 2004-01-03. Completion date: 2004-06-06.
$45,230 with Air Force for Facilities Operations Support Services. Taking place in NE. Signed on 2004-06-07. Completion date: 2004-08-22.
$42,678 with Air Force for Other Professional Services. Taking place in AL. Signed on 2006-01-27. Completion date: 2006-04-08.
NATIONAL COTTON, INC (7222 HARBORSIDE DRIVE; small business) : $216,625 in 12 contractsfrom 2000 to 2005
Contracts for Miscellaneous Engine Accessories, Nonaircraft, Modification of Equipment -- Electrical and Electronic Equipment Components, Small Craft, Maintenance, Repair and Rebuilding of Equipment -- Miscellaneous, and moreby U.S. Army Corps of Engineers - civil program financing only, Army Signed by year:2000: $65,371; 2001: $0; 2002: $0; 2003: $110,136; 2004: $0; 2005: $41,118; 2006: $0.
Biggest contracts:
$65,371 with U.S. Army Corps of Engineers - civil program financing only for Miscellaneous Engine Accessories, Nonaircraft. Signed on 2000-12-15. Completion date: 2000-12-12.
$37,442 with U.S. Army Corps of Engineers - civil program financing only for Modification of Equipment -- Electrical and Electronic Equipment Components. Signed on 2003-02-18. Completion date: 2003-03-18.
$33,415 with U.S. Army Corps of Engineers - civil program financing only for Small Craft. Signed on 2003-09-29. Completion date: 2003-08-29.
$13,145 with Army for Maintenance, Repair and Rebuilding of Equipment -- Miscellaneous. Signed on 2003-12-05. Completion date: 2003-08-29.
MOODY GARDENS, INC (ONE HOPE BLVD) : $61,945 in 11 contractsfrom 2003 to 2005
Contracts for Lodging - Hotel/Motel, Chaplain Services, Lease or Rental of Facilities -- Conference Space and Facilities by Army Signed by year:2000: $0; 2001: $0; 2002: $0; 2003: $8,260; 2004: $37,514; 2005: $16,171; 2006: $0.
Biggest contracts:
$16,712 with Army for Lodging - Hotel/Motel. Signed on 2005-07-07. Completion date: 2005-07-17.
$13,527, same as above.Signed on 2004-07-01. Completion date: 2004-07-11.
$8,998 with Army for Chaplain Services. Signed on 2004-08-16. Completion date: 2004-08-28.
$8,348 with Army for Lodging - Hotel/Motel. Signed on 2004-04-29. Completion date: 2004-05-16.
SMITH-HAMM INC (320 77TH ST) : $57,950 in 3 contractsfrom 2000 to 2004
$53,000 with Maritime Administration for Non-nuclear Ship Repair (East) Ship repair (including overhauls and conversions) performed on non-nuclear propelled and nonpropelled ships east of the 108th meridian. Signed on 2000-03-15. Completion date: 2000-06-15.
$2,475 with U.S. Army Corps of Engineers - civil program financing only for Construction of Structures and Facilities -- Restoration of real property. Signed on 2004-11-08. Completion date: 2005-02-28.
$2,475 with Army for Construction of Structures and Facilities -- Restoration of real property. Signed on 2004-11-08. Completion date: 2005-02-28.
GALTEX PILOTS SERVICE CORP (1301 PELICAN ISLAND STE 2; small business) : $2,345 in 2 contractsfrom 2002 to 2005
$1,191 with Navy for Invalid code: 1927. Signed on 2002-04-01. Completion date: 2002-04-01.
$1,154 with Navy for Non-nuclear Ship Repair (East) Ship repair (including overhauls and conversions) performed on non-nuclear propelled and nonpropelled ships east of the 108th meridian. Signed on 2005-08-09. Completion date: 2005-07-20.
Top industries in this zip code by the number of employees in 2005:
Arts, Entertainment, and Recreation: Zoos and Botanical Gardens (500-999 employees: 1 establishment)
Wholesale Trade: Beer and Ale Merchant Wholesalers (100-249: 1)
Health Care and Social Assistance: Nursing Care Facilities (100-249: 1)
Construction: Commercial and Institutional Building Construction (50-99: 1, 20-49: 1, 5-9: 1, 1-4: 3)
Arts, Entertainment, and Recreation: Fitness and Recreational Sports Centers (50-99: 1, 5-9: 1, 1-4: 1)
Information: Newspaper Publishers (50-99: 1)
Mining: Support Activities for Oil and Gas Operations (50-99: 1)
People in group quarters in 2010:
773 people in college/university student housing
61 people in nursing facilities/skilled-nursing facilities
16 people in maritime/merchant vessels
People in group quarters in 2000:
136 people in nursing homes
Fatal accident statistics in 2014:
Fatal accident count: 4
Vehicles involved in fatal accidents: 6
Fatal accidents caused by drunken drivers: 1
Fatalities: 5
Persons involved in fatal accidents: 8
Pedestrians involved in fatal accidents: 1
Fatal accident statistics in 2013:
Fatal accident count: 2
Vehicles involved in fatal accidents: 2
Fatal accidents caused by drunken drivers: 1
Fatalities: 2
Persons involved in fatal accidents: 2
Pedestrians involved in fatal accidents: 0
Home Mortgage Disclosure Act Aggregated Statistics For Year 2009 (Based on 24 partial tracts)
A) FHA, FSA/RHS & VA Home Purchase Loans
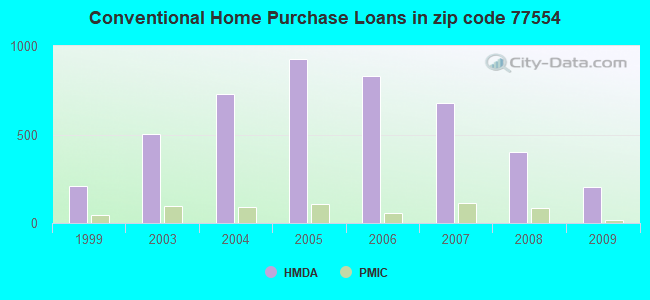
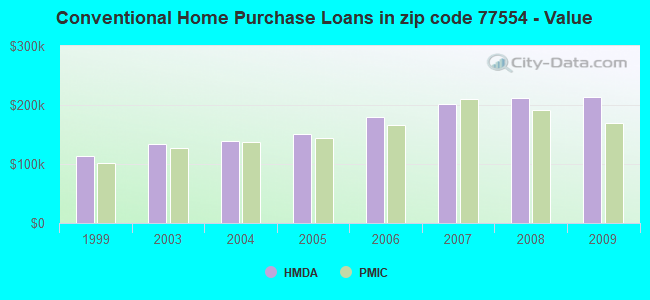
B) Conventional Home Purchase Loans
C) Refinancings
D) Home Improvement Loans
E) Loans on Dwellings For 5+ Families
F) Non-occupant Loans on < 5 Family Dwellings (A B C & D)
G) Loans On Manufactured Home Dwelling (A B C & D)
Number
Average Value
Number
Average Value
Number
Average Value
Number
Average Value
Number
Average Value
Number
Average Value
Number
Average Value
LOANS ORIGINATED
29
$141,751
205
$212,948
248
$219,987
19
$60,907
1
$575,520
251
$229,957
0
$0
APPLICATIONS APPROVED, NOT ACCEPTED
2
$167,950
20
$115,442
22
$180,144
3
$42,063
0
$0
20
$165,707
0
$0
APPLICATIONS DENIED
4
$125,105
52
$208,062
115
$223,940
20
$42,670
0
$0
84
$243,523
1
$3,980
APPLICATIONS WITHDRAWN
6
$117,292
25
$224,364
62
$233,566
4
$270,700
0
$0
43
$227,707
0
$0
FILES CLOSED FOR INCOMPLETENESS
4
$99,628
2
$50,335
9
$194,426
1
$34,740
0
$0
4
$241,750
0
$0
Aggregated Statistics For Year 2008 (Based on 24 partial tracts)
A) FHA, FSA/RHS & VA Home Purchase Loans
B) Conventional Home Purchase Loans
C) Refinancings
D) Home Improvement Loans
E) Loans on Dwellings For 5+ Families
F) Non-occupant Loans on < 5 Family Dwellings (A B C & D)
G) Loans On Manufactured Home Dwelling (A B C & D)
Number
Average Value
Number
Average Value
Number
Average Value
Number
Average Value
Number
Average Value
Number
Average Value
Number
Average Value
LOANS ORIGINATED
27
$135,759
402
$212,024
165
$214,647
35
$109,808
3
$2,676,573
321
$221,221
0
$0
APPLICATIONS APPROVED, NOT ACCEPTED
5
$124,140
51
$169,087
25
$192,006
8
$32,959
0
$0
48
$197,727
1
$20,860
APPLICATIONS DENIED
13
$116,665
102
$149,397
124
$208,770
44
$79,296
0
$0
116
$190,327
1
$42,060
APPLICATIONS WITHDRAWN
7
$130,330
56
$201,092
53
$202,435
6
$96,595
0
$0
59
$182,325
0
$0
FILES CLOSED FOR INCOMPLETENESS
1
$206,610
15
$285,614
8
$129,365
2
$508,140
0
$0
11
$244,552
0
$0
Aggregated Statistics For Year 2007 (Based on 24 partial tracts)
A) FHA, FSA/RHS & VA Home Purchase Loans
B) Conventional Home Purchase Loans
C) Refinancings
D) Home Improvement Loans
E) Loans on Dwellings For 5+ Families
F) Non-occupant Loans on < 5 Family Dwellings (A B C & D)
G) Loans On Manufactured Home Dwelling (A B C & D)
Number
Average Value
Number
Average Value
Number
Average Value
Number
Average Value
Number
Average Value
Number
Average Value
Number
Average Value
LOANS ORIGINATED
16
$159,189
678
$202,295
200
$207,270
46
$75,554
1
$755,890
525
$215,590
0
$0
APPLICATIONS APPROVED, NOT ACCEPTED
1
$106,470
82
$198,462
35
$185,614
11
$62,645
0
$0
47
$219,698
1
$30,210
APPLICATIONS DENIED
3
$130,063
158
$207,012
145
$231,401
46
$72,380
0
$0
134
$211,126
0
$0
APPLICATIONS WITHDRAWN
3
$150,113
84
$183,762
73
$191,947
7
$86,110
0
$0
68
$197,650
0
$0
FILES CLOSED FOR INCOMPLETENESS
1
$129,490
28
$250,102
28
$228,643
3
$68,463
0
$0
23
$238,067
0
$0
Aggregated Statistics For Year 2006 (Based on 24 partial tracts)
A) FHA, FSA/RHS & VA Home Purchase Loans
B) Conventional Home Purchase Loans
C) Refinancings
D) Home Improvement Loans
E) Loans on Dwellings For 5+ Families
F) Non-occupant Loans on < 5 Family Dwellings (A B C & D)
G) Loans On Manufactured Home Dwelling (A B C & D)
Number
Average Value
Number
Average Value
Number
Average Value
Number
Average Value
Number
Average Value
Number
Average Value
Number
Average Value
LOANS ORIGINATED
5
$137,990
829
$178,959
273
$229,611
61
$82,961
2
$9,629,965
606
$214,135
1
$31,820
APPLICATIONS APPROVED, NOT ACCEPTED
0
$0
151
$160,224
39
$165,208
8
$55,742
0
$0
78
$149,524
2
$138,080
APPLICATIONS DENIED
1
$178,360
221
$169,634
136
$201,490
43
$67,481
0
$0
124
$193,736
3
$51,740
APPLICATIONS WITHDRAWN
1
$56,280
123
$176,538
116
$178,051
8
$86,389
2
$200,150
81
$178,448
0
$0
FILES CLOSED FOR INCOMPLETENESS
1
$120,860
30
$195,276
24
$221,183
1
$117,510
0
$0
17
$199,209
0
$0
Aggregated Statistics For Year 2005 (Based on 24 partial tracts)
A) FHA, FSA/RHS & VA Home Purchase Loans
B) Conventional Home Purchase Loans
C) Refinancings
D) Home Improvement Loans
E) Loans on Dwellings For 5+ Families
F) Non-occupant Loans on < 5 Family Dwellings (A B C & D)
G) Loans On Manufactured Home Dwelling (A B C & D)
Number
Average Value
Number
Average Value
Number
Average Value
Number
Average Value
Number
Average Value
Number
Average Value
Number
Average Value
LOANS ORIGINATED
2
$122,450
928
$151,490
287
$170,897
50
$82,289
2
$591,000
647
$158,087
1
$26,760
APPLICATIONS APPROVED, NOT ACCEPTED
0
$0
101
$141,425
45
$162,680
8
$23,091
0
$0
61
$153,335
2
$49,010
APPLICATIONS DENIED
3
$133,120
191
$130,028
189
$119,328
43
$30,073
0
$0
125
$115,410
1
$64,550
APPLICATIONS WITHDRAWN
1
$93,470
152
$145,980
104
$169,336
17
$168,623
1
$1,168,310
76
$159,258
0
$0
FILES CLOSED FOR INCOMPLETENESS
0
$0
37
$132,505
53
$151,507
1
$66,930
0
$0
26
$173,044
0
$0
Aggregated Statistics For Year 2004 (Based on 24 partial tracts)
A) FHA, FSA/RHS & VA Home Purchase Loans
B) Conventional Home Purchase Loans
C) Refinancings
D) Home Improvement Loans
E) Loans on Dwellings For 5+ Families
F) Non-occupant Loans on < 5 Family Dwellings (A B C & D)
G) Loans On Manufactured Home Dwelling (A B C & D)
Number
Average Value
Number
Average Value
Number
Average Value
Number
Average Value
Number
Average Value
Number
Average Value
Number
Average Value
LOANS ORIGINATED
10
$113,969
726
$139,741
380
$150,809
47
$60,464
1
$1,611,470
492
$151,572
0
$0
APPLICATIONS APPROVED, NOT ACCEPTED
2
$98,405
69
$145,389
48
$141,287
9
$50,073
0
$0
39
$158,276
5
$31,548
APPLICATIONS DENIED
2
$109,810
103
$101,866
175
$136,695
35
$42,508
0
$0
65
$133,177
2
$24,140
APPLICATIONS WITHDRAWN
2
$71,090
80
$144,449
108
$122,489
7
$86,996
0
$0
45
$149,046
1
$82,340
FILES CLOSED FOR INCOMPLETENESS
1
$93,320
28
$149,273
53
$153,573
4
$61,632
0
$0
21
$216,451
0
$0
Aggregated Statistics For Year 2003 (Based on 24 partial tracts)
A) FHA, FSA/RHS & VA Home Purchase Loans
B) Conventional Home Purchase Loans
C) Refinancings
D) Home Improvement Loans
E) Loans on Dwellings For 5+ Families
F) Non-occupant Loans on < 5 Family Dwellings (A B C & D)
Number
Average Value
Number
Average Value
Number
Average Value
Number
Average Value
Number
Average Value
Number
Average Value
LOANS ORIGINATED
8
$122,698
503
$133,332
686
$142,171
52
$40,055
2
$7,579,555
452
$145,417
APPLICATIONS APPROVED, NOT ACCEPTED
0
$0
45
$119,166
73
$127,684
7
$30,403
0
$0
34
$112,833
APPLICATIONS DENIED
0
$0
89
$122,876
234
$114,725
17
$35,023
0
$0
54
$132,246
APPLICATIONS WITHDRAWN
1
$123,340
58
$107,291
125
$129,730
1
$27,960
0
$0
32
$124,151
FILES CLOSED FOR INCOMPLETENESS
0
$0
35
$145,320
40
$150,877
2
$37,640
0
$0
19
$174,822
Aggregated Statistics For Year 1999 (Based on 11 partial tracts)
A) FHA, FSA/RHS & VA Home Purchase Loans
B) Conventional Home Purchase Loans
C) Refinancings
D) Home Improvement Loans
E) Loans on Dwellings For 5+ Families
F) Non-occupant Loans on < 5 Family Dwellings (A B C & D)
2002 - 2018 National Fire Incident Reporting System (NFIRS) incidents
Based on the data from the years 2002 - 2018 the average number of fire incidents per year is 52. The highest number of reported fires - 117 took place in 2012, and the least - 6 in 2002. The data has a rising trend.
When looking into fire subcategories, the most incidents belonged to: Outside Fires (62.3%), and Structure Fires (25.6%).
Fire incident types reported to NFIRS in Zip Code 77554


 Nearest zip codes: 77551, 77563, 77568, 77590, 77550, 77591.


 Based on the data from the years 2002 - 2018 the average number of fire incidents per year is 52. The highest number of reported fires - 117 took place in 2012, and the least - 6 in 2002. The data has a rising trend.
 When looking into fire subcategories, the most incidents belonged to: Outside Fires (62.3%), and Structure Fires (25.6%).