Estimated zip code population in 2022: 5,166 Zip code population in 2010: 5,062 Zip code population in 2000: 3,703
Houses and condos: 3,048 Renter-occupied apartments: 825
% of renters here:
36%
State:
38%
March 2022 cost of living index in zip code 75709: 80.5 (low, U.S. average is 100)
Land area: 20.7 sq. mi. Water area: 0.7 sq. mi.
Population density: 249 people per square mile
(very low).
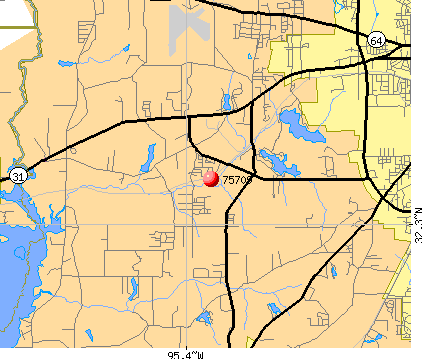
OSM Map
General Map
Google Map
MSN Map
OSM Map
General Map
Google Map
MSN Map
OSM Map
General Map
Google Map
MSN Map
OSM Map
General Map
Google Map
MSN Map
Please wait while loading the map...
Real estate property taxes paid for housing units in 2022:
This zip code:
1.1% ($2,323)
Texas:
1.5% ($4,050)
Median real estate property taxes paid for housing units with mortgages in 2022: $3,071 (1.2%) Median real estate property taxes paid for housing units with no mortgage in 2022: $1,791 (1.4%)
Averages for the 2020 tax year for zip code 75709, filed in 2021:
Average Adjusted Gross Income (AGI) in 2020: $69,071 (Individual Income Tax Returns)
Here:
$69,071
State:
$77,054
Salary/wage: $56,409 (reported on 81.5% of returns)
Here:
$56,409
State:
$62,766
(% of AGI for various income ranges: 1264.1% for AGIs below $25k, 3637.5% for AGIs $25k-50k, 6570.9% for AGIs $50k-75k, 8935.3% for AGIs $75k-100k, 15108.2% for AGIs $100k-200k, 92592.5% for AGIs over 200k)
Taxable interest for individuals: $2,437 (reported on 24.3% of returns)
This zip code:
$2,437
Texas:
$2,665
(% of AGI for various income ranges: 15.5% for AGIs below $25k, 15.2% for AGIs $25k-50k, 34.8% for AGIs $50k-75k, 34.7% for AGIs $75k-100k, 182.9% for AGIs $100k-200k, 2565.0% for AGIs over 200k)
Ordinary dividends: $9,877 (reported on 13.4% of returns)
Here:
$9,877
State:
$10,044
(% of AGI for various income ranges: 11.6% for AGIs below $25k, 25.1% for AGIs $25k-50k, 55.8% for AGIs $50k-75k, 89.5% for AGIs $75k-100k, 337.6% for AGIs $100k-200k, 6690.0% for AGIs over 200k)
Net capital gain/loss in AGI: +$24,730 (reported on 14.7% of returns)
Here:
+$24,730
State:
+$39,590
(% of AGI for various income ranges: 4.1% for AGIs below $25k, 18.2% for AGIs $25k-50k, 64.2% for AGIs $50k-75k, 108.9% for AGIs $75k-100k, 423.5% for AGIs $100k-200k, 23367.5% for AGIs over 200k)
Profit/loss from business: +$7,390 (reported on 20.9% of returns)
Here:
+$7,390
State:
+$10,888
(% of AGI for various income ranges: 127.8% for AGIs below $25k, 56.5% for AGIs $25k-50k, 95.8% for AGIs $50k-75k, 48.9% for AGIs $75k-100k, 344.1% for AGIs $100k-200k, 5535.0% for AGIs over 200k)
Taxable individual retirement arrangement distribution: $21,440 (reported on 8.6% of returns)
75709:
$21,440
Texas:
$24,740
(% of AGI for various income ranges: 40.3% for AGIs below $25k, 72.2% for AGIs $25k-50k, 200.6% for AGIs $50k-75k, 556.8% for AGIs $75k-100k, 1024.1% for AGIs $100k-200k, 2840.0% for AGIs over 200k)
Total itemized deductions: $36,881 (reported on 7.2% of returns)
Here:
$36,881
State:
$40,428
(% of AGI for various income ranges: 138.8% for AGIs $25k-50k, 305.2% for AGIs $50k-75k, 374.7% for AGIs $75k-100k, 972.9% for AGIs $100k-200k, 8675.0% for AGIs over 200k)
Charity contributions: $13,800 (reported on 6.2% of returns)
Here:
$13,800
State:
$18,201
(% of AGI for various income ranges: 19.2% for AGIs below $25k, 73.3% for AGIs $50k-75k, 123.2% for AGIs $75k-100k, 430.6% for AGIs $100k-200k, 2840.0% for AGIs over 200k)
Taxes paid: $7,042 (reported on 6.5% of returns)
75709:
$7,042
State:
$7,821
(% of AGI for various income ranges: 24.0% for AGIs $25k-50k, 38.8% for AGIs $50k-75k, 76.3% for AGIs $75k-100k, 179.4% for AGIs $100k-200k, 1510.0% for AGIs over 200k)
Earned income credit: $2,385 (reported on 18.8% of returns)
Here:
$2,385
State:
$2,584
(% of AGI for various income ranges: 113.0% for AGIs below $25k, 74.9% for AGIs $25k-50k)
Percentage of individuals using paid preparers for their 2020 taxes: 92.5%
Here:
92%
State:
92%
(% for various income ranges: 90.8% for AGIs below $25k, 95.0% for AGIs $25k-50k, 93.2% for AGIs $50k-75k, 92.6% for AGIs $75k-100k, 92.9% for AGIs $100k-200k, 86.7% for AGIs over 200k)
Averages for the 2012 tax year for zip code 75709, filed in 2013:
Average Adjusted Gross Income (AGI) in 2012: $57,211 (Individual Income Tax Returns)
Here:
$57,211
State:
$65,384
Salary/wage: $48,983 (reported on 85.1% of returns)
Here:
$48,983
State:
$52,524
(% of AGI for various income ranges: 75.0% for AGIs below $25k, 85.2% for AGIs $25k-50k, 77.4% for AGIs $50k-75k, 77.0% for AGIs $75k-100k, 73.9% for AGIs $100k-200k, 60.2% for AGIs over 200k)
Taxable interest for individuals: $1,505 (reported on 24.1% of returns)
This zip code:
$1,505
Texas:
$2,372
(% of AGI for various income ranges: 0.9% for AGIs below $25k, 0.5% for AGIs $25k-50k, 0.5% for AGIs $50k-75k, 0.4% for AGIs $75k-100k, 0.4% for AGIs $100k-200k, 1.0% for AGIs over 200k)
Ordinary dividends: $8,710 (reported on 12.9% of returns)
Here:
$8,710
State:
$9,721
(% of AGI for various income ranges: 2.5% for AGIs below $25k, 0.7% for AGIs $25k-50k, 0.9% for AGIs $50k-75k, 0.4% for AGIs $75k-100k, 1.7% for AGIs $100k-200k, 3.9% for AGIs over 200k)
Net capital gain/loss in AGI: +$10,870 (reported on 9.5% of returns)
Here:
+$10,870
State:
+$35,319
(% of AGI for various income ranges: 0.5% for AGIs $50k-75k, 0.1% for AGIs $75k-100k, 1.5% for AGIs $100k-200k, 5.1% for AGIs over 200k)
Profit/loss from business: +$12,334 (reported on 18.3% of returns)
Here:
+$12,334
State:
+$13,732
(% of AGI for various income ranges: 8.6% for AGIs below $25k, 2.1% for AGIs $25k-50k, 2.7% for AGIs $50k-75k, 2.4% for AGIs $75k-100k, 4.5% for AGIs $100k-200k, 4.4% for AGIs over 200k)
Taxable individual retirement arrangement distribution: $13,845 (reported on 9.1% of returns)
75709:
$13,845
Texas:
$19,511
(% of AGI for various income ranges: 3.2% for AGIs below $25k, 1.2% for AGIs $25k-50k, 2.3% for AGIs $50k-75k, 3.5% for AGIs $75k-100k, 5.1% for AGIs $100k-200k)
Total itemized deductions: $25,075 (20% of AGI, reported on 23.7% of returns)
Here:
$25,075
State:
$24,724
Here:
19.8% of AGI
State:
15.9% of AGI
(% of AGI for various income ranges: 7.1% for AGIs below $25k, 8.8% for AGIs $25k-50k, 12.4% for AGIs $50k-75k, 9.7% for AGIs $75k-100k, 11.5% for AGIs $100k-200k, 10.9% for AGIs over 200k)
Charity contributions: $8,300 (reported on 19.9% of returns)
Here:
$8,300
State:
$6,808
(% of AGI for various income ranges: 0.8% for AGIs below $25k, 1.9% for AGIs $25k-50k, 2.6% for AGIs $50k-75k, 2.8% for AGIs $75k-100k, 2.7% for AGIs $100k-200k, 4.5% for AGIs over 200k)
Taxes paid: $5,731 (reported on 22.8% of returns)
75709:
$5,731
State:
$6,921
(% of AGI for various income ranges: 1.0% for AGIs below $25k, 1.4% for AGIs $25k-50k, 2.4% for AGIs $50k-75k, 2.2% for AGIs $75k-100k, 2.9% for AGIs $100k-200k, 2.8% for AGIs over 200k)
Earned income credit: $2,330 (reported on 22.0% of returns)
Here:
$2,330
State:
$2,570
(% of AGI for various income ranges: 7.6% for AGIs below $25k, 1.1% for AGIs $25k-50k)
Percentage of individuals using paid preparers for their 2012 taxes: 54.4%
Here:
54%
State:
51%
(% for various income ranges: 52.6% for AGIs below $25k, 53.1% for AGIs $25k-50k, 53.1% for AGIs $50k-75k, 52.4% for AGIs $75k-100k, 63.2% for AGIs $100k-200k, 75.0% for AGIs over 200k)
Averages for the 2004 tax year for zip code 75709, filed in 2005:
Average Adjusted Gross Income (AGI) in 2004: $36,094 (Individual Income Tax Returns)
Here:
$36,094
State:
$47,881
Salary/wage: $34,359 (reported on 85.9% of returns)
Here:
$34,359
State:
$41,947
(% of AGI for various income ranges: 132.3% for AGIs below $10k, 80.8% for AGIs $10k-25k, 81.6% for AGIs $25k-50k, 85.2% for AGIs $50k-75k, 82.0% for AGIs $75k-100k, 73.4% for AGIs over 100k)
Taxable interest for individuals: $1,438 (reported on 30.9% of returns)
This zip code:
$1,438
Texas:
$2,255
(% of AGI for various income ranges: 4.4% for AGIs below $10k, 1.7% for AGIs $10k-25k, 1.8% for AGIs $25k-50k, 0.5% for AGIs $50k-75k, 1.4% for AGIs $75k-100k, 0.5% for AGIs over 100k)
Taxable dividends: $1,590 (reported on 11.4% of returns)
Here:
$1,590
State:
$4,261
(% of AGI for various income ranges: 1.2% for AGIs below $10k, 0.4% for AGIs $10k-25k, 0.5% for AGIs $25k-50k, 0.4% for AGIs $50k-75k, 0.4% for AGIs $75k-100k, 0.8% for AGIs over 100k)
Net capital gain/loss: +$1,182 (reported on 10.0% of returns)
Here:
+$1,182
State:
+$16,110
(% of AGI for various income ranges: -0.8% for AGIs below $10k, -0.1% for AGIs $10k-25k, 0.0% for AGIs $25k-50k, 0.5% for AGIs $50k-75k, 1.1% for AGIs $75k-100k, 0.4% for AGIs over 100k)
Profit/loss from business: +$7,020 (reported on 17.3% of returns)
Here:
+$7,020
State:
+$11,013
(% of AGI for various income ranges: 2.1% for AGIs below $10k, 5.7% for AGIs $10k-25k, 2.2% for AGIs $25k-50k, -0.6% for AGIs $50k-75k, 5.0% for AGIs $75k-100k, 6.9% for AGIs over 100k)
IRA payment deduction: $3,000 (reported on 1.5% of returns)
75709:
$3,000
Texas:
$3,120
Total itemized deductions: $16,113 (26% of AGI, reported on 21.7% of returns)
Here:
$16,113
State:
$19,631
Here:
26.3% of AGI
State:
18.9% of AGI
(% of AGI for various income ranges: 9.0% for AGIs $10k-25k, 9.0% for AGIs $25k-50k, 11.7% for AGIs $50k-75k, 10.0% for AGIs $75k-100k, 9.7% for AGIs over 100k)
Charity contributions deductions: $4,904 (8% of AGI, reported on 18.3% of returns)
Here:
$4,904
State:
$4,753
Here:
7.6% of AGI
State:
4.2% of AGI
(% of AGI for various income ranges: 1.2% for AGIs $10k-25k, 1.9% for AGIs $25k-50k, 3.2% for AGIs $50k-75k, 3.3% for AGIs $75k-100k, 2.9% for AGIs over 100k)
Total tax: $5,194 (reported on 69.3% of returns)
75709:
$5,194
State:
$9,058
(% of AGI for various income ranges: 3.1% for AGIs below $10k, 3.2% for AGIs $10k-25k, 6.7% for AGIs $25k-50k, 8.8% for AGIs $50k-75k, 11.3% for AGIs $75k-100k, 20.1% for AGIs over 100k)
Earned income credit: $1,878 (reported on 24.5% of returns)
Here:
$1,878
State:
$2,024
Percentage of individuals using paid preparers for their 2004 taxes: 62.8%
Here:
63%
State:
57%
(% for various income ranges: 54.3% for AGIs below $10k, 66.9% for AGIs $10k-25k, 64.7% for AGIs $25k-50k, 62.9% for AGIs $50k-75k, 61.1% for AGIs $75k-100k, 67.6% for AGIs over 100k)
Household received Food Stamps/SNAP in the past 12 months: 164 Household did not receive Food Stamps/SNAP in the past 12 months: 2,130
Women who had a birth in the past 12 months: 32 (32 now married, 0 unmarried) Women who did not have a birth in the past 12 months: 1,295 (628 now married, 664 unmarried)
Housing units in zip code 75709 with a mortgage: 805 (11 second mortgage, 12 both second mortgage and home equity loan) Median monthly owner costs for units with a mortgage: $1,832 Median monthly owner costs for units without a mortgage: $681
Residents with income below the poverty level in 2022:
This zip code:
9.2%
Whole state:
14.0%
Residents with income below 50% of the poverty level in 2022:
This zip code:
4.0%
Whole state:
7.4%
Median number of rooms in houses and condos:
Here:
6.4
State:
6.3
Median number of rooms in apartments:
Here:
4.1
State:
4.0
Notable locations in this zip code not listed on our city pages
Churches in zip code 75709 include: Spring Hill Church (A), Dean Church (B), Christian Life Assembly of God Church (C), Church of Christ (D), Midway Baptist Church (E), Holiness Church (F). Display/hide their locations on the map
Reservoirs: Lake Placid (A), Lost Pine Lake (B), Greenbrier Lake (C), Greenbriar Lake (D), Bellwood Lake (E), Pleasant Retreat Acres Lake (F), Hidden Hill Lake (G). Display/hide their locations on the map
In group quarters: 12 (-1 institutionalized population)
Size of family households: 655 2-persons, 203 3-persons, 306 4-persons, 61 5-persons, 33 7-or-more-persons
Size of nonfamily households: 924 1-person, 75 2-persons, 56 4-persons
428 married couples with children.
140 single-parent households (118 men, 22 women).
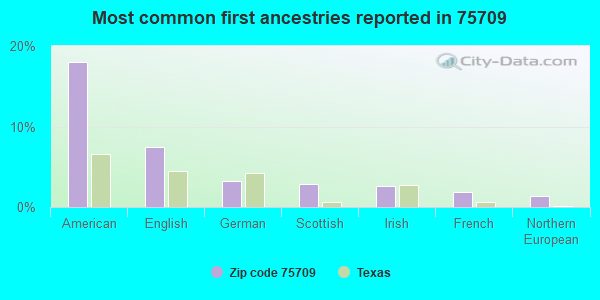
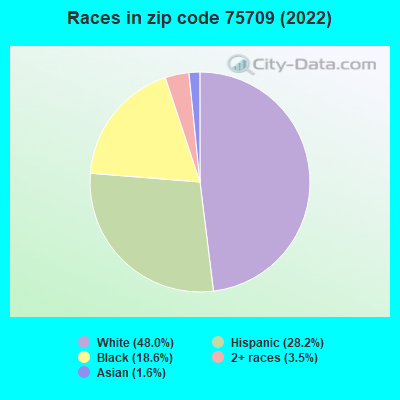
69.1% of residents of 75709 zip code speak English at home.
27.9% of residents speak Spanish at home (70% very well, 20% well, 10% not well).
1.3% of residents speak other Indo-European language at home (61% very well, 39% well).
1.2% of residents speak Asian or Pacific Island language at home (100% very well).
0.5% of residents speak other language at home (100% very well).
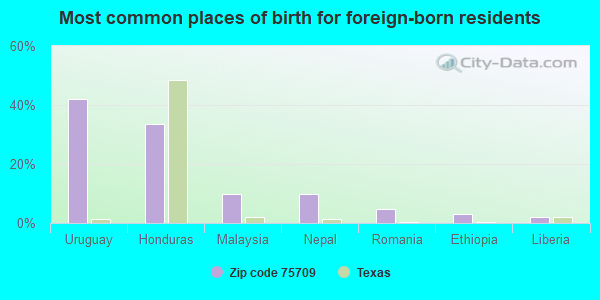
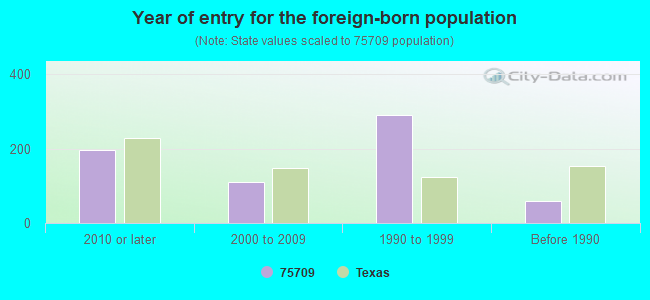
Foreign born population: 464 (9.0%) (27.7% of them are naturalized citizens)
Housing units lacking complete plumbing facilities: 15.8% Housing units lacking complete kitchen facilities: 5.3%
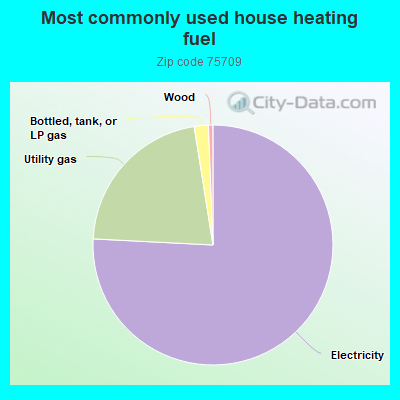
75.9%Electricity
21.7%Utility gas
1.9%Bottled, tank, or LP gas
0.6%Wood
Population in 1990: 1,737. Population change in the 1990s: +1,966 (+113.2%).
Place of birth for U.S.-born residents:
This state: 3,300
Northeast: 138
Midwest: 355
South: 524
West: 171
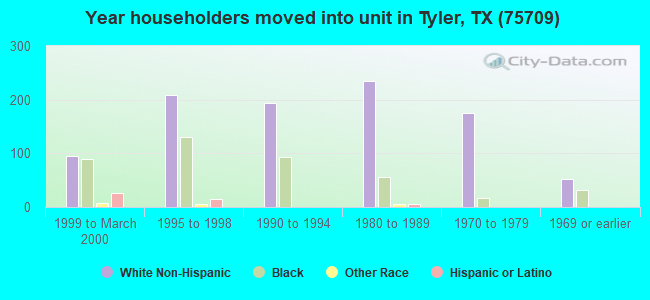
62% of the 75709 zip code residents lived in the same house 5 years ago. Out of people who lived in different houses, 62% lived in this county. Out of people who lived in different counties, 50% lived in Texas.
95% of the 75709 zip code residents lived in the same house 1 year ago. Out of people who lived in different houses, 39% moved from this county. Out of people who lived in different houses, 54% moved from different county within same state. Out of people who lived in different houses, 11% moved from different state.
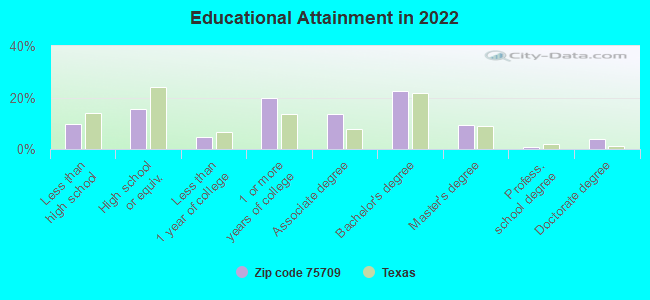
Private vs. public school enrollment:
Students in private schools in grades 1 to 8 (elementary and middle school): 15
Here:
7.7%
Texas:
8.8%
Students in private schools in grades 9 to 12 (high school): 45
Here:
16.7%
Texas:
8.0%
Students in private undergraduate colleges:
Here:
0.0%
Texas:
16.2%
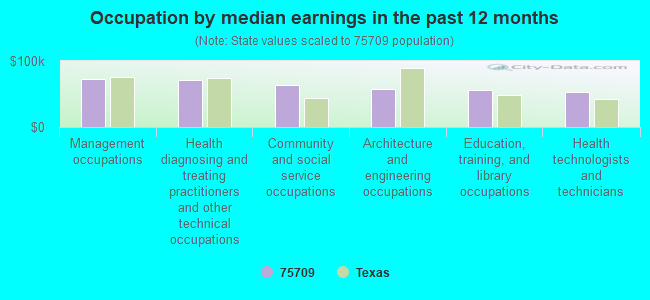
Occupation by median earnings in the past 12 months ($)
72,745Management occupations
70,852Health diagnosing and treating practitioners and other technical occupations
63,345Community and social service occupations
58,235Architecture and engineering occupations
56,531Education, training, and library occupations
52,922Health technologists and technicians
Top industries in this zip code by the number of employees in 2005:
Accommodation and Food Services: Cafeterias (50-99 employees: 1 establishment)
Construction: Drywall and Insulation Contractors (50-99: 1)
Mining: Support Activities for Oil and Gas Operations (10-19: 3)
Wholesale Trade: Recyclable Material Merchant Wholesalers (20-49: 1, 1-4: 2)
Health Care and Social Assistance: Child Day Care Services (20-49: 1, 1-4: 1)
Wholesale Trade: Brick, Stone, and Related Construction Material Merchant Wholesalers (20-49: 1)
Arts, Entertainment, and Recreation: Golf Courses and Country Clubs (20-49: 1)
Wholesale Trade: Construction and Mining (except Oil Well) Machinery and Equipment Merchant Wholesalers (20-49: 1)
People in group quarters in 2010:
9 people in group homes intended for adults
Fatal accident statistics in 2013:
Fatal accident count: 3
Vehicles involved in fatal accidents: 4
Fatal accidents caused by drunken drivers: 1
Fatalities: 3
Persons involved in fatal accidents: 6
Pedestrians involved in fatal accidents: 2
Fatal accident statistics in 2012:
Fatal accident count: 2
Vehicles involved in fatal accidents: 6
Fatal accidents caused by drunken drivers: 0
Fatalities: 3
Persons involved in fatal accidents: 14
Pedestrians involved in fatal accidents: 1
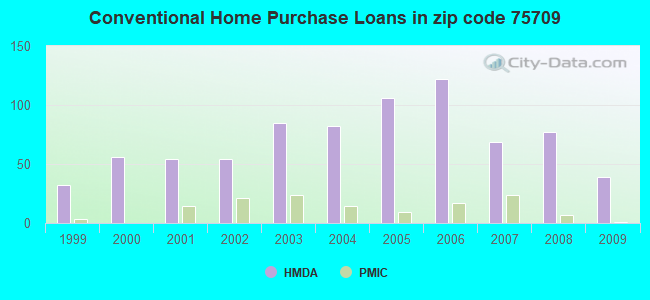
Home Mortgage Disclosure Act Aggregated Statistics For Year 2009 (Based on 4 partial tracts)
A) FHA, FSA/RHS & VA Home Purchase Loans
B) Conventional Home Purchase Loans
C) Refinancings
D) Home Improvement Loans
E) Loans on Dwellings For 5+ Families
F) Non-occupant Loans on < 5 Family Dwellings (A B C & D)
G) Loans On Manufactured Home Dwelling (A B C & D)
Number
Average Value
Number
Average Value
Number
Average Value
Number
Average Value
Number
Average Value
Number
Average Value
Number
Average Value
LOANS ORIGINATED
29
$106,341
39
$289,302
67
$174,918
11
$45,306
2
$135,810
18
$148,705
4
$56,062
APPLICATIONS APPROVED, NOT ACCEPTED
4
$100,512
6
$150,810
17
$84,829
4
$24,782
0
$0
4
$58,665
3
$71,243
APPLICATIONS DENIED
7
$104,121
15
$126,816
46
$136,215
2
$28,595
0
$0
2
$45,350
7
$57,654
APPLICATIONS WITHDRAWN
6
$146,483
10
$150,002
13
$135,058
1
$40,170
0
$0
0
$0
2
$112,420
FILES CLOSED FOR INCOMPLETENESS
0
$0
3
$129,140
7
$286,204
0
$0
0
$0
3
$111,667
2
$16,600
Aggregated Statistics For Year 2008 (Based on 4 partial tracts)
A) FHA, FSA/RHS & VA Home Purchase Loans
B) Conventional Home Purchase Loans
C) Refinancings
D) Home Improvement Loans
F) Non-occupant Loans on < 5 Family Dwellings (A B C & D)
G) Loans On Manufactured Home Dwelling (A B C & D)
Number
Average Value
Number
Average Value
Number
Average Value
Number
Average Value
Number
Average Value
Number
Average Value
LOANS ORIGINATED
26
$101,740
77
$297,916
43
$190,258
25
$41,372
28
$361,910
6
$67,163
APPLICATIONS APPROVED, NOT ACCEPTED
3
$139,710
11
$120,785
8
$78,020
4
$50,765
0
$0
9
$62,154
APPLICATIONS DENIED
9
$115,039
35
$154,457
52
$95,023
29
$32,183
3
$161,283
17
$38,571
APPLICATIONS WITHDRAWN
4
$79,795
14
$166,724
21
$102,276
0
$0
2
$301,460
0
$0
FILES CLOSED FOR INCOMPLETENESS
2
$66,395
3
$310,750
5
$106,202
0
$0
1
$55,140
2
$66,395
Aggregated Statistics For Year 2007 (Based on 4 partial tracts)
A) FHA, FSA/RHS & VA Home Purchase Loans
B) Conventional Home Purchase Loans
C) Refinancings
D) Home Improvement Loans
F) Non-occupant Loans on < 5 Family Dwellings (A B C & D)
G) Loans On Manufactured Home Dwelling (A B C & D)
Number
Average Value
Number
Average Value
Number
Average Value
Number
Average Value
Number
Average Value
Number
Average Value
LOANS ORIGINATED
14
$124,161
69
$213,450
69
$123,261
30
$32,899
10
$69,280
14
$55,461
APPLICATIONS APPROVED, NOT ACCEPTED
3
$108,927
22
$135,486
14
$93,606
3
$87,497
2
$54,235
8
$61,420
APPLICATIONS DENIED
3
$145,907
35
$114,044
118
$107,241
24
$26,192
7
$102,037
13
$51,138
APPLICATIONS WITHDRAWN
2
$130,530
6
$73,557
41
$99,424
5
$23,584
1
$37,440
0
$0
FILES CLOSED FOR INCOMPLETENESS
0
$0
2
$99,905
10
$114,827
0
$0
0
$0
0
$0
Aggregated Statistics For Year 2006 (Based on 4 partial tracts)
A) FHA, FSA/RHS & VA Home Purchase Loans
B) Conventional Home Purchase Loans
C) Refinancings
D) Home Improvement Loans
F) Non-occupant Loans on < 5 Family Dwellings (A B C & D)
G) Loans On Manufactured Home Dwelling (A B C & D)
Number
Average Value
Number
Average Value
Number
Average Value
Number
Average Value
Number
Average Value
Number
Average Value
LOANS ORIGINATED
24
$103,962
122
$113,137
72
$136,133
20
$34,402
14
$93,899
10
$55,504
APPLICATIONS APPROVED, NOT ACCEPTED
2
$57,495
27
$55,369
22
$129,235
6
$31,643
2
$65,615
14
$44,657
APPLICATIONS DENIED
3
$109,383
63
$83,424
130
$107,856
20
$43,862
12
$91,092
21
$38,215
APPLICATIONS WITHDRAWN
3
$82,003
25
$189,079
93
$109,311
6
$89,958
1
$85,100
0
$0
FILES CLOSED FOR INCOMPLETENESS
0
$0
10
$99,509
15
$108,568
0
$0
0
$0
0
$0
Aggregated Statistics For Year 2005 (Based on 4 partial tracts)
A) FHA, FSA/RHS & VA Home Purchase Loans
B) Conventional Home Purchase Loans
C) Refinancings
D) Home Improvement Loans
F) Non-occupant Loans on < 5 Family Dwellings (A B C & D)
G) Loans On Manufactured Home Dwelling (A B C & D)
Number
Average Value
Number
Average Value
Number
Average Value
Number
Average Value
Number
Average Value
Number
Average Value
LOANS ORIGINATED
20
$97,751
106
$81,554
97
$94,148
29
$100,476
31
$75,695
4
$50,952
APPLICATIONS APPROVED, NOT ACCEPTED
0
$0
27
$56,213
19
$86,262
3
$15,533
2
$38,380
15
$47,167
APPLICATIONS DENIED
0
$0
78
$90,020
154
$96,250
27
$51,869
17
$61,371
24
$52,392
APPLICATIONS WITHDRAWN
7
$105,213
22
$136,756
91
$113,643
14
$143,273
4
$57,238
3
$62,490
FILES CLOSED FOR INCOMPLETENESS
0
$0
8
$128,472
21
$106,548
0
$0
0
$0
0
$0
Aggregated Statistics For Year 2004 (Based on 4 partial tracts)
A) FHA, FSA/RHS & VA Home Purchase Loans
B) Conventional Home Purchase Loans
C) Refinancings
D) Home Improvement Loans
F) Non-occupant Loans on < 5 Family Dwellings (A B C & D)
G) Loans On Manufactured Home Dwelling (A B C & D)
Number
Average Value
Number
Average Value
Number
Average Value
Number
Average Value
Number
Average Value
Number
Average Value
LOANS ORIGINATED
18
$98,648
82
$89,193
104
$92,520
18
$37,804
26
$93,534
10
$47,106
APPLICATIONS APPROVED, NOT ACCEPTED
0
$0
17
$64,814
15
$101,241
5
$40,262
2
$124,495
10
$35,234
APPLICATIONS DENIED
3
$69,620
57
$58,417
154
$93,442
37
$53,525
9
$106,479
28
$42,298
APPLICATIONS WITHDRAWN
2
$54,325
8
$136,258
84
$90,657
5
$73,492
2
$49,300
2
$80,410
FILES CLOSED FOR INCOMPLETENESS
0
$0
10
$63,784
44
$79,978
0
$0
0
$0
0
$0
Aggregated Statistics For Year 2003 (Based on 4 partial tracts)
A) FHA, FSA/RHS & VA Home Purchase Loans
B) Conventional Home Purchase Loans
C) Refinancings
D) Home Improvement Loans
F) Non-occupant Loans on < 5 Family Dwellings (A B C & D)
Number
Average Value
Number
Average Value
Number
Average Value
Number
Average Value
Number
Average Value
LOANS ORIGINATED
13
$93,087
85
$75,342
156
$78,921
21
$14,881
5
$60,356
APPLICATIONS APPROVED, NOT ACCEPTED
2
$27,915
16
$75,036
25
$72,070
3
$20,140
3
$63,073
APPLICATIONS DENIED
7
$100,221
39
$47,937
122
$74,823
30
$17,562
5
$82,184
APPLICATIONS WITHDRAWN
3
$47,480
9
$84,534
83
$85,028
0
$0
4
$68,260
FILES CLOSED FOR INCOMPLETENESS
0
$0
2
$57,700
8
$88,209
0
$0
0
$0
Aggregated Statistics For Year 2002 (Based on 2 partial tracts)
A) FHA, FSA/RHS & VA Home Purchase Loans
B) Conventional Home Purchase Loans
C) Refinancings
D) Home Improvement Loans
F) Non-occupant Loans on < 5 Family Dwellings (A B C & D)
Number
Average Value
Number
Average Value
Number
Average Value
Number
Average Value
Number
Average Value
LOANS ORIGINATED
17
$82,108
54
$83,246
88
$88,002
14
$40,204
14
$66,719
APPLICATIONS APPROVED, NOT ACCEPTED
2
$72,430
5
$45,270
6
$59,857
3
$8,047
0
$0
APPLICATIONS DENIED
2
$46,025
23
$48,813
53
$66,766
9
$8,887
0
$0
APPLICATIONS WITHDRAWN
3
$77,967
6
$98,588
41
$81,964
2
$11,320
0
$0
FILES CLOSED FOR INCOMPLETENESS
0
$0
3
$61,870
8
$67,339
2
$12,825
0
$0
Aggregated Statistics For Year 2001 (Based on 2 partial tracts)
A) FHA, FSA/RHS & VA Home Purchase Loans
B) Conventional Home Purchase Loans
C) Refinancings
D) Home Improvement Loans
F) Non-occupant Loans on < 5 Family Dwellings (A B C & D)
Number
Average Value
Number
Average Value
Number
Average Value
Number
Average Value
Number
Average Value
LOANS ORIGINATED
23
$81,092
54
$79,614
50
$75,842
17
$11,184
11
$48,563
APPLICATIONS APPROVED, NOT ACCEPTED
3
$64,383
17
$56,454
6
$49,293
0
$0
0
$0
APPLICATIONS DENIED
0
$0
51
$53,259
48
$113,930
12
$21,503
0
$0
APPLICATIONS WITHDRAWN
0
$0
12
$84,630
36
$74,151
5
$6,036
0
$0
FILES CLOSED FOR INCOMPLETENESS
0
$0
0
$0
8
$104,121
0
$0
0
$0
Aggregated Statistics For Year 2000 (Based on 2 partial tracts)
A) FHA, FSA/RHS & VA Home Purchase Loans
B) Conventional Home Purchase Loans
C) Refinancings
D) Home Improvement Loans
F) Non-occupant Loans on < 5 Family Dwellings (A B C & D)
Number
Average Value
Number
Average Value
Number
Average Value
Number
Average Value
Number
Average Value
LOANS ORIGINATED
18
$84,923
56
$56,453
35
$55,402
21
$13,653
15
$42,554
APPLICATIONS APPROVED, NOT ACCEPTED
2
$70,170
15
$58,549
14
$62,839
3
$50,803
2
$71,680
APPLICATIONS DENIED
0
$0
77
$48,190
23
$62,787
15
$15,995
2
$26,410
APPLICATIONS WITHDRAWN
3
$100,097
14
$75,558
18
$65,222
2
$2,265
2
$10,565
FILES CLOSED FOR INCOMPLETENESS
0
$0
6
$55,582
6
$98,588
0
$0
0
$0
Aggregated Statistics For Year 1999 (Based on 1 partial tract)
A) FHA, FSA/RHS & VA Home Purchase Loans
B) Conventional Home Purchase Loans
C) Refinancings
D) Home Improvement Loans
F) Non-occupant Loans on < 5 Family Dwellings (A B C & D)


 Nearest zip codes: 75762, 75701, 75702, 75703, 75704, 75758.