Estimated zip code population in 2022: 13,528
Zip code population in 2010: 13,947
Zip code population in 2000: 15,652
Houses and condos: 5,243
Renter-occupied apartments: 2,439
% of renters here:
52%State:
38%
March 2022 cost of living index in zip code 75223: 94.8
(less than average, U.S. average is 100)
Land area: 3.5
sq. mi.
Water area: 0.0
sq. mi.
Population density: 3,919 people per square mile (average).
OSM Map
General Map
Google Map
MSN Map
OSM Map
General Map
Google Map
MSN Map
OSM Map
General Map
Google Map
MSN Map
OSM Map
General Map
Google Map
MSN Map
Please wait while loading the map...
Real estate property taxes paid for housing units in 2022:
This zip code:
1.0% ($2,554)Texas:
1.5% ($4,050)
Median real estate property taxes paid for housing units with mortgages in 2022: $7,850 (1.5%)
Median real estate property taxes paid for housing units with no mortgage in 2022: $2,013 (1.0%)
Profiles of local businesses
Business Search - 14 Million verified businesses
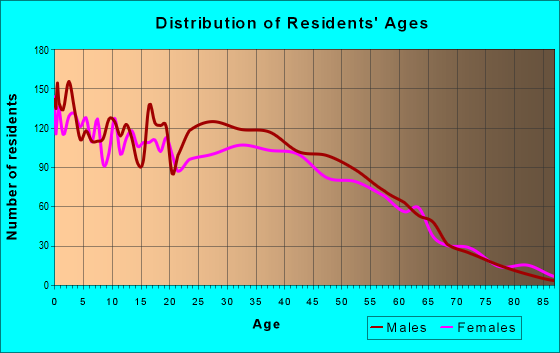
Males: 7,326 Females: 6,202
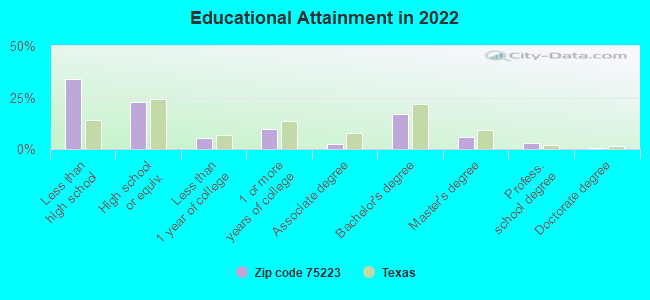
For population 25 years and over in 75223:
High school or higher: 64.7%Bachelor's degree or higher: 25.6%Graduate or professional degree: 9.0%Unemployed: 6.3%Mean travel time to work (commute): 27.2 minutes
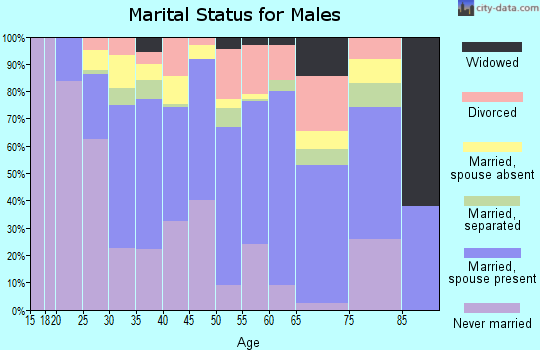
For population 15 years and over in 75223:
Never married: 42.5%Now married: 41.0%Separated: 2.7%Widowed: 5.9%Divorced: 7.9%
Zip code 75223 compared to state average:
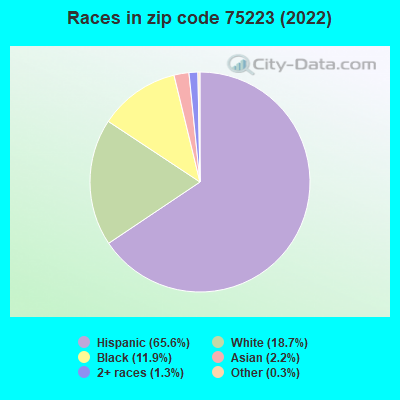
Foreign-born population percentage above state average. Length of stay since moving in significantly above state average. House age significantly above state average. 8,868 65.6% Hispanic or Latino 2,532 18.7% White 1,612 11.9% Black 291 2.2% Asian 172 1.3% Two or more races 46 0.3% Some other race 5 0.04% American Indian
Data:
Median household income ($)
Median household income (% change since 2000)
Household income diversity
Ratio of average income to average house value (%)
Ratio of average income to average rent
Median household income ($) - White
Median household income ($) - Black or African American
Median household income ($) - Asian
Median household income ($) - Hispanic or Latino
Median household income ($) - American Indian and Alaska Native
Median household income ($) - Multirace
Median household income ($) - Other Race
Median household income for houses/condos with a mortgage ($)
Median household income for apartments without a mortgage ($)
Races - White alone (%)
Races - White alone (% change since 2000)
Races - Black alone (%)
Races - Black alone (% change since 2000)
Races - American Indian alone (%)
Races - American Indian alone (% change since 2000)
Races - Asian alone (%)
Races - Asian alone (% change since 2000)
Races - Hispanic (%)
Races - Hispanic (% change since 2000)
Races - Native Hawaiian and Other Pacific Islander alone (%)
Races - Native Hawaiian and Other Pacific Islander alone (% change since 2000)
Races - Two or more races (%)
Races - Two or more races (% change since 2000)
Races - Other race alone (%)
Races - Other race alone (% change since 2000)
Racial diversity
Unemployment (%)
Unemployment (% change since 2000)
Unemployment (%) - White
Unemployment (%) - Black or African American
Unemployment (%) - Asian
Unemployment (%) - Hispanic or Latino
Unemployment (%) - American Indian and Alaska Native
Unemployment (%) - Multirace
Unemployment (%) - Other Race
Population density (people per square mile)
Population - Males (%)
Population - Females (%)
Population - Males (%) - White
Population - Males (%) - Black or African American
Population - Males (%) - Asian
Population - Males (%) - Hispanic or Latino
Population - Males (%) - American Indian and Alaska Native
Population - Males (%) - Multirace
Population - Males (%) - Other Race
Population - Females (%) - White
Population - Females (%) - Black or African American
Population - Females (%) - Asian
Population - Females (%) - Hispanic or Latino
Population - Females (%) - American Indian and Alaska Native
Population - Females (%) - Multirace
Population - Females (%) - Other Race
Coronavirus confirmed cases (Jun 08, 2024)
Deaths caused by coronavirus (Jun 08, 2024)
Coronavirus confirmed cases (per 100k population) (Jun 08, 2024)
Deaths caused by coronavirus (per 100k population) (Jun 08, 2024)
Daily increase in number of cases (Jun 08, 2024)
Weekly increase in number of cases (Jun 08, 2024)
Cases doubled (in days) (Jun 08, 2024)
Hospitalized patients (Apr 18, 2022)
Negative test results (Apr 18, 2022)
Total test results (Apr 18, 2022)
COVID Vaccine doses distributed (per 100k population) (Sep 19, 2023)
COVID Vaccine doses administered (per 100k population) (Sep 19, 2023)
COVID Vaccine doses distributed (Sep 19, 2023)
COVID Vaccine doses administered (Sep 19, 2023)
Likely homosexual households (%)
Likely homosexual households (% change since 2000)
Likely homosexual households - Lesbian couples (%)
Likely homosexual households - Lesbian couples (% change since 2000)
Likely homosexual households - Gay men (%)
Likely homosexual households - Gay men (% change since 2000)
Cost of living index
Median gross rent ($)
Median contract rent ($)
Median monthly housing costs ($)
Median house or condo value ($)
Median house or condo value ($ change since 2000)
Mean house or condo value by units in structure - 1, detached ($)
Mean house or condo value by units in structure - 1, attached ($)
Mean house or condo value by units in structure - 2 ($)
Mean house or condo value by units in structure by units in structure - 3 or 4 ($)
Mean house or condo value by units in structure - 5 or more ($)
Mean house or condo value by units in structure - Boat, RV, van, etc. ($)
Mean house or condo value by units in structure - Mobile home ($)
Median house or condo value ($) - White
Median house or condo value ($) - Black or African American
Median house or condo value ($) - Asian
Median house or condo value ($) - Hispanic or Latino
Median house or condo value ($) - American Indian and Alaska Native
Median house or condo value ($) - Multirace
Median house or condo value ($) - Other Race
Median resident age
Resident age diversity
Median resident age - Males
Median resident age - Females
Median resident age - White
Median resident age - Black or African American
Median resident age - Asian
Median resident age - Hispanic or Latino
Median resident age - American Indian and Alaska Native
Median resident age - Multirace
Median resident age - Other Race
Median resident age - Males - White
Median resident age - Males - Black or African American
Median resident age - Males - Asian
Median resident age - Males - Hispanic or Latino
Median resident age - Males - American Indian and Alaska Native
Median resident age - Males - Multirace
Median resident age - Males - Other Race
Median resident age - Females - White
Median resident age - Females - Black or African American
Median resident age - Females - Asian
Median resident age - Females - Hispanic or Latino
Median resident age - Females - American Indian and Alaska Native
Median resident age - Females - Multirace
Median resident age - Females - Other Race
Commute - mean travel time to work (minutes)
Travel time to work - Less than 5 minutes (%)
Travel time to work - Less than 5 minutes (% change since 2000)
Travel time to work - 5 to 9 minutes (%)
Travel time to work - 5 to 9 minutes (% change since 2000)
Travel time to work - 10 to 19 minutes (%)
Travel time to work - 10 to 19 minutes (% change since 2000)
Travel time to work - 20 to 29 minutes (%)
Travel time to work - 20 to 29 minutes (% change since 2000)
Travel time to work - 30 to 39 minutes (%)
Travel time to work - 30 to 39 minutes (% change since 2000)
Travel time to work - 40 to 59 minutes (%)
Travel time to work - 40 to 59 minutes (% change since 2000)
Travel time to work - 60 to 89 minutes (%)
Travel time to work - 60 to 89 minutes (% change since 2000)
Travel time to work - 90 or more minutes (%)
Travel time to work - 90 or more minutes (% change since 2000)
Marital status - Never married (%)
Marital status - Now married (%)
Marital status - Separated (%)
Marital status - Widowed (%)
Marital status - Divorced (%)
Median family income ($)
Median family income (% change since 2000)
Median non-family income ($)
Median non-family income (% change since 2000)
Median per capita income ($)
Median per capita income (% change since 2000)
Median family income ($) - White
Median family income ($) - Black or African American
Median family income ($) - Asian
Median family income ($) - Hispanic or Latino
Median family income ($) - American Indian and Alaska Native
Median family income ($) - Multirace
Median family income ($) - Other Race
Median year house/condo built
Median year apartment built
Year house built - Built 2005 or later (%)
Year house built - Built 2000 to 2004 (%)
Year house built - Built 1990 to 1999 (%)
Year house built - Built 1980 to 1989 (%)
Year house built - Built 1970 to 1979 (%)
Year house built - Built 1960 to 1969 (%)
Year house built - Built 1950 to 1959 (%)
Year house built - Built 1940 to 1949 (%)
Year house built - Built 1939 or earlier (%)
Average household size
Household density (households per square mile)
Average household size - White
Average household size - Black or African American
Average household size - Asian
Average household size - Hispanic or Latino
Average household size - American Indian and Alaska Native
Average household size - Multirace
Average household size - Other Race
Occupied housing units (%)
Vacant housing units (%)
Owner occupied housing units (%)
Renter occupied housing units (%)
Vacancy status - For rent (%)
Vacancy status - For sale only (%)
Vacancy status - Rented or sold, not occupied (%)
Vacancy status - For seasonal, recreational, or occasional use (%)
Vacancy status - For migrant workers (%)
Vacancy status - Other vacant (%)
Residents with income below the poverty level (%)
Residents with income below 50% of the poverty level (%)
Children below poverty level (%)
Poor families by family type - Married-couple family (%)
Poor families by family type - Male, no wife present (%)
Poor families by family type - Female, no husband present (%)
Poverty status for native-born residents (%)
Poverty status for foreign-born residents (%)
Poverty among high school graduates not in families (%)
Poverty among people who did not graduate high school not in families (%)
Residents with income below the poverty level (%) - White
Residents with income below the poverty level (%) - Black or African American
Residents with income below the poverty level (%) - Asian
Residents with income below the poverty level (%) - Hispanic or Latino
Residents with income below the poverty level (%) - American Indian and Alaska Native
Residents with income below the poverty level (%) - Multirace
Residents with income below the poverty level (%) - Other Race
Air pollution - Air Quality Index (AQI)
Air pollution - CO
Air pollution - NO2
Air pollution - SO2
Air pollution - Ozone
Air pollution - PM10
Air pollution - PM25
Air pollution - Pb
Crime - Murders per 100,000 population
Crime - Rapes per 100,000 population
Crime - Robberies per 100,000 population
Crime - Assaults per 100,000 population
Crime - Burglaries per 100,000 population
Crime - Thefts per 100,000 population
Crime - Auto thefts per 100,000 population
Crime - Arson per 100,000 population
Crime - City-data.com crime index
Crime - Violent crime index
Crime - Property crime index
Crime - Murders per 100,000 population (5 year average)
Crime - Rapes per 100,000 population (5 year average)
Crime - Robberies per 100,000 population (5 year average)
Crime - Assaults per 100,000 population (5 year average)
Crime - Burglaries per 100,000 population (5 year average)
Crime - Thefts per 100,000 population (5 year average)
Crime - Auto thefts per 100,000 population (5 year average)
Crime - Arson per 100,000 population (5 year average)
Crime - City-data.com crime index (5 year average)
Crime - Violent crime index (5 year average)
Crime - Property crime index (5 year average)
1996 Presidential Elections Results (%) - Democratic Party (Clinton)
1996 Presidential Elections Results (%) - Republican Party (Dole)
1996 Presidential Elections Results (%) - Other
2000 Presidential Elections Results (%) - Democratic Party (Gore)
2000 Presidential Elections Results (%) - Republican Party (Bush)
2000 Presidential Elections Results (%) - Other
2004 Presidential Elections Results (%) - Democratic Party (Kerry)
2004 Presidential Elections Results (%) - Republican Party (Bush)
2004 Presidential Elections Results (%) - Other
2008 Presidential Elections Results (%) - Democratic Party (Obama)
2008 Presidential Elections Results (%) - Republican Party (McCain)
2008 Presidential Elections Results (%) - Other
2012 Presidential Elections Results (%) - Democratic Party (Obama)
2012 Presidential Elections Results (%) - Republican Party (Romney)
2012 Presidential Elections Results (%) - Other
2016 Presidential Elections Results (%) - Democratic Party (Clinton)
2016 Presidential Elections Results (%) - Republican Party (Trump)
2016 Presidential Elections Results (%) - Other
2020 Presidential Elections Results (%) - Democratic Party (Biden)
2020 Presidential Elections Results (%) - Republican Party (Trump)
2020 Presidential Elections Results (%) - Other
Ancestries Reported - Arab (%)
Ancestries Reported - Czech (%)
Ancestries Reported - Danish (%)
Ancestries Reported - Dutch (%)
Ancestries Reported - English (%)
Ancestries Reported - French (%)
Ancestries Reported - French Canadian (%)
Ancestries Reported - German (%)
Ancestries Reported - Greek (%)
Ancestries Reported - Hungarian (%)
Ancestries Reported - Irish (%)
Ancestries Reported - Italian (%)
Ancestries Reported - Lithuanian (%)
Ancestries Reported - Norwegian (%)
Ancestries Reported - Polish (%)
Ancestries Reported - Portuguese (%)
Ancestries Reported - Russian (%)
Ancestries Reported - Scotch-Irish (%)
Ancestries Reported - Scottish (%)
Ancestries Reported - Slovak (%)
Ancestries Reported - Subsaharan African (%)
Ancestries Reported - Swedish (%)
Ancestries Reported - Swiss (%)
Ancestries Reported - Ukrainian (%)
Ancestries Reported - United States (%)
Ancestries Reported - Welsh (%)
Ancestries Reported - West Indian (%)
Ancestries Reported - Other (%)
Educational Attainment - No schooling completed (%)
Educational Attainment - Less than high school (%)
Educational Attainment - High school or equivalent (%)
Educational Attainment - Less than 1 year of college (%)
Educational Attainment - 1 or more years of college (%)
Educational Attainment - Associate degree (%)
Educational Attainment - Bachelor's degree (%)
Educational Attainment - Master's degree (%)
Educational Attainment - Professional school degree (%)
Educational Attainment - Doctorate degree (%)
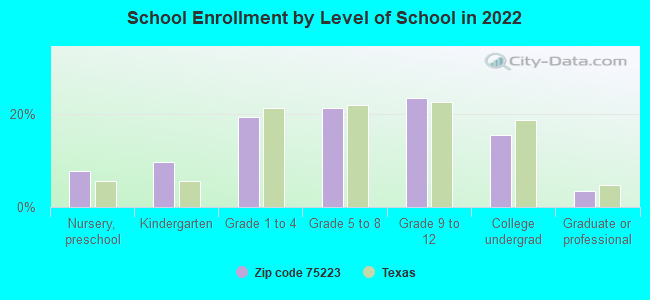
School Enrollment - Nursery, preschool (%)
School Enrollment - Kindergarten (%)
School Enrollment - Grade 1 to 4 (%)
School Enrollment - Grade 5 to 8 (%)
School Enrollment - Grade 9 to 12 (%)
School Enrollment - College undergrad (%)
School Enrollment - Graduate or professional (%)
School Enrollment - Not enrolled in school (%)
School enrollment - Public schools (%)
School enrollment - Private schools (%)
School enrollment - Not enrolled (%)
Median number of rooms in houses and condos
Median number of rooms in apartments
Housing units lacking complete plumbing facilities (%)
Housing units lacking complete kitchen facilities (%)
Density of houses
Urban houses (%)
Rural houses (%)
Households with people 60 years and over (%)
Households with people 65 years and over (%)
Households with people 75 years and over (%)
Households with one or more nonrelatives (%)
Households with no nonrelatives (%)
Population in households (%)
Family households (%)
Nonfamily households (%)
Population in families (%)
Family households with own children (%)
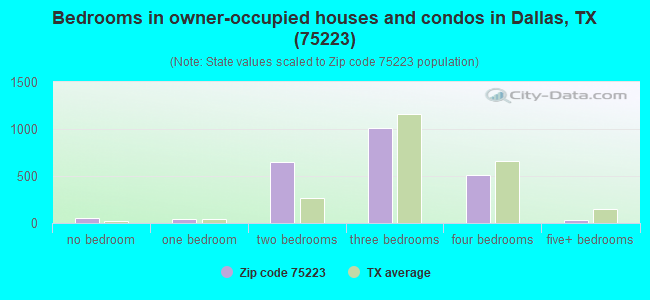
Median number of bedrooms in owner occupied houses
Mean number of bedrooms in owner occupied houses
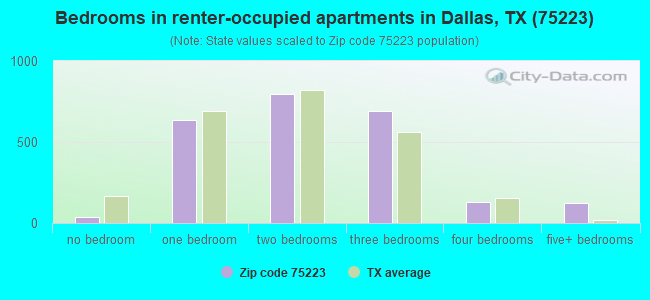
Median number of bedrooms in renter occupied houses
Mean number of bedrooms in renter occupied houses
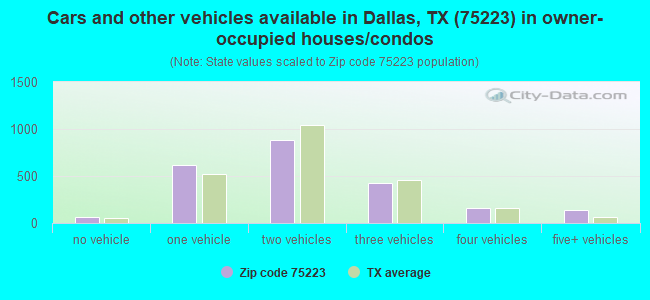
Median number of vehichles in owner occupied houses
Mean number of vehichles in owner occupied houses
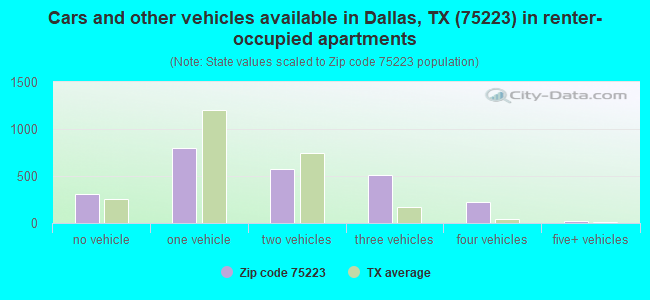
Median number of vehichles in renter occupied houses
Mean number of vehichles in renter occupied houses
Mortgage status - with mortgage (%)
Mortgage status - with second mortgage (%)
Mortgage status - with home equity loan (%)
Mortgage status - with both second mortgage and home equity loan (%)
Mortgage status - without a mortgage (%)
Average family size
Average family size - White
Average family size - Black or African American
Average family size - Asian
Average family size - Hispanic or Latino
Average family size - American Indian and Alaska Native
Average family size - Multirace
Average family size - Other Race
Geographical mobility - Same house 1 year ago (%)
Geographical mobility - Moved within same county (%)
Geographical mobility - Moved from different county within same state (%)
Geographical mobility - Moved from different state (%)
Geographical mobility - Moved from abroad (%)
Place of birth - Born in state of residence (%)
Place of birth - Born in other state (%)
Place of birth - Native, outside of US (%)
Place of birth - Foreign born (%)
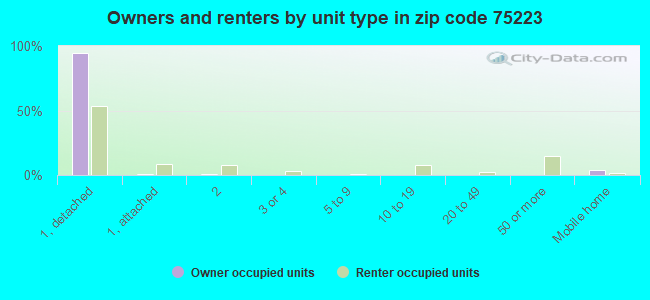
Housing units in structures - 1, detached (%)
Housing units in structures - 1, attached (%)
Housing units in structures - 2 (%)
Housing units in structures - 3 or 4 (%)
Housing units in structures - 5 to 9 (%)
Housing units in structures - 10 to 19 (%)
Housing units in structures - 20 to 49 (%)
Housing units in structures - 50 or more (%)
Housing units in structures - Mobile home (%)
Housing units in structures - Boat, RV, van, etc. (%)
House/condo owner moved in on average (years ago)
Renter moved in on average (years ago)
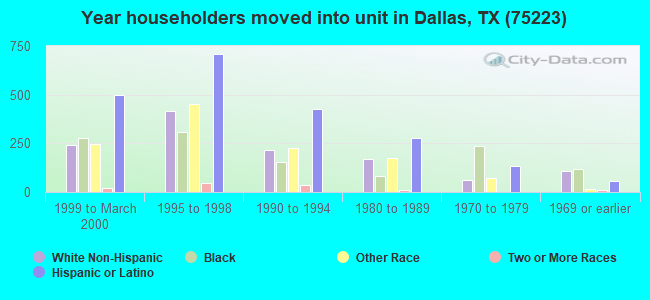
Year householder moved into unit - Moved in 1999 to March 2000 (%)
Year householder moved into unit - Moved in 1995 to 1998 (%)
Year householder moved into unit - Moved in 1990 to 1994 (%)
Year householder moved into unit - Moved in 1980 to 1989 (%)
Year householder moved into unit - Moved in 1970 to 1979 (%)
Year householder moved into unit - Moved in 1969 or earlier (%)
Means of transportation to work - Drove car alone (%)
Means of transportation to work - Carpooled (%)
Means of transportation to work - Public transportation (%)
Means of transportation to work - Bus or trolley bus (%)
Means of transportation to work - Streetcar or trolley car (%)
Means of transportation to work - Subway or elevated (%)
Means of transportation to work - Railroad (%)
Means of transportation to work - Ferryboat (%)
Means of transportation to work - Taxicab (%)
Means of transportation to work - Motorcycle (%)
Means of transportation to work - Bicycle (%)
Means of transportation to work - Walked (%)
Means of transportation to work - Other means (%)
Working at home (%)
Industry diversity
Most Common Industries - Agriculture, forestry, fishing and hunting, and mining (%)
Most Common Industries - Agriculture, forestry, fishing and hunting (%)
Most Common Industries - Mining, quarrying, and oil and gas extraction (%)
Most Common Industries - Construction (%)
Most Common Industries - Manufacturing (%)
Most Common Industries - Wholesale trade (%)
Most Common Industries - Retail trade (%)
Most Common Industries - Transportation and warehousing, and utilities (%)
Most Common Industries - Transportation and warehousing (%)
Most Common Industries - Utilities (%)
Most Common Industries - Information (%)
Most Common Industries - Finance and insurance, and real estate and rental and leasing (%)
Most Common Industries - Finance and insurance (%)
Most Common Industries - Real estate and rental and leasing (%)
Most Common Industries - Professional, scientific, and management, and administrative and waste management services (%)
Most Common Industries - Professional, scientific, and technical services (%)
Most Common Industries - Management of companies and enterprises (%)
Most Common Industries - Administrative and support and waste management services (%)
Most Common Industries - Educational services, and health care and social assistance (%)
Most Common Industries - Educational services (%)
Most Common Industries - Health care and social assistance (%)
Most Common Industries - Arts, entertainment, and recreation, and accommodation and food services (%)
Most Common Industries - Arts, entertainment, and recreation (%)
Most Common Industries - Accommodation and food services (%)
Most Common Industries - Other services, except public administration (%)
Most Common Industries - Public administration (%)
Occupation diversity
Most Common Occupations - Management, business, science, and arts occupations (%)
Most Common Occupations - Management, business, and financial occupations (%)
Most Common Occupations - Management occupations (%)
Most Common Occupations - Business and financial operations occupations (%)
Most Common Occupations - Computer, engineering, and science occupations (%)
Most Common Occupations - Computer and mathematical occupations (%)
Most Common Occupations - Architecture and engineering occupations (%)
Most Common Occupations - Life, physical, and social science occupations (%)
Most Common Occupations - Education, legal, community service, arts, and media occupations (%)
Most Common Occupations - Community and social service occupations (%)
Most Common Occupations - Legal occupations (%)
Most Common Occupations - Education, training, and library occupations (%)
Most Common Occupations - Arts, design, entertainment, sports, and media occupations (%)
Most Common Occupations - Healthcare practitioners and technical occupations (%)
Most Common Occupations - Health diagnosing and treating practitioners and other technical occupations (%)
Most Common Occupations - Health technologists and technicians (%)
Most Common Occupations - Service occupations (%)
Most Common Occupations - Healthcare support occupations (%)
Most Common Occupations - Protective service occupations (%)
Most Common Occupations - Fire fighting and prevention, and other protective service workers including supervisors (%)
Most Common Occupations - Law enforcement workers including supervisors (%)
Most Common Occupations - Food preparation and serving related occupations (%)
Most Common Occupations - Building and grounds cleaning and maintenance occupations (%)
Most Common Occupations - Personal care and service occupations (%)
Most Common Occupations - Sales and office occupations (%)
Most Common Occupations - Sales and related occupations (%)
Most Common Occupations - Office and administrative support occupations (%)
Most Common Occupations - Natural resources, construction, and maintenance occupations (%)
Most Common Occupations - Farming, fishing, and forestry occupations (%)
Most Common Occupations - Construction and extraction occupations (%)
Most Common Occupations - Installation, maintenance, and repair occupations (%)
Most Common Occupations - Production, transportation, and material moving occupations (%)
Most Common Occupations - Production occupations (%)
Most Common Occupations - Transportation occupations (%)
Most Common Occupations - Material moving occupations (%)
People in Group quarters - Institutionalized population (%)
People in Group quarters - Correctional institutions (%)
People in Group quarters - Federal prisons and detention centers (%)
People in Group quarters - Halfway houses (%)
People in Group quarters - Local jails and other confinement facilities (including police lockups) (%)
People in Group quarters - Military disciplinary barracks (%)
People in Group quarters - State prisons (%)
People in Group quarters - Other types of correctional institutions (%)
People in Group quarters - Nursing homes (%)
People in Group quarters - Hospitals/wards, hospices, and schools for the handicapped (%)
People in Group quarters - Hospitals/wards and hospices for chronically ill (%)
People in Group quarters - Hospices or homes for chronically ill (%)
People in Group quarters - Military hospitals or wards for chronically ill (%)
People in Group quarters - Other hospitals or wards for chronically ill (%)
People in Group quarters - Hospitals or wards for drug/alcohol abuse (%)
People in Group quarters - Mental (Psychiatric) hospitals or wards (%)
People in Group quarters - Schools, hospitals, or wards for the mentally retarded (%)
People in Group quarters - Schools, hospitals, or wards for the physically handicapped (%)
People in Group quarters - Institutions for the deaf (%)
People in Group quarters - Institutions for the blind (%)
People in Group quarters - Orthopedic wards and institutions for the physically handicapped (%)
People in Group quarters - Wards in general hospitals for patients who have no usual home elsewhere (%)
People in Group quarters - Wards in military hospitals for patients who have no usual home elsewhere (%)
People in Group quarters - Juvenile institutions (%)
People in Group quarters - Long-term care (%)
People in Group quarters - Homes for abused, dependent, and neglected children (%)
People in Group quarters - Residential treatment centers for emotionally disturbed children (%)
People in Group quarters - Training schools for juvenile delinquents (%)
People in Group quarters - Short-term care, detention or diagnostic centers for delinquent children (%)
People in Group quarters - Type of juvenile institution unknown (%)
People in Group quarters - Noninstitutionalized population (%)
People in Group quarters - College dormitories (includes college quarters off campus) (%)
People in Group quarters - Military quarters (%)
People in Group quarters - On base (%)
People in Group quarters - Barracks, unaccompanied personnel housing (UPH), (Enlisted/Officer), ;and similar group living quarters for military personnel (%)
People in Group quarters - Transient quarters for temporary residents (%)
People in Group quarters - Military ships (%)
People in Group quarters - Group homes (%)
People in Group quarters - Homes or halfway houses for drug/alcohol abuse (%)
People in Group quarters - Homes for the mentally ill (%)
People in Group quarters - Homes for the mentally retarded (%)
People in Group quarters - Homes for the physically handicapped (%)
People in Group quarters - Other group homes (%)
People in Group quarters - Religious group quarters (%)
People in Group quarters - Dormitories (%)
People in Group quarters - Agriculture workers' dormitories on farms (%)
People in Group quarters - Job Corps and vocational training facilities (%)
People in Group quarters - Other workers' dormitories (%)
People in Group quarters - Crews of maritime vessels (%)
People in Group quarters - Other nonhousehold living situations (%)
People in Group quarters - Other noninstitutional group quarters (%)
Residents speaking English at home (%)
Residents speaking English at home - Born in the United States (%)
Residents speaking English at home - Native, born elsewhere (%)
Residents speaking English at home - Foreign born (%)
Residents speaking Spanish at home (%)
Residents speaking Spanish at home - Born in the United States (%)
Residents speaking Spanish at home - Native, born elsewhere (%)
Residents speaking Spanish at home - Foreign born (%)
Residents speaking other language at home (%)
Residents speaking other language at home - Born in the United States (%)
Residents speaking other language at home - Native, born elsewhere (%)
Residents speaking other language at home - Foreign born (%)
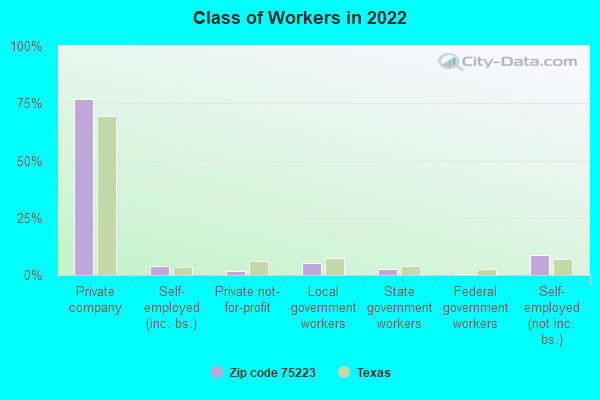
Class of Workers - Employee of private company (%)
Class of Workers - Self-employed in own incorporated business (%)
Class of Workers - Private not-for-profit wage and salary workers (%)
Class of Workers - Local government workers (%)
Class of Workers - State government workers (%)
Class of Workers - Federal government workers (%)
Class of Workers - Self-employed workers in own not incorporated business and Unpaid family workers (%)
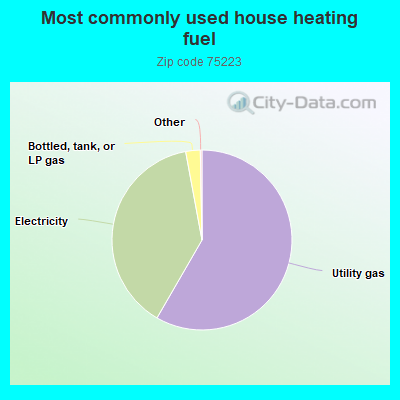
House heating fuel used in houses and condos - Utility gas (%)
House heating fuel used in houses and condos - Bottled, tank, or LP gas (%)
House heating fuel used in houses and condos - Electricity (%)
House heating fuel used in houses and condos - Fuel oil, kerosene, etc. (%)
House heating fuel used in houses and condos - Coal or coke (%)
House heating fuel used in houses and condos - Wood (%)
House heating fuel used in houses and condos - Solar energy (%)
House heating fuel used in houses and condos - Other fuel (%)
House heating fuel used in houses and condos - No fuel used (%)
House heating fuel used in apartments - Utility gas (%)
House heating fuel used in apartments - Bottled, tank, or LP gas (%)
House heating fuel used in apartments - Electricity (%)
House heating fuel used in apartments - Fuel oil, kerosene, etc. (%)
House heating fuel used in apartments - Coal or coke (%)
House heating fuel used in apartments - Wood (%)
House heating fuel used in apartments - Solar energy (%)
House heating fuel used in apartments - Other fuel (%)
House heating fuel used in apartments - No fuel used (%)
Armed forces status - In Armed Forces (%)
Armed forces status - Civilian (%)
Armed forces status - Civilian - Veteran (%)
Armed forces status - Civilian - Nonveteran (%)
Fatal accidents locations in years 2005-2021
Fatal accidents locations in 2005
Fatal accidents locations in 2006
Fatal accidents locations in 2007
Fatal accidents locations in 2008
Fatal accidents locations in 2009
Fatal accidents locations in 2010
Fatal accidents locations in 2011
Fatal accidents locations in 2012
Fatal accidents locations in 2013
Fatal accidents locations in 2014
Fatal accidents locations in 2015
Fatal accidents locations in 2016
Fatal accidents locations in 2017
Fatal accidents locations in 2018
Fatal accidents locations in 2019
Fatal accidents locations in 2020
Fatal accidents locations in 2021
Alcohol use - People drinking some alcohol every month (%)
Alcohol use - People not drinking at all (%)
Alcohol use - Average days/month drinking alcohol
Alcohol use - Average drinks/week
Alcohol use - Average days/year people drink much
Audiometry - Average condition of hearing (%)
Audiometry - People that can hear a whisper from across a quiet room (%)
Audiometry - People that can hear normal voice from across a quiet room (%)
Audiometry - Ears ringing, roaring, buzzing (%)
Audiometry - Had a job exposure to loud noise (%)
Audiometry - Had off-work exposure to loud noise (%)
Blood Pressure & Cholesterol - Has high blood pressure (%)
Blood Pressure & Cholesterol - Checking blood pressure at home (%)
Blood Pressure & Cholesterol - Frequently checking blood cholesterol (%)
Blood Pressure & Cholesterol - Has high cholesterol level (%)
Consumer Behavior - Money monthly spent on food at supermarket/grocery store
Consumer Behavior - Money monthly spent on food at other stores
Consumer Behavior - Money monthly spent on eating out
Consumer Behavior - Money monthly spent on carryout/delivered foods
Consumer Behavior - Income spent on food at supermarket/grocery store (%)
Consumer Behavior - Income spent on food at other stores (%)
Consumer Behavior - Income spent on eating out (%)
Consumer Behavior - Income spent on carryout/delivered foods (%)
Current Health Status - General health condition (%)
Current Health Status - Blood donors (%)
Current Health Status - Has blood ever tested for HIV virus (%)
Current Health Status - Left-handed people (%)
Dermatology - People using sunscreen (%)
Diabetes - Diabetics (%)
Diabetes - Had a blood test for high blood sugar (%)
Diabetes - People taking insulin (%)
Diet Behavior & Nutrition - Diet health (%)
Diet Behavior & Nutrition - Milk product consumption (# of products/month)
Diet Behavior & Nutrition - Meals not home prepared (#/week)
Diet Behavior & Nutrition - Meals from fast food or pizza place (#/week)
Diet Behavior & Nutrition - Ready-to-eat foods (#/month)
Diet Behavior & Nutrition - Frozen meals/pizza (#/month)
Drug Use - People that ever used marijuana or hashish (%)
Drug Use - Ever used hard drugs (%)
Drug Use - Ever used any form of cocaine (%)
Drug Use - Ever used heroin (%)
Drug Use - Ever used methamphetamine (%)
Health Insurance - People covered by health insurance (%)
Kidney Conditions-Urology - Avg. # of times urinating at night
Medical Conditions - People with asthma (%)
Medical Conditions - People with anemia (%)
Medical Conditions - People with psoriasis (%)
Medical Conditions - People with overweight (%)
Medical Conditions - Elderly people having difficulties in thinking or remembering (%)
Medical Conditions - People who ever received blood transfusion (%)
Medical Conditions - People having trouble seeing even with glass/contacts (%)
Medical Conditions - People with arthritis (%)
Medical Conditions - People with gout (%)
Medical Conditions - People with congestive heart failure (%)
Medical Conditions - People with coronary heart disease (%)
Medical Conditions - People with angina pectoris (%)
Medical Conditions - People who ever had heart attack (%)
Medical Conditions - People who ever had stroke (%)
Medical Conditions - People with emphysema (%)
Medical Conditions - People with thyroid problem (%)
Medical Conditions - People with chronic bronchitis (%)
Medical Conditions - People with any liver condition (%)
Medical Conditions - People who ever had cancer or malignancy (%)
Mental Health - People who have little interest in doing things (%)
Mental Health - People feeling down, depressed, or hopeless (%)
Mental Health - People who have trouble sleeping or sleeping too much (%)
Mental Health - People feeling tired or having little energy (%)
Mental Health - People with poor appetite or overeating (%)
Mental Health - People feeling bad about themself (%)
Mental Health - People who have trouble concentrating on things (%)
Mental Health - People moving or speaking slowly or too fast (%)
Mental Health - People having thoughts they would be better off dead (%)
Oral Health - Average years since last visit a dentist
Oral Health - People embarrassed because of mouth (%)
Oral Health - People with gum disease (%)
Oral Health - General health of teeth and gums (%)
Oral Health - Average days a week using dental floss/device
Oral Health - Average days a week using mouthwash for dental problem
Oral Health - Average number of teeth
Pesticide Use - Households using pesticides to control insects (%)
Pesticide Use - Households using pesticides to kill weeds (%)
Physical Activity - People doing vigorous-intensity work activities (%)
Physical Activity - People doing moderate-intensity work activities (%)
Physical Activity - People walking or bicycling (%)
Physical Activity - People doing vigorous-intensity recreational activities (%)
Physical Activity - People doing moderate-intensity recreational activities (%)
Physical Activity - Average hours a day doing sedentary activities
Physical Activity - Average hours a day watching TV or videos
Physical Activity - Average hours a day using computer
Physical Functioning - People having limitations keeping them from working (%)
Physical Functioning - People limited in amount of work they can do (%)
Physical Functioning - People that need special equipment to walk (%)
Physical Functioning - People experiencing confusion/memory problems (%)
Physical Functioning - People requiring special healthcare equipment (%)
Prescription Medications - Average number of prescription medicines taking
Preventive Aspirin Use - Adults 40+ taking low-dose aspirin (%)
Reproductive Health - Vaginal deliveries (%)
Reproductive Health - Cesarean deliveries (%)
Reproductive Health - Deliveries resulted in a live birth (%)
Reproductive Health - Pregnancies resulted in a delivery (%)
Reproductive Health - Women breastfeeding newborns (%)
Reproductive Health - Women that had a hysterectomy (%)
Reproductive Health - Women that had both ovaries removed (%)
Reproductive Health - Women that have ever taken birth control pills (%)
Reproductive Health - Women taking birth control pills (%)
Reproductive Health - Women that have ever used Depo-Provera or injectables (%)
Reproductive Health - Women that have ever used female hormones (%)
Sexual Behavior - People 18+ that ever had sex (vaginal, anal, or oral) (%)
Sexual Behavior - Males 18+ that ever had vaginal sex with a woman (%)
Sexual Behavior - Males 18+ that ever performed oral sex on a woman (%)
Sexual Behavior - Males 18+ that ever had anal sex with a woman (%)
Sexual Behavior - Males 18+ that ever had any sex with a man (%)
Sexual Behavior - Females 18+ that ever had vaginal sex with a man (%)
Sexual Behavior - Females 18+ that ever performed oral sex on a man (%)
Sexual Behavior - Females 18+ that ever had anal sex with a man (%)
Sexual Behavior - Females 18+ that ever had any kind of sex with a woman (%)
Sexual Behavior - Average age people first had sex
Sexual Behavior - Average number of female sex partners in lifetime (males 18+)
Sexual Behavior - Average number of female vaginal sex partners in lifetime (males 18+)
Sexual Behavior - Average age people first performed oral sex on a woman (18+)
Sexual Behavior - Average number of woman performed oral sex on in lifetime (18+)
Sexual Behavior - Average number of male sex partners in lifetime (males 18+)
Sexual Behavior - Average number of male anal sex partners in lifetime (males 18+)
Sexual Behavior - Average age people first performed oral sex on a man (18+)
Sexual Behavior - Average number of male oral sex partners in lifetime (18+)
Sexual Behavior - People using protection when performing oral sex (%)
Sexual Behavior - Average number of times people have vaginal or anal sex a year
Sexual Behavior - People having sex without condom (%)
Sexual Behavior - Average number of male sex partners in lifetime (females 18+)
Sexual Behavior - Average number of male vaginal sex partners in lifetime (females 18+)
Sexual Behavior - Average number of female sex partners in lifetime (females 18+)
Sexual Behavior - Circumcised males 18+ (%)
Sleep Disorders - Average hours sleeping at night
Sleep Disorders - People that has trouble sleeping (%)
Smoking-Cigarette Use - People smoking cigarettes (%)
Taste & Smell - People 40+ having problems with smell (%)
Taste & Smell - People 40+ having problems with taste (%)
Taste & Smell - People 40+ that ever had wisdom teeth removed (%)
Taste & Smell - People 40+ that ever had tonsils teeth removed (%)
Taste & Smell - People 40+ that ever had a loss of consciousness because of a head injury (%)
Taste & Smell - People 40+ that ever had a broken nose or other serious injury to face or skull (%)
Taste & Smell - People 40+ that ever had two or more sinus infections (%)
Weight - Average height (inches)
Weight - Average weight (pounds)
Weight - Average BMI
Weight - People that are obese (%)
Weight - People that ever were obese (%)
Weight - People trying to lose weight (%)
100%
urban population.
Estimated median house/condo value in 2022: $258,621
75223:
$258,621Texas:
$275,400
Median resident age: This zip code:
36.0 yearsTexas median age:
35.6 years
Average household size: This zip code:
2.9 peopleTexas:
2.6 people
Averages for the 2020 tax year for zip code 75223, filed in 2021:
Average Adjusted Gross Income (AGI) in 2020: $52,176 (Individual Income Tax Returns) Here:
$52,176State:
$77,054
Salary/wage: $48,194 (reported on 83.7% of returns )Here:
$48,194State:
$62,766
(% of AGI for various income ranges: 1237.8% for AGIs below $25k , 3905.7% for AGIs $25k-50k , 7026.3% for AGIs $50k-75k , 10175.3% for AGIs $75k-100k , 18197.7% for AGIs $100k-200k , 72980.0% for AGIs over 200k ) Taxable interest for individuals: $1,047 (reported on 12.0% of returns )This zip code:
$1,047Texas:
$2,665
(% of AGI for various income ranges: 2.2% for AGIs below $25k , 4.2% for AGIs $25k-50k , 13.2% for AGIs $50k-75k , 20.0% for AGIs $75k-100k , 110.0% for AGIs $100k-200k , 345.6% for AGIs over 200k ) Ordinary dividends: $4,641 (reported on 8.7% of returns )(% of AGI for various income ranges: 7.3% for AGIs below $25k , 7.3% for AGIs $25k-50k , 21.7% for AGIs $50k-75k , 129.5% for AGIs $75k-100k , 296.4% for AGIs $100k-200k , 1360.0% for AGIs over 200k ) Net capital gain/loss in AGI: +$16,526 (reported on 8.6% of returns )Here:
+$16,526State:
+$39,590
(% of AGI for various income ranges: 2.9% for AGIs below $25k , 5.2% for AGIs $25k-50k , 29.0% for AGIs $50k-75k , 133.7% for AGIs $75k-100k , 628.2% for AGIs $100k-200k , 7571.1% for AGIs over 200k ) Profit/loss from business: +$11,832 (reported on 24.7% of returns )Here:
+$11,832State:
+$10,888
(% of AGI for various income ranges: 296.7% for AGIs below $25k , 241.0% for AGIs $25k-50k , 199.3% for AGIs $50k-75k , 495.8% for AGIs $75k-100k , 1580.0% for AGIs $100k-200k , 3352.2% for AGIs over 200k ) Taxable individual retirement arrangement distribution: $18,022 (reported on 2.9% of returns )75223:
$18,022Texas:
$24,740
(% of AGI for various income ranges: 12.7% for AGIs below $25k , 30.8% for AGIs $25k-50k , 114.3% for AGIs $50k-75k , 840.5% for AGIs $100k-200k ) Total itemized deductions: $27,477 (reported on 5.7% of returns )Here:
$27,477State:
$40,428
(% of AGI for various income ranges: 22.5% for AGIs below $25k , 53.7% for AGIs $25k-50k , 141.2% for AGIs $50k-75k , 522.6% for AGIs $75k-100k , 1102.7% for AGIs $100k-200k , 4564.4% for AGIs over 200k ) Charity contributions: $6,600 (reported on 4.4% of returns )(% of AGI for various income ranges: 12.8% for AGIs $25k-50k , 34.8% for AGIs $50k-75k , 89.5% for AGIs $75k-100k , 184.1% for AGIs $100k-200k , 897.8% for AGIs over 200k ) Taxes paid: $8,231 (reported on 5.7% of returns )(% of AGI for various income ranges: 5.8% for AGIs below $25k , 14.7% for AGIs $25k-50k , 38.5% for AGIs $50k-75k , 150.0% for AGIs $75k-100k , 387.7% for AGIs $100k-200k , 1308.9% for AGIs over 200k ) Earned income credit: $2,699 (reported on 26.2% of returns )(% of AGI for various income ranges: 154.4% for AGIs below $25k , 87.8% for AGIs $25k-50k ) Percentage of individuals using paid preparers for their 2020 taxes: 86.6%(% for various income ranges: 82.6% for AGIs below $25k , 88.2% for AGIs $25k-50k , 89.9% for AGIs $50k-75k , 89.3% for AGIs $75k-100k , 94.6% for AGIs $100k-200k , 92.0% for AGIs over 200k )
Averages for the 2012 tax year for zip code 75223, filed in 2013:
Average Adjusted Gross Income (AGI) in 2012: $38,204 (Individual Income Tax Returns) Here:
$38,204State:
$65,384
Salary/wage: $35,818 (reported on 85.2% of returns )Here:
$35,818State:
$52,524
(% of AGI for various income ranges: 78.7% for AGIs below $25k , 91.1% for AGIs $25k-50k , 86.9% for AGIs $50k-75k , 81.4% for AGIs $75k-100k , 82.4% for AGIs $100k-200k , 57.6% for AGIs over 200k ) Taxable interest for individuals: $996 (reported on 12.4% of returns )This zip code:
$996Texas:
$2,372
(% of AGI for various income ranges: 0.5% for AGIs below $25k , 0.2% for AGIs $25k-50k , 0.2% for AGIs $50k-75k , 0.6% for AGIs $75k-100k , 0.4% for AGIs $100k-200k , 0.3% for AGIs over 200k ) Ordinary dividends: $3,745 (reported on 7.0% of returns )(% of AGI for various income ranges: 0.6% for AGIs below $25k , 0.2% for AGIs $25k-50k , 0.9% for AGIs $50k-75k , 0.9% for AGIs $75k-100k , 1.0% for AGIs $100k-200k , 0.9% for AGIs over 200k ) Net capital gain/loss in AGI: +$15,009 (reported on 5.5% of returns )Here:
+$15,009State:
+$35,319
(% of AGI for various income ranges: 1.4% for AGIs $75k-100k , 0.3% for AGIs $100k-200k , 10.7% for AGIs over 200k ) Profit/loss from business: +$11,764 (reported on 22.7% of returns )Here:
+$11,764State:
+$13,732
(% of AGI for various income ranges: 18.0% for AGIs below $25k , 4.0% for AGIs $25k-50k , 6.0% for AGIs $50k-75k , 1.2% for AGIs $75k-100k , 6.2% for AGIs $100k-200k , 3.8% for AGIs over 200k ) Taxable individual retirement arrangement distribution: $19,038 (reported on 2.7% of returns )75223:
$19,038Texas:
$19,511
(% of AGI for various income ranges: 0.6% for AGIs below $25k , 0.6% for AGIs $25k-50k , 2.8% for AGIs $50k-75k , 4.4% for AGIs $100k-200k ) Self-employment retirement plans: $17,300 (reported on 0.3% of returns )75223:
$17,300Texas:
$23,938
Total itemized deductions: $19,714 (17% of AGI, reported on 13.1% of returns )Here:
$19,714State:
$24,724
Here:
17.2% of AGIState:
15.9% of AGI
(% of AGI for various income ranges: 2.5% for AGIs below $25k , 4.5% for AGIs $25k-50k , 8.5% for AGIs $50k-75k , 12.3% for AGIs $75k-100k , 12.0% for AGIs $100k-200k , 6.6% for AGIs over 200k ) Charity contributions: $3,263 (reported on 9.8% of returns )(% of AGI for various income ranges: 0.3% for AGIs below $25k , 0.5% for AGIs $25k-50k , 0.9% for AGIs $50k-75k , 1.5% for AGIs $75k-100k , 1.5% for AGIs $100k-200k , 1.2% for AGIs over 200k ) Taxes paid: $6,414 (reported on 12.6% of returns )(% of AGI for various income ranges: 0.5% for AGIs below $25k , 1.1% for AGIs $25k-50k , 2.3% for AGIs $50k-75k , 3.9% for AGIs $75k-100k , 4.5% for AGIs $100k-200k , 2.4% for AGIs over 200k ) Earned income credit: $2,733 (reported on 35.2% of returns )(% of AGI for various income ranges: 10.7% for AGIs below $25k , 1.8% for AGIs $25k-50k ) Percentage of individuals using paid preparers for their 2012 taxes: 61.7%(% for various income ranges: 63.6% for AGIs below $25k , 62.8% for AGIs $25k-50k , 55.3% for AGIs $50k-75k , 50.0% for AGIs $75k-100k , 50.0% for AGIs $100k-200k , 63.6% for AGIs over 200k )
Averages for the 2004 tax year for zip code 75223, filed in 2005:
Average Adjusted Gross Income (AGI) in 2004: $30,915 (Individual Income Tax Returns) Here:
$30,915State:
$47,881
Salary/wage: $30,799 (reported on 87.8% of returns )Here:
$30,799State:
$41,947
(% of AGI for various income ranges: 95.9% for AGIs below $10k , 86.7% for AGIs $10k-25k , 93.3% for AGIs $25k-50k , 85.5% for AGIs $50k-75k , 86.9% for AGIs $75k-100k , 81.9% for AGIs over 100k ) Taxable interest for individuals: $1,055 (reported on 16.6% of returns )This zip code:
$1,055Texas:
$2,255
(% of AGI for various income ranges: 1.9% for AGIs below $10k , 0.4% for AGIs $10k-25k , 0.3% for AGIs $25k-50k , 0.6% for AGIs $50k-75k , 0.6% for AGIs $75k-100k , 0.7% for AGIs over 100k ) Taxable dividends: $2,706 (reported on 8.1% of returns )(% of AGI for various income ranges: 1.1% for AGIs below $10k , 0.3% for AGIs $10k-25k , 0.2% for AGIs $25k-50k , 0.3% for AGIs $50k-75k , 0.4% for AGIs $75k-100k , 1.9% for AGIs over 100k ) Net capital gain/loss: +$5,024 (reported on 6.6% of returns )Here:
+$5,024State:
+$16,110
(% of AGI for various income ranges: 0.7% for AGIs below $10k , -0.1% for AGIs $10k-25k , 0.0% for AGIs $25k-50k , 0.9% for AGIs $50k-75k , 1.7% for AGIs $75k-100k , 3.2% for AGIs over 100k ) Profit/loss from business: +$10,207 (reported on 17.6% of returns )Here:
+$10,207State:
+$11,013
(% of AGI for various income ranges: 7.5% for AGIs below $10k , 9.7% for AGIs $10k-25k , 3.1% for AGIs $25k-50k , 5.0% for AGIs $50k-75k , 3.8% for AGIs $75k-100k , 6.4% for AGIs over 100k ) IRA payment deduction: $2,367 (reported on 1.0% of returns )(% of AGI for various income ranges: 0.5% for AGIs below $10k , 0.0% for AGIs $25k-50k , 0.2% for AGIs $50k-75k , 0.4% for AGIs $75k-100k ) Self-employed pension: $15,429 (reported on 0.4% of returns )Here:
$15,429Texas:
$16,401
Total itemized deductions: $17,508 (20% of AGI, reported on 13.4% of returns )Here:
$17,508State:
$19,631
Here:
20.4% of AGIState:
18.9% of AGI
(% of AGI for various income ranges: 4.4% for AGIs below $10k , 2.7% for AGIs $10k-25k , 4.8% for AGIs $25k-50k , 9.4% for AGIs $50k-75k , 14.2% for AGIs $75k-100k , 12.5% for AGIs over 100k ) Charity contributions deductions: $2,825 (3% of AGI, reported on 10.7% of returns )Here:
3.1% of AGIState:
4.2% of AGI
(% of AGI for various income ranges: 0.4% for AGIs below $10k , 0.3% for AGIs $10k-25k , 0.6% for AGIs $25k-50k , 1.0% for AGIs $50k-75k , 1.7% for AGIs $75k-100k , 1.8% for AGIs over 100k ) Total tax: $5,123 (reported on 57.9% of returns )(% of AGI for various income ranges: 4.2% for AGIs below $10k , 3.1% for AGIs $10k-25k , 5.1% for AGIs $25k-50k , 10.3% for AGIs $50k-75k , 13.3% for AGIs $75k-100k , 19.3% for AGIs over 100k ) Earned income credit: $2,087 (reported on 36.9% of returns )Percentage of individuals using paid preparers for their 2004 taxes: 63.8%(% for various income ranges: 57.2% for AGIs below $10k , 70.6% for AGIs $10k-25k , 64.1% for AGIs $25k-50k , 58.3% for AGIs $50k-75k , 48.4% for AGIs $75k-100k , 49.8% for AGIs over 100k )
Estimated median household income in 2022: This zip code:
$66,187Texas:
$72,284
Nearest zip codes: 75210 ,
75246 ,
75226 ,
75214 ,
75215 ,
75204 .
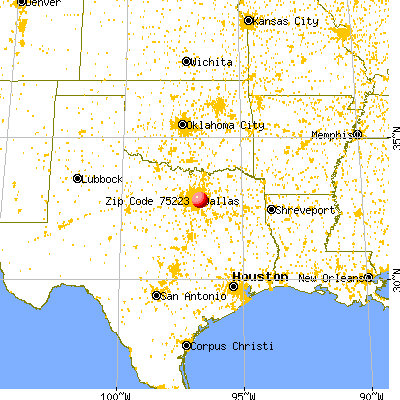
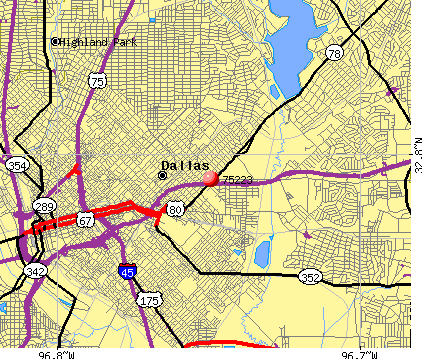
Dallas Zip Code Map
Percentage of family households: This zip code:
45.3%Texas:
50.5%
Percentage of households with unmarried partners: This zip code:
10.6%Texas:
48.7%
Likely homosexual households (counted as self-reported same-sex unmarried-partner households)
Lesbian couples: 0.1% of all households Gay men: 0.5% of all households
Household received Food Stamps/SNAP in the past 12 months: 792Household did not receive Food Stamps/SNAP in the past 12 months: 3,951
Women who had a birth in the past 12 months: 166 (141 now married , 26 unmarried) Women who did not have a birth in the past 12 months: 2,744 (1,051 now married , 1,697 unmarried)
Housing units in zip code 75223 with a mortgage: 809 (100
second mortgage , 24
home equity loan , 80
both second mortgage and home equity loan )
Median monthly owner costs for units with a mortgage: $2,288
Median monthly owner costs for units without a mortgage: $473
Residents with income below the poverty level in 2022:
This zip code:
14.7%Whole state:
14.0%
Residents with income below 50% of the poverty level in 2022:
This zip code:
7.1%Whole state:
7.4%
Median number of rooms in houses and condos: Median number of rooms in apartments: Notable locations in this zip code not listed on our city pages
Click to draw/clear zip code borders Notable location: (A) . Display/hide its location on the map
Churches in zip code 75223 include: (A) , Progressive Baptist Church East (B) , Roes Chapel Missionary Baptist Church (C) , East Dallas Church of Christ (D) , Church of God (E) , Fair Park Church of God in Christ (F) , West Shore Church (G) , Jenkins Chapel African Methodist Episcopal Church (H) , Gaines Chapel African Methodist Episcopal Church (I) . Display/hide their locations on the map
Parks in zip code 75223 include: (1) , Parkview Park (2) , Owenwood Park (3) , Samuell Park (4) . Display/hide their locations on the map
Year house built (houses)
0 2020 or later519 2010 to 2019485 2000 to 2009326 1990 to 1999492 1980 to 1989226 1970 to 1979177 1960 to 1969566 1950 to 1959623 1940 to 19491,618 1939 or earlier
Zip code 75223 household income distribution in 2022 386 Less than $10,000299 $10,000 to $14,999121 $15,000 to $19,99958 $20,000 to $24,999255 $25,000 to $29,999176 $30,000 to $34,999176 $35,000 to $39,999171 $40,000 to $44,999126 $45,000 to $49,999358 $50,000 to $59,999542 $60,000 to $74,999681 $75,000 to $99,999216 $100,000 to $124,999462 $125,000 to $149,999273 $150,000 to $199,999430 $200,000 or moreEstimate of home value of owner-occupied houses/condos in 2022 in zip code 75223 21 Less than $10,00021 $10,000 to $14,99991 $15,000 to $19,99924 $25,000 to $29,99940 $50,000 to $59,99932 $60,000 to $69,99967 $70,000 to $79,99992 $80,000 to $89,99972 $90,000 to $99,999159 $100,000 to $124,99946 $125,000 to $149,999106 $150,000 to $174,99949 $175,000 to $199,999287 $200,000 to $249,999149 $250,000 to $299,999165 $300,000 to $399,999258 $400,000 to $499,999452 $500,000 to $749,999160 $750,000 to $999,9999 $1,000,000 to $1,499,999Rent paid by renters in 2022 in zip code 75223 27 Less than $10019 $100 to $149106 $150 to $19930 $200 to $24953 $250 to $29923 $300 to $3499 $350 to $39946 $400 to $44996 $450 to $49952 $500 to $54914 $550 to $59914 $600 to $64941 $700 to $749112 $750 to $79982 $800 to $899223 $900 to $999428 $1,000 to $1,249450 $1,250 to $1,499228 $1,500 to $1,999207 $2,000 to $2,4995 $2,500 to $2,99929 $3,500 or more86 No cash rent
Median gross rent in 2022: $1,326.
Median price asked for vacant for-sale houses and condos in 2022: $747,086.
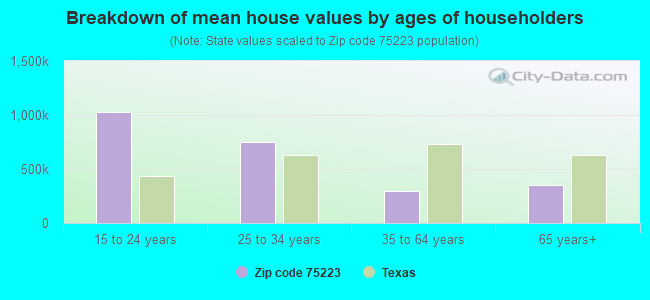
Estimated median house (or condo) value in 2022 for: White Non-Hispanic householders: $756,963Black or African American householders: $162,733American Indian or Alaska Native householders: $359,119Asian householders: $391,850Native Hawaiian and other Pacific Islander householders: $172,875Some other race householders: $245,252Two or more races householders: $304,721Hispanic or Latino householders: $235,110Estimated median house or condo value in 2022: $258,621
75223:
$258,621Texas:
$275,400
Lower value quartile - upper value quartile: $121,232 - $510,468
Mean price in 2022: Detached houses: $503,621Here:
$503,621State:
$369,058
Townhouses or other attached units: $433,434Here:
$433,434State:
$327,631
In 2-unit structures: $498,325Here:
$498,325State:
$374,947
In 3-to-4-unit structures: $214,384Here:
$214,384State:
$209,652
In 5-or-more-unit structures: $469,079Here:
$469,079State:
$413,944
Mobile homes: $85,905Here:
$85,905State:
$124,413
Occupied boats, RVs, vans, etc.: $438,838Here:
$438,838State:
$73,921
Housing units in structures:
One, detached: 3,740One, attached: 275Two: 2503 or 4: 1175 to 9: 2110 to 19: 19720 to 49: 8150 or more: 450Mobile homes: 130Unemployment : 6.3%
Means of transportation to work in zip code 75223 67.0% 4,780 Drove a car alone19.8% 1,415 Carpooled0.9% 61 Bus or trolley bus0.1% 8 Subway or elevated0.2% 17 Railroad0.2% 14 Bicycle0.7% 52 Walked1.2% 85 Other means8.9% 633 Worked at homeTravel time to work (commute) in zip code 75223 253 Less than 5 minutes285 5 to 9 minutes552 10 to 14 minutes869 15 to 19 minutes1,018 20 to 24 minutes732 25 to 29 minutes1,139 30 to 34 minutes234 35 to 39 minutes234 40 to 44 minutes630 45 to 59 minutes309 60 to 89 minutes132 90 or more minutes
Neighborhoods in zip code 75223: Percentage of zip code residents living and working in this county: 86.1%
Household type by relationship:
Households: 13,528
Male householders: 2,701 (771 living alone ), Female householders: 2,027 (688 living alone )1,789 spouses (1,740 opposite-sex spouses ), 460 unmarried partners , (439 opposite-sex unmarried partners ), 4,329 children (4,135 natural , 19 adopted , 173 stepchildren ), 643 grandchildren , 205 brothers or sisters , 286 parents , 0 foster children , 442 other relatives , 570 non-relatives In group quarters: 20 (-1 institutionalized population )
Size of family households: 740 2-persons , 649 3-persons , 504 4-persons , 526 5-persons , 132 6-persons , 204 7-or-more-persons
Size of nonfamily households: 1,459 1-person , 387 2-persons , 55 3-persons , 81 4-persons
1,538 married couples with children. single-parent households (216 men , 755 women ).
37.2% of residents of 75223 zip code speak English at home. of residents speak Spanish at home (51% very well, 17% well, 21% not well, 11% not at all ).of residents speak other Indo-European language at home (97% very well, 3% not well ).of residents speak Asian or Pacific Island language at home (29% very well, 71% well ).
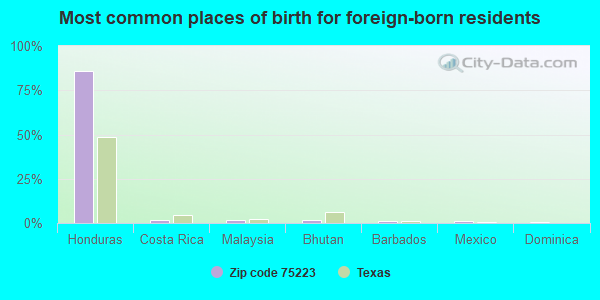
Foreign born population: 4,104 (30.3%)
(28.3%
of them are naturalized citizens )
This zip code:
30.3%Whole state:
17.2%
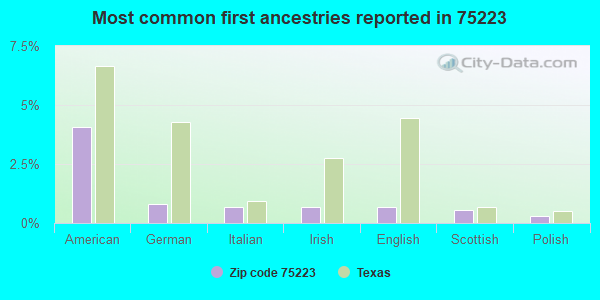
86% Honduras 2% Costa Rica 2% Malaysia 2% Bhutan 1% Barbados 1% Mexico 1% Dominica 4% American 1% German 1% Italian 1% Irish 1% English 1% Scottish 0% Polish
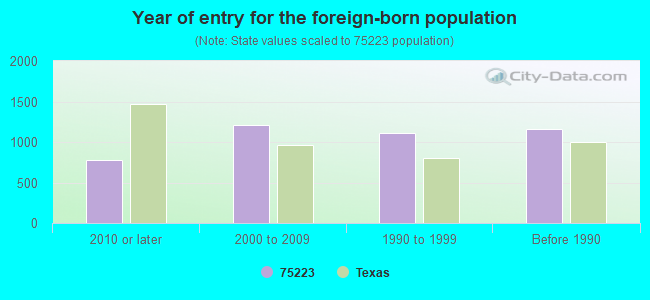
Year of entry for the foreign-born population
778 2010 or later 1,208 2000 to 2009 1,105 1990 to 1999 1,157 Before 1990
There are
7 Medical Specialists in Zip Code 75223 .
Facilities with environmental interests located in this zip code:
AMERICAN SPILL CONTROL INC (5419 OWENWOD AVE in DALLAS, TX)
(Resource Conservation and Recovery Act (tracking hazardous waste))
AFCO NO 10236 (121 REGAL ROW in DALLAS, TX)
Conditionally Exempt Small Quantity Generators, less than 100 kg/month of hazardous waste (Resource Conservation and Recovery Act (tracking hazardous waste)) - notification Organizations: MICOR ENERGY LLC DBA AFCO (CONTACT/OWNER)
AIRGAS SOUTHWEST INC. (1001-A FOREST AVE. in DALLAS, TX)
TRI REPORTER (Tracking of toxic chemicals releasing facilities) Business SIC classification: INDUSTRIAL GASES; CHEMICALS AND ALLIED PRODUCTS
Housing units lacking complete plumbing facilities: 2.4%
Housing units lacking complete kitchen facilities: 1.9%
58.4% Utility gas 38.8% Electricity 2.6% Bottled, tank, or LP gas
Population in 1990: 14,700. Population change in the 1990s: +952 (+6.5%).
Place of birth for U.S.-born residents:
This state: 7,313Northeast: 243Midwest: 418South: 764West: 361
57% of the 75223 zip code residents lived in the same house 5 years ago.
Out of people who lived in different houses, 80% lived in this county.
Out of people who lived in different counties, 50% lived in Texas.
93% of the 75223 zip code residents lived in the same house 1 year ago.
Out of people who lived in different houses, 51% moved from this county.
Out of people who lived in different houses, 15% moved from different county within same state.
Out of people who lived in different houses, 35% moved from different state.
Out of people who lived in different houses, 2% moved from abroad.
Private vs. public school enrollment:
Students in private schools in grades 1 to 8 (elementary and middle school): 41
Students in private schools in grades 9 to 12 (high school):
Students in private undergraduate colleges: 61
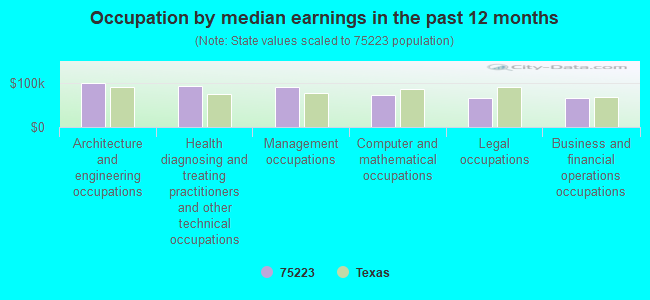
Occupation by median earnings in the past 12 months ($)
99,295 Architecture and engineering occupations 91,935 Health diagnosing and treating practitioners and other technical occupations 89,592 Management occupations 72,968 Computer and mathematical occupations 66,546 Legal occupations 65,794 Business and financial operations occupations
Companies with federal contracts located in this zip code:
TRIPLE S DYNAMICS INC (1031 S HASKELL AVE in DALLAS, TX; small business)
$98,960 with Army for Specialized Ammunition Handling Servicing Equipment. Signed on 2002-03-05. Completion date: 2002-05-31.
Top industries in this zip code by the number of employees in 2005:
Other Services (except Public Administration): Religious Organizations (50-99 employees: 1 establishment, 10-19 employees: 1 establishment, 5-9 employees: 1 establishment, 1-4 employees: 2 establishments)Construction: Poured Concrete Foundation and Structure Contractors (50-99: 1, 5-9: 1, 1-4: 1)Accommodation and Food Services: Limited-Service Restaurants (20-49: 1, 10-19: 2, 5-9: 1, 1-4: 1)Wholesale Trade: Meat and Meat Product Merchant Wholesalers (50-99: 1)Finance and Insurance: Securities Brokerage (50-99: 1)
People in group quarters in 2010:
19 people in other noninstitutional facilities
People in group quarters in 2000:
86 people in homes or halfway houses for drug/alcohol abuse
Fatal accident statistics in 2014:
Fatal accident count: 2Vehicles involved in fatal accidents: 2Fatal accidents caused by drunken drivers: 1Fatalities: 2Persons involved in fatal accidents: 3Pedestrians involved in fatal accidents: 1
Fatal accident statistics in 2013:
Fatal accident count: 2Vehicles involved in fatal accidents: 3Fatal accidents caused by drunken drivers: 0Fatalities: 2Persons involved in fatal accidents: 8Pedestrians involved in fatal accidents: 0
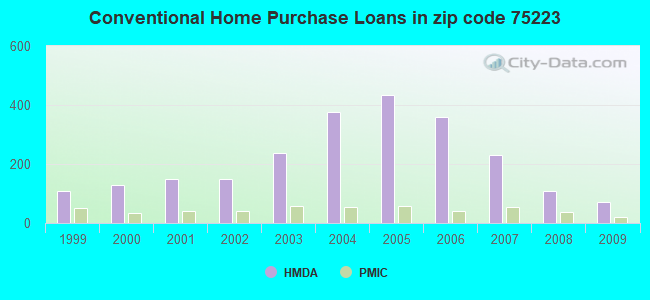
Home Mortgage Disclosure Act Aggregated Statistics For Year 2009(Based on 6 full and 4 partial tracts) A) FHA, FSA/RHS & VA B) Conventional C) Refinancings D) Home Improvement Loans E) Loans on Dwellings For 5+ Families F) Non-occupant Loans on G) Loans On Manufactured Number Average Value Number Average Value Number Average Value Number Average Value Number Average Value Number Average Value Number Average Value
LOANS ORIGINATED 50 $163,515 70 $174,509 156 $202,995 14 $59,114 0 $0 20 $67,662 2 $38,755 APPLICATIONS APPROVED, NOT ACCEPTED 2 $160,070 11 $59,221 14 $216,767 4 $47,480 0 $0 4 $91,902 0 $0 APPLICATIONS DENIED 8 $145,040 11 $138,185 89 $129,151 37 $36,137 2 $297,870 12 $103,040 2 $23,830 APPLICATIONS WITHDRAWN 2 $138,300 15 $137,875 26 $153,452 4 $24,750 0 $0 5 $99,064 0 $0 FILES CLOSED FOR INCOMPLETENESS 4 $85,885 2 $89,360 8 $135,275 4 $7,482 0 $0 2 $156,120 0 $0
Aggregated Statistics For Year 2008(Based on 6 full and 4 partial tracts) A) FHA, FSA/RHS & VA B) Conventional C) Refinancings D) Home Improvement Loans E) Loans on Dwellings For 5+ Families F) Non-occupant Loans on G) Loans On Manufactured Number Average Value Number Average Value Number Average Value Number Average Value Number Average Value Number Average Value Number Average Value
LOANS ORIGINATED 30 $124,355 110 $163,729 110 $155,427 28 $41,570 0 $0 34 $101,544 2 $24,825 APPLICATIONS APPROVED, NOT ACCEPTED 0 $0 19 $146,114 12 $147,473 9 $21,952 0 $0 13 $112,162 0 $0 APPLICATIONS DENIED 15 $99,811 31 $94,984 140 $100,950 77 $42,204 0 $0 25 $57,706 0 $0 APPLICATIONS WITHDRAWN 7 $62,571 12 $110,953 40 $112,568 19 $55,097 2 $1,956,015 2 $52,370 0 $0 FILES CLOSED FOR INCOMPLETENESS 0 $0 12 $106,032 6 $122,503 2 $24,705 0 $0 0 $0 0 $0
Aggregated Statistics For Year 2007(Based on 6 full and 4 partial tracts) A) FHA, FSA/RHS & VA B) Conventional C) Refinancings D) Home Improvement Loans E) Loans on Dwellings For 5+ Families F) Non-occupant Loans on Number Average Value Number Average Value Number Average Value Number Average Value Number Average Value Number Average Value
LOANS ORIGINATED 13 $110,305 229 $148,644 139 $132,714 47 $51,101 4 $739,970 54 $97,866 APPLICATIONS APPROVED, NOT ACCEPTED 2 $136,945 18 $120,672 39 $85,873 11 $24,457 0 $0 12 $63,234 APPLICATIONS DENIED 3 $84,097 92 $95,993 189 $84,370 105 $43,832 0 $0 86 $94,696 APPLICATIONS WITHDRAWN 4 $99,788 31 $111,695 82 $99,829 11 $36,075 0 $0 35 $106,747 FILES CLOSED FOR INCOMPLETENESS 0 $0 19 $108,380 19 $166,040 4 $52,480 0 $0 4 $118,682
Aggregated Statistics For Year 2006(Based on 6 full and 4 partial tracts) A) FHA, FSA/RHS & VA B) Conventional C) Refinancings D) Home Improvement Loans E) Loans on Dwellings For 5+ Families F) Non-occupant Loans on G) Loans On Manufactured Number Average Value Number Average Value Number Average Value Number Average Value Number Average Value Number Average Value Number Average Value
LOANS ORIGINATED 20 $119,769 358 $116,570 194 $97,313 41 $48,637 0 $0 122 $84,868 0 $0 APPLICATIONS APPROVED, NOT ACCEPTED 0 $0 64 $104,103 43 $71,621 16 $35,539 0 $0 27 $86,400 0 $0 APPLICATIONS DENIED 0 $0 122 $86,108 233 $89,296 97 $30,825 2 $456,735 76 $81,121 3 $57,090 APPLICATIONS WITHDRAWN 5 $135,312 51 $88,233 123 $97,353 13 $51,193 0 $0 34 $92,508 0 $0 FILES CLOSED FOR INCOMPLETENESS 2 $108,225 7 $96,803 51 $105,038 0 $0 2 $347,515 6 $96,870 0 $0
Aggregated Statistics For Year 2005(Based on 6 full and 4 partial tracts) A) FHA, FSA/RHS & VA B) Conventional C) Refinancings D) Home Improvement Loans E) Loans on Dwellings For 5+ Families F) Non-occupant Loans on Number Average Value Number Average Value Number Average Value Number Average Value Number Average Value Number Average Value
LOANS ORIGINATED 16 $98,669 435 $109,667 223 $93,723 45 $61,488 4 $469,160 122 $79,728 APPLICATIONS APPROVED, NOT ACCEPTED 0 $0 106 $89,651 32 $86,043 15 $29,237 2 $571,910 20 $76,715 APPLICATIONS DENIED 6 $90,350 144 $78,458 187 $69,357 86 $35,493 0 $0 72 $63,014 APPLICATIONS WITHDRAWN 4 $59,275 60 $76,602 133 $94,868 30 $168,793 0 $0 23 $56,663 FILES CLOSED FOR INCOMPLETENESS 0 $0 20 $112,346 66 $91,257 4 $53,618 0 $0 9 $101,024
Aggregated Statistics For Year 2004(Based on 6 full and 4 partial tracts) A) FHA, FSA/RHS & VA B) Conventional C) Refinancings D) Home Improvement Loans E) Loans on Dwellings For 5+ Families F) Non-occupant Loans on G) Loans On Manufactured Number Average Value Number Average Value Number Average Value Number Average Value Number Average Value Number Average Value Number Average Value
LOANS ORIGINATED 43 $87,679 376 $112,873 244 $95,184 34 $71,300 2 $1,072,330 115 $81,334 0 $0 APPLICATIONS APPROVED, NOT ACCEPTED 0 $0 75 $102,030 47 $80,480 15 $32,917 0 $0 35 $96,015 0 $0 APPLICATIONS DENIED 4 $75,460 100 $76,626 249 $66,151 89 $42,202 0 $0 73 $60,595 5 $35,148 APPLICATIONS WITHDRAWN 4 $114,368 24 $99,126 109 $88,254 5 $42,204 0 $0 9 $85,818 0 $0 FILES CLOSED FOR INCOMPLETENESS 4 $67,518 24 $70,820 67 $103,970 0 $0 0 $0 8 $64,666 0 $0
Aggregated Statistics For Year 2003(Based on 6 full and 4 partial tracts) A) FHA, FSA/RHS & VA B) Conventional C) Refinancings D) Home Improvement Loans E) Loans on Dwellings For 5+ Families F) Non-occupant Loans on Number Average Value Number Average Value Number Average Value Number Average Value Number Average Value Number Average Value
LOANS ORIGINATED 40 $86,696 238 $119,026 494 $103,602 26 $56,333 3 $228,347 99 $58,977 APPLICATIONS APPROVED, NOT ACCEPTED 0 $0 51 $99,586 41 $93,111 14 $39,196 0 $0 13 $90,357 APPLICATIONS DENIED 6 $69,293 67 $91,650 264 $78,808 49 $18,256 0 $0 42 $56,699 APPLICATIONS WITHDRAWN 4 $57,950 50 $144,042 178 $79,525 4 $21,498 0 $0 21 $105,777 FILES CLOSED FOR INCOMPLETENESS 2 $130,070 11 $111,002 13 $133,232 0 $0 0 $0 2 $76,455
Aggregated Statistics For Year 2002(Based on 2 full and 4 partial tracts) A) FHA, FSA/RHS & VA B) Conventional C) Refinancings D) Home Improvement Loans E) Loans on Dwellings For 5+ Families F) Non-occupant Loans on Number Average Value Number Average Value Number Average Value Number Average Value Number Average Value Number Average Value
LOANS ORIGINATED 29 $87,300 149 $116,351 186 $109,154 21 $33,638 0 $0 61 $87,108 APPLICATIONS APPROVED, NOT ACCEPTED 4 $87,950 21 $50,723 39 $80,798 14 $20,359 0 $0 6 $43,112 APPLICATIONS DENIED 6 $49,993 44 $51,688 143 $56,677 56 $12,726 3 $3,355,603 16 $34,962 APPLICATIONS WITHDRAWN 2 $64,540 18 $95,384 83 $73,177 2 $6,950 0 $0 5 $47,342 FILES CLOSED FOR INCOMPLETENESS 2 $97,975 9 $74,006 12 $66,062 0 $0 0 $0 0 $0
Aggregated Statistics For Year 2001(Based on 2 full and 4 partial tracts) A) FHA, FSA/RHS & VA B) Conventional C) Refinancings D) Home Improvement Loans E) Loans on Dwellings For 5+ Families F) Non-occupant Loans on Number Average Value Number Average Value Number Average Value Number Average Value Number Average Value Number Average Value
LOANS ORIGINATED 31 $67,353 149 $91,381 142 $109,308 29 $19,408 3 $1,810,227 35 $61,918 APPLICATIONS APPROVED, NOT ACCEPTED 0 $0 12 $63,602 36 $78,620 17 $38,122 2 $160,850 5 $86,846 APPLICATIONS DENIED 0 $0 32 $61,637 96 $47,909 44 $15,182 0 $0 17 $39,848 APPLICATIONS WITHDRAWN 4 $104,155 13 $111,222 77 $63,349 9 $26,700 0 $0 10 $98,816 FILES CLOSED FOR INCOMPLETENESS 0 $0 10 $96,258 20 $53,209 0 $0 0 $0 2 $43,690
Aggregated Statistics For Year 2000(Based on 2 full and 4 partial tracts) A) FHA, FSA/RHS & VA B) Conventional C) Refinancings D) Home Improvement Loans F) Non-occupant Loans on Number Average Value Number Average Value Number Average Value Number Average Value Number Average Value
LOANS ORIGINATED 23 $83,812 129 $95,347 88 $67,916 27 $23,924 34 $70,609 APPLICATIONS APPROVED, NOT ACCEPTED 2 $58,580 20 $92,438 20 $33,728 25 $26,634 11 $56,782 APPLICATIONS DENIED 5 $103,238 51 $56,457 70 $39,110 55 $13,933 15 $80,998 APPLICATIONS WITHDRAWN 6 $63,545 16 $65,876 63 $48,437 4 $20,592 14 $72,902 FILES CLOSED FOR INCOMPLETENESS 0 $0 5 $95,736 36 $38,646 0 $0 3 $84,650
Aggregated Statistics For Year 1999(Based on 2 full and 2 partial tracts) A) FHA, FSA/RHS & VA B) Conventional C) Refinancings D) Home Improvement Loans E) Loans on Dwellings For 5+ Families F) Non-occupant Loans on Number Average Value Number Average Value Number Average Value Number Average Value Number Average Value Number Average Value
LOANS ORIGINATED 27 $70,875 108 $102,440 87 $74,508 39 $16,261 1 $505,540 38 $58,049 APPLICATIONS APPROVED, NOT ACCEPTED 2 $54,355 18 $82,399 20 $58,975 20 $20,614 0 $0 4 $48,790 APPLICATIONS DENIED 2 $98,380 69 $66,174 39 $51,085 50 $13,922 0 $0 10 $59,309 APPLICATIONS WITHDRAWN 2 $61,250 11 $65,367 30 $47,340 2 $24,320 0 $0 5 $77,178 FILES CLOSED FOR INCOMPLETENESS 1 $49,790 5 $73,162 20 $44,785 2 $23,675 0 $0 0 $0
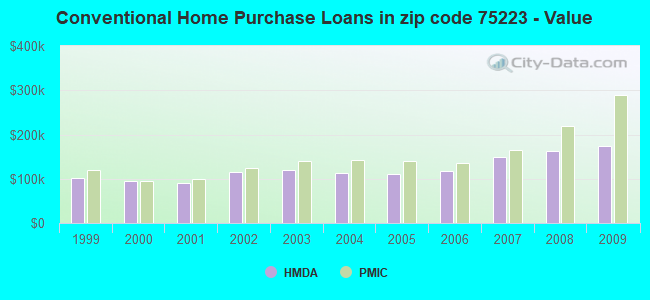
Private Mortgage Insurance Companies Aggregated Statistics For Year 2009(Based on 2 full and 2 partial tracts) A) Conventional B) Refinancings Number Average Value Number Average Value
LOANS ORIGINATED 20 $290,036 6 $210,745 APPLICATIONS APPROVED, NOT ACCEPTED 3 $341,190 2 $241,095 APPLICATIONS DENIED 4 $364,610 3 $383,900 APPLICATIONS WITHDRAWN 0 $0 2 $186,175 FILES CLOSED FOR INCOMPLETENESS 0 $0 0 $0
Aggregated Statistics For Year 2008(Based on 6 full and 4 partial tracts) A) Conventional B) Refinancings C) Non-occupant Loans on Number Average Value Number Average Value Number Average Value
LOANS ORIGINATED 36 $218,156 11 $148,831 9 $149,368 APPLICATIONS APPROVED, NOT ACCEPTED 11 $134,667 2 $197,920 3 $60,813 APPLICATIONS DENIED 2 $107,145 0 $0 2 $107,145 APPLICATIONS WITHDRAWN 4 $155,358 0 $0 0 $0 FILES CLOSED FOR INCOMPLETENESS 0 $0 0 $0 0 $0
Aggregated Statistics For Year 2007(Based on 6 full and 4 partial tracts) A) Conventional B) Refinancings C) Non-occupant Loans on Number Average Value Number Average Value Number Average Value
LOANS ORIGINATED 55 $164,143 3 $141,083 10 $131,709 APPLICATIONS APPROVED, NOT ACCEPTED 10 $115,976 5 $228,240 2 $118,950 APPLICATIONS DENIED 0 $0 0 $0 0 $0 APPLICATIONS WITHDRAWN 0 $0 0 $0 0 $0 FILES CLOSED FOR INCOMPLETENESS 0 $0 0 $0 0 $0
Aggregated Statistics For Year 2006(Based on 6 full and 4 partial tracts) A) Conventional B) Refinancings C) Non-occupant Loans on Number Average Value Number Average Value Number Average Value
LOANS ORIGINATED 42 $134,819 5 $207,318 6 $66,855 APPLICATIONS APPROVED, NOT ACCEPTED 11 $174,702 2 $62,555 0 $0 APPLICATIONS DENIED 0 $0 0 $0 0 $0 APPLICATIONS WITHDRAWN 0 $0 2 $104,255 0 $0 FILES CLOSED FOR INCOMPLETENESS 2 $100,960 0 $0 0 $0
Aggregated Statistics For Year 2005(Based on 6 full and 4 partial tracts) A) Conventional B) Refinancings C) Non-occupant Loans on Number Average Value Number Average Value Number Average Value
LOANS ORIGINATED 59 $139,707 4 $111,305 4 $202,848 APPLICATIONS APPROVED, NOT ACCEPTED 5 $79,700 7 $87,549 0 $0 APPLICATIONS DENIED 2 $86,955 0 $0 0 $0 APPLICATIONS WITHDRAWN 0 $0 0 $0 0 $0 FILES CLOSED FOR INCOMPLETENESS 2 $51,730 0 $0 0 $0
Aggregated Statistics For Year 2004(Based on 6 full and 4 partial tracts) A) Conventional B) Refinancings C) Non-occupant Loans on Number Average Value Number Average Value Number Average Value
LOANS ORIGINATED 54 $143,037 9 $95,791 10 $122,031 APPLICATIONS APPROVED, NOT ACCEPTED 17 $117,277 4 $158,752 4 $114,680 APPLICATIONS DENIED 2 $99,290 0 $0 0 $0 APPLICATIONS WITHDRAWN 7 $96,223 2 $24,315 0 $0 FILES CLOSED FOR INCOMPLETENESS 4 $105,528 0 $0 0 $0
Aggregated Statistics For Year 2003(Based on 6 full and 4 partial tracts) A) Conventional B) Refinancings C) Non-occupant Loans on Number Average Value Number Average Value Number Average Value
LOANS ORIGINATED 58 $140,597 31 $136,563 12 $108,270 APPLICATIONS APPROVED, NOT ACCEPTED 19 $171,686 5 $192,108 2 $56,435 APPLICATIONS DENIED 2 $85,965 0 $0 2 $85,965 APPLICATIONS WITHDRAWN 4 $100,112 2 $205,175 0 $0 FILES CLOSED FOR INCOMPLETENESS 2 $173,255 0 $0 0 $0
Aggregated Statistics For Year 2002(Based on 2 full and 4 partial tracts) A) Conventional B) Refinancings C) Non-occupant Loans on Number Average Value Number Average Value Number Average Value
LOANS ORIGINATED 41 $124,464 5 $143,652 10 $153,492 APPLICATIONS APPROVED, NOT ACCEPTED 4 $89,858 4 $78,260 0 $0 APPLICATIONS DENIED 0 $0 0 $0 0 $0 APPLICATIONS WITHDRAWN 2 $83,865 0 $0 0 $0 FILES CLOSED FOR INCOMPLETENESS 0 $0 0 $0 0 $0
Aggregated Statistics For Year 2001(Based on 2 full and 4 partial tracts) A) Conventional B) Refinancings C) Non-occupant Loans on Number Average Value Number Average Value Number Average Value
LOANS ORIGINATED 39 $100,256 3 $196,053 11 $62,667 APPLICATIONS APPROVED, NOT ACCEPTED 7 $169,144 2 $109,425 0 $0 APPLICATIONS DENIED 0 $0 0 $0 0 $0 APPLICATIONS WITHDRAWN 2 $123,865 0 $0 0 $0 FILES CLOSED FOR INCOMPLETENESS 2 $56,595 0 $0 0 $0
Aggregated Statistics For Year 2000(Based on 2 full and 4 partial tracts) A) Conventional B) Refinancings C) Non-occupant Loans on Number Average Value Number Average Value Number Average Value
LOANS ORIGINATED 35 $95,297 2 $177,815 5 $88,248 APPLICATIONS APPROVED, NOT ACCEPTED 8 $153,449 4 $77,445 0 $0 APPLICATIONS DENIED 8 $82,501 0 $0 6 $94,325 APPLICATIONS WITHDRAWN 7 $99,284 0 $0 2 $105,815 FILES CLOSED FOR INCOMPLETENESS 0 $0 0 $0 0 $0
Aggregated Statistics For Year 1999(Based on 2 full and 2 partial tracts) A) Conventional B) Refinancings C) Non-occupant Loans on Number Average Value Number Average Value Number Average Value
LOANS ORIGINATED 50 $119,206 5 $84,272 4 $94,652 APPLICATIONS APPROVED, NOT ACCEPTED 2 $105,745 2 $111,500 0 $0 APPLICATIONS DENIED 1 $69,000 1 $136,670 0 $0 APPLICATIONS WITHDRAWN 1 $149,900 1 $76,560 0 $0 FILES CLOSED FOR INCOMPLETENESS 1 $234,290 0 $0 0 $0
2002 - 2018 National Fire Incident Reporting System (NFIRS) incidents See full 2006 National Fire Incident Reporting System statistics for zip code 75223, Texas
Most common first names in zip code 75223 among deceased individuals Name Count Lived (average)
John 97 74.4 years William 90 74.0 years Willie 84 71.4 years Mary 84 78.0 years James 79 70.4 years Robert 53 71.0 years Charles 49 72.9 years George 45 73.4 years Joe 37 70.5 years Annie 34 79.1 years
Most common last names in zip code 75223 among deceased individuals Last name Count Lived (average)
Johnson 83 71.6 years Smith 80 73.8 years Williams 78 73.5 years Jones 63 73.3 years Jackson 37 69.2 years Davis 34 71.7 years Brown 31 71.1 years Taylor 27 71.4 years White 24 71.0 years Anderson 24 77.3 years
Businesses in zip code 75223
Name Count Name Count
7-Eleven 1 McDonald's 1 Church's Chicken 1 Nike 1 Circle K 2 Penske 1


 Nearest zip codes: 75210, 75246, 75226, 75214, 75215, 75204.
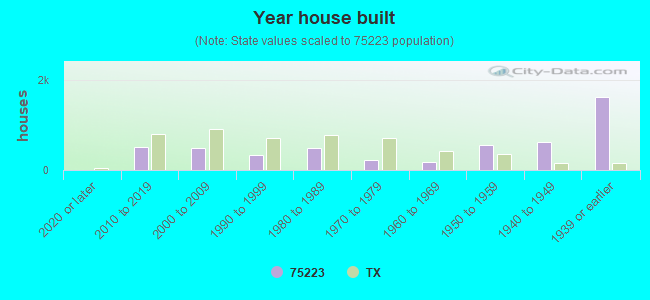


 Based on the data from the years 2002 - 2018 the average number of fire incidents per year is 45. The highest number of fires - 129 took place in 2003, and the least - 0 in 2005. The data has a decreasing trend.
 When looking into fire subcategories, the most reports belonged to: Outside Fires (48.9%), and Mobile Property/Vehicle Fires (24.9%).