Estimated zip code population in 2022: 6,427 Zip code population in 2010: 7,125 Zip code population in 2000: 10,032
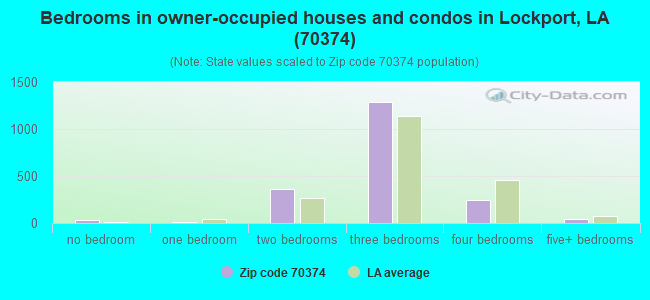
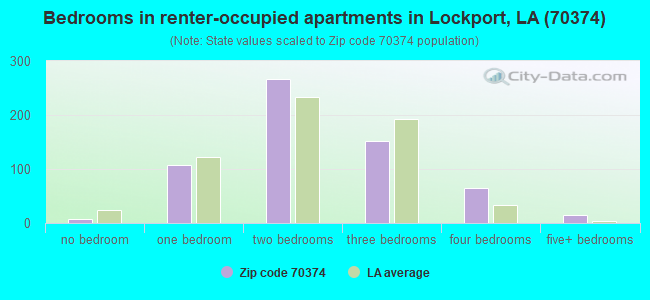
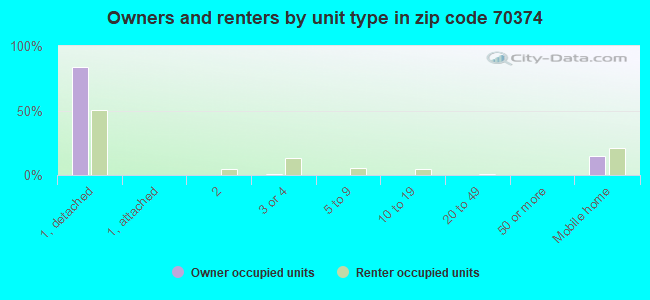
Houses and condos: 2,850 Renter-occupied apartments: 611
% of renters here:
24%
State:
32%
March 2022 cost of living index in zip code 70374: 83.7 (less than average, U.S. average is 100)
Land area: 49.4 sq. mi. Water area: 2.5 sq. mi.
Population density: 130 people per square mile
(very low).
OSM Map
General Map
Google Map
MSN Map
OSM Map
General Map
Google Map
MSN Map
OSM Map
General Map
Google Map
MSN Map
OSM Map
General Map
Google Map
MSN Map
Please wait while loading the map...
Real estate property taxes paid for housing units in 2022:
This zip code:
0.3% ($527)
Louisiana:
0.5% ($1,127)
Median real estate property taxes paid for housing units with mortgages in 2022: $597 (0.3%) Median real estate property taxes paid for housing units with no mortgage in 2022: $458 (0.3%)
Business Search- 14 Million verified businesses
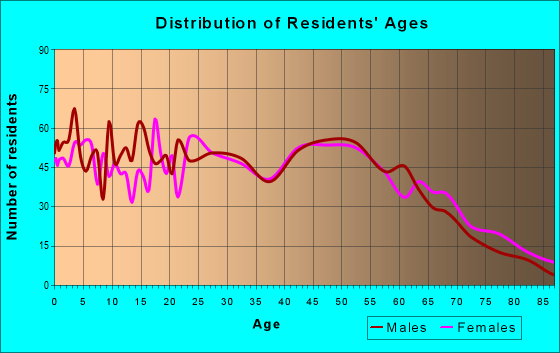
Males: 3,135
(48.8%)
Females: 3,292
(51.2%)
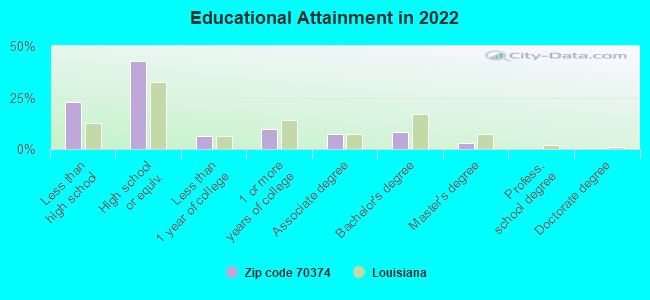
For population 25 years and over in 70374:
High school or higher: 75.7%
Bachelor's degree or higher: 10.9%
Graduate or professional degree: 3.0%
Unemployed: 4.9%
Mean travel time to work (commute): 28.9 minutes
For population 15 years and over in 70374:
Never married: 28.4%
Now married: 48.5%
Separated: 4.5%
Widowed: 8.4%
Divorced: 10.1%
Zip code 70374 compared to state average:
Black race population percentage significantly below state average.
Length of stay since moving in significantly above state average.
Number of college students below state average.
Percentage of population with a bachelor's degree or higher significantly below state average.
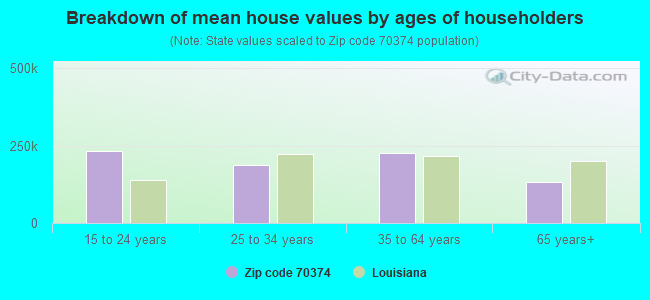
Estimated median house/condo value in 2022: $169,428
70374:
$169,428
Louisiana:
$209,200
According to our research of Louisiana and other state lists, there were 20 registered sex offenders living in 70374 zip code as of June 07, 2024. The ratio of all residents to sex offenders in zip code 70374 is 356 to 1. The ratio of registered sex offenders to all residents in this zip code is near the state average.
Median resident age:
This zip code:
41.9 years
Louisiana median age:
38.2 years
Average household size:
This zip code:
2.5 people
Louisiana:
2.5 people
Averages for the 2020 tax year for zip code 70374, filed in 2021:
Average Adjusted Gross Income (AGI) in 2020: $54,547 (Individual Income Tax Returns)
Here:
$54,547
State:
$60,757
Salary/wage: $51,734 (reported on 82.2% of returns)
Here:
$51,734
State:
$50,882
(% of AGI for various income ranges: 1055.5% for AGIs below $25k, 3485.3% for AGIs $25k-50k, 6212.2% for AGIs $50k-75k, 9182.9% for AGIs $75k-100k, 16063.5% for AGIs $100k-200k, 40470.0% for AGIs over 200k)
Taxable interest for individuals: $803 (reported on 25.9% of returns)
This zip code:
$803
Louisiana:
$1,576
(% of AGI for various income ranges: 9.1% for AGIs below $25k, 8.5% for AGIs $25k-50k, 31.9% for AGIs $50k-75k, 45.7% for AGIs $75k-100k, 75.7% for AGIs $100k-200k, 250.0% for AGIs over 200k)
Ordinary dividends: $5,788 (reported on 12.6% of returns)
Here:
$5,788
State:
$7,743
(% of AGI for various income ranges: 15.7% for AGIs below $25k, 12.8% for AGIs $25k-50k, 53.4% for AGIs $50k-75k, 104.8% for AGIs $75k-100k, 77.0% for AGIs $100k-200k, 4036.7% for AGIs over 200k)
Net capital gain/loss in AGI: +$10,455 (reported on 10.7% of returns)
Here:
+$10,455
State:
+$16,917
(% of AGI for various income ranges: 3.5% for AGIs below $25k, 7.9% for AGIs $25k-50k, 77.5% for AGIs $50k-75k, 215.2% for AGIs $75k-100k, 386.5% for AGIs $100k-200k, 4580.0% for AGIs over 200k)
Profit/loss from business: +$7,496 (reported on 16.7% of returns)
Here:
+$7,496
State:
+$7,679
(% of AGI for various income ranges: 137.1% for AGIs below $25k, 92.8% for AGIs $25k-50k, 72.8% for AGIs $50k-75k, 145.7% for AGIs $75k-100k, 559.1% for AGIs $100k-200k)
Taxable individual retirement arrangement distribution: $17,168 (reported on 8.1% of returns)
70374:
$17,168
Louisiana:
$20,716
(% of AGI for various income ranges: 68.1% for AGIs below $25k, 112.5% for AGIs $25k-50k, 149.4% for AGIs $50k-75k, 265.7% for AGIs $75k-100k, 704.8% for AGIs $100k-200k)
Total itemized deductions: $27,429 (reported on 2.6% of returns)
Here:
$27,429
State:
$36,265
(% of AGI for various income ranges: 218.1% for AGIs $50k-75k, 531.3% for AGIs $100k-200k)
Charity contributions: $7,633 (reported on 1.1% of returns)
Here:
$7,633
State:
$13,106
(% of AGI for various income ranges: 99.6% for AGIs $100k-200k)
Taxes paid: $7,180 (reported on 1.9% of returns)
70374:
$7,180
State:
$6,643
(% of AGI for various income ranges: 156.1% for AGIs $100k-200k)
Earned income credit: $2,383 (reported on 19.6% of returns)
Here:
$2,383
State:
$2,671
(% of AGI for various income ranges: 114.7% for AGIs below $25k, 71.7% for AGIs $25k-50k)
Percentage of individuals using paid preparers for their 2020 taxes: 93.0%
Here:
93%
State:
92%
(% for various income ranges: 92.0% for AGIs below $25k, 93.7% for AGIs $25k-50k, 94.9% for AGIs $50k-75k, 92.9% for AGIs $75k-100k, 94.1% for AGIs $100k-200k, 83.3% for AGIs over 200k)
Averages for the 2012 tax year for zip code 70374, filed in 2013:
Average Adjusted Gross Income (AGI) in 2012: $108,175 (Individual Income Tax Returns)
Here:
$108,175
State:
$56,730
Salary/wage: $52,857 (reported on 89.6% of returns)
Here:
$52,857
State:
$45,545
(% of AGI for various income ranges: 78.5% for AGIs below $25k, 85.9% for AGIs $25k-50k, 89.0% for AGIs $50k-75k, 86.1% for AGIs $75k-100k, 84.6% for AGIs $100k-200k, 11.9% for AGIs over 200k)
Taxable interest for individuals: $1,980 (reported on 30.1% of returns)
This zip code:
$1,980
Louisiana:
$1,804
(% of AGI for various income ranges: 1.0% for AGIs below $25k, 0.5% for AGIs $25k-50k, 0.2% for AGIs $50k-75k, 0.5% for AGIs $75k-100k, 0.4% for AGIs $100k-200k, 0.6% for AGIs over 200k)
Ordinary dividends: $65,324 (reported on 13.7% of returns)
Here:
$65,324
State:
$7,610
(% of AGI for various income ranges: 0.7% for AGIs below $25k, 0.7% for AGIs $25k-50k, 0.4% for AGIs $50k-75k, 0.4% for AGIs $75k-100k, 0.7% for AGIs $100k-200k, 14.2% for AGIs over 200k)
Net capital gain/loss in AGI: +$160,170 (reported on 9.0% of returns)
Here:
+$160,170
State:
+$17,096
(% of AGI for various income ranges: 0.2% for AGIs $50k-75k, 0.3% for AGIs $75k-100k, 0.6% for AGIs $100k-200k, 23.4% for AGIs over 200k)
Profit/loss from business: +$12,456 (reported on 14.4% of returns)
Here:
+$12,456
State:
+$12,088
(% of AGI for various income ranges: 7.3% for AGIs below $25k, 2.5% for AGIs $25k-50k, 1.9% for AGIs $50k-75k, 2.9% for AGIs $75k-100k, 1.9% for AGIs $100k-200k, 0.8% for AGIs over 200k)
Taxable individual retirement arrangement distribution: $15,548 (reported on 7.0% of returns)
70374:
$15,548
Louisiana:
$16,085
(% of AGI for various income ranges: 2.9% for AGIs below $25k, 1.9% for AGIs $25k-50k, 1.8% for AGIs $50k-75k, 2.1% for AGIs $75k-100k, 2.9% for AGIs $100k-200k)
Total itemized deductions: $49,179 (11% of AGI, reported on 15.7% of returns)
Here:
$49,179
State:
$23,585
Here:
10.8% of AGI
State:
18.1% of AGI
(% of AGI for various income ranges: 2.6% for AGIs below $25k, 3.9% for AGIs $25k-50k, 5.3% for AGIs $50k-75k, 5.4% for AGIs $75k-100k, 7.9% for AGIs $100k-200k, 8.3% for AGIs over 200k)
Charity contributions: $5,916 (reported on 10.7% of returns)
Here:
$5,916
State:
$5,533
(% of AGI for various income ranges: 0.5% for AGIs $25k-50k, 0.2% for AGIs $50k-75k, 0.5% for AGIs $75k-100k, 0.7% for AGIs $100k-200k, 0.7% for AGIs over 200k)
Taxes paid: $20,315 (reported on 15.7% of returns)
70374:
$20,315
State:
$6,282
(% of AGI for various income ranges: 0.3% for AGIs below $25k, 0.5% for AGIs $25k-50k, 0.9% for AGIs $50k-75k, 1.1% for AGIs $75k-100k, 2.1% for AGIs $100k-200k, 4.3% for AGIs over 200k)
Earned income credit: $2,228 (reported on 17.7% of returns)
Here:
$2,228
State:
$2,633
(% of AGI for various income ranges: 6.9% for AGIs below $25k, 0.9% for AGIs $25k-50k)
Percentage of individuals using paid preparers for their 2012 taxes: 58.5%
Here:
59%
State:
57%
(% for various income ranges: 52.3% for AGIs below $25k, 58.9% for AGIs $25k-50k, 55.3% for AGIs $50k-75k, 65.5% for AGIs $75k-100k, 68.6% for AGIs $100k-200k, 87.5% for AGIs over 200k)
Averages for the 2004 tax year for zip code 70374, filed in 2005:
Average Adjusted Gross Income (AGI) in 2004: $38,538 (Individual Income Tax Returns)
Here:
$38,538
State:
$39,411
Salary/wage: $35,957 (reported on 87.6% of returns)
Here:
$35,957
State:
$34,434
(% of AGI for various income ranges: 219.5% for AGIs below $10k, 78.5% for AGIs $10k-25k, 88.5% for AGIs $25k-50k, 88.9% for AGIs $50k-75k, 87.5% for AGIs $75k-100k, 54.2% for AGIs over 100k)
Taxable interest for individuals: $1,783 (reported on 36.6% of returns)
This zip code:
$1,783
Louisiana:
$1,606
(% of AGI for various income ranges: 19.6% for AGIs below $10k, 2.2% for AGIs $10k-25k, 1.0% for AGIs $25k-50k, 0.9% for AGIs $50k-75k, 0.9% for AGIs $75k-100k, 2.8% for AGIs over 100k)
Taxable dividends: $1,617 (reported on 16.7% of returns)
Here:
$1,617
State:
$3,235
(% of AGI for various income ranges: 8.3% for AGIs below $10k, 0.7% for AGIs $10k-25k, 0.4% for AGIs $25k-50k, 0.4% for AGIs $50k-75k, 0.4% for AGIs $75k-100k, 1.2% for AGIs over 100k)
Net capital gain/loss: +$16,942 (reported on 12.6% of returns)
Here:
+$16,942
State:
+$8,531
(% of AGI for various income ranges: 18.9% for AGIs below $10k, 0.7% for AGIs $10k-25k, -0.0% for AGIs $25k-50k, 0.6% for AGIs $50k-75k, 1.2% for AGIs $75k-100k, 22.9% for AGIs over 100k)
Profit/loss from business: +$9,998 (reported on 15.2% of returns)
Here:
+$9,998
State:
+$9,128
(% of AGI for various income ranges: 19.3% for AGIs below $10k, 7.2% for AGIs $10k-25k, 4.0% for AGIs $25k-50k, 1.1% for AGIs $50k-75k, 2.5% for AGIs $75k-100k, 5.8% for AGIs over 100k)
IRA payment deduction: $2,725 (reported on 2.5% of returns)
70374:
$2,725
Louisiana:
$3,055
(% of AGI for various income ranges: 0.3% for AGIs $10k-25k, 0.2% for AGIs $25k-50k, 0.2% for AGIs $50k-75k, 0.3% for AGIs $75k-100k)
Self-employed pension: $19,400 (reported on 0.3% of returns)
Here:
$19,400
Louisiana:
$17,274
Total itemized deductions: $15,770 (16% of AGI, reported on 12.3% of returns)
Here:
$15,770
State:
$18,222
Here:
16.5% of AGI
State:
20.3% of AGI
(% of AGI for various income ranges: 2.0% for AGIs $10k-25k, 3.9% for AGIs $25k-50k, 4.7% for AGIs $50k-75k, 7.5% for AGIs $75k-100k, 6.9% for AGIs over 100k)
Charity contributions deductions: $2,356 (2% of AGI, reported on 9.5% of returns)
Here:
$2,356
State:
$4,190
Here:
2.2% of AGI
State:
4.4% of AGI
(% of AGI for various income ranges: 0.1% for AGIs $10k-25k, 0.3% for AGIs $25k-50k, 0.5% for AGIs $50k-75k, 1.1% for AGIs $75k-100k, 0.9% for AGIs over 100k)
Total tax: $5,088 (reported on 73.3% of returns)
70374:
$5,088
State:
$6,529
(% of AGI for various income ranges: 5.3% for AGIs below $10k, 4.0% for AGIs $10k-25k, 6.5% for AGIs $25k-50k, 8.1% for AGIs $50k-75k, 10.6% for AGIs $75k-100k, 17.9% for AGIs over 100k)
Earned income credit: $1,713 (reported on 20.0% of returns)
Here:
$1,713
State:
$2,103
Percentage of individuals using paid preparers for their 2004 taxes: 58.8%
Here:
59%
State:
61%
(% for various income ranges: 53.2% for AGIs below $10k, 61.1% for AGIs $10k-25k, 58.3% for AGIs $25k-50k, 61.2% for AGIs $50k-75k, 57.5% for AGIs $75k-100k, 69.8% for AGIs over 100k)
Household received Food Stamps/SNAP in the past 12 months: 445 Household did not receive Food Stamps/SNAP in the past 12 months: 2,145
Women who had a birth in the past 12 months: 124 (58 now married, 66 unmarried) Women who did not have a birth in the past 12 months: 1,230 (522 now married, 705 unmarried)
Housing units in zip code 70374 with a mortgage: 913 (100 second mortgage, 85 both second mortgage and home equity loan) Houses without a mortgage: 23
Median monthly owner costs for units with a mortgage: $1,285 Median monthly owner costs for units without a mortgage: $330
Residents with income below the poverty level in 2022:
This zip code:
17.6%
Whole state:
18.6%
Residents with income below 50% of the poverty level in 2022:
This zip code:
5.1%
Whole state:
10.1%
Median number of rooms in houses and condos:
Here:
6.2
State:
6.2
Median number of rooms in apartments:
Here:
4.4
State:
4.4
Notable locations in this zip code not listed on our city pages
Notable locations in zip code 70374: Lockport Sewer Plant (A), Lafourche Parish Sheriff's Office - Communications Office (B), Bayou LaFourche Folklife and Heritage Museum (C), Lafourche Parish Library Lockport Branch (D), Lafourche Parish Sheriff's Office - Criminal Operations Center (E), Lockport Volunteer Fire Department Central Station (F), Lafourche Parish Fire Protection District 2 (G), Lockport Volunteer Fire Department 308 Station (H), Lockport Volunteer Fire Department Lockport Heights Station (I), Lockport Volunteer Fire Department Valentine Station (J). Display/hide their locations on the map
Churches in zip code 70374 include: Kingdom Hall of Jehovahs Witnesses (A), Holy Savior Catholic Church (B), Greater New Fountain Baptist Church (C), Victory Life Church (D). Display/hide their locations on the map
In group quarters: 30 (-1 institutionalized population)
Size of family households: 638 2-persons, 451 3-persons, 408 4-persons, 145 5-persons, 29 6-persons, 15 7-or-more-persons
Size of nonfamily households: 688 1-person, 209 2-persons
662 married couples with children.
593 single-parent households (58 men, 535 women).
84.7% of residents of 70374 zip code speak English at home.
6.6% of residents speak Spanish at home (66% very well, 10% well, 23% not well, 1% not at all).
7.2% of residents speak other Indo-European language at home (97% very well, 2% well).
0.8% of residents speak Asian or Pacific Island language at home (82% very well, 18% well).
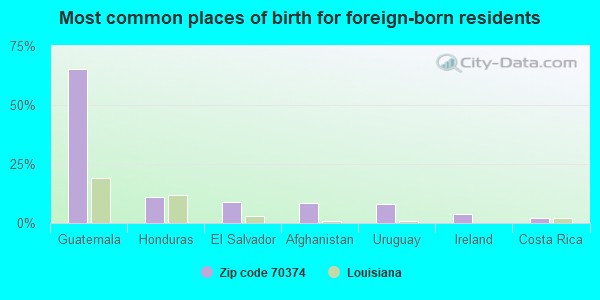
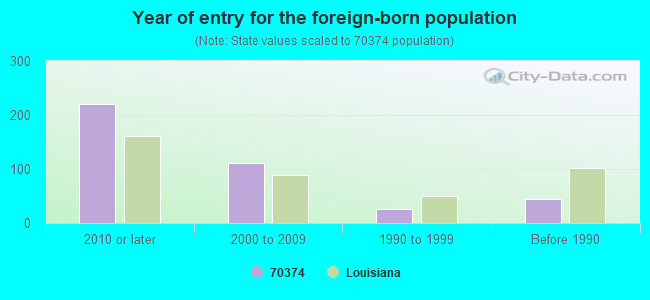
Foreign born population: 286 (4.5%) (23.5% of them are naturalized citizens)
This zip code:
4.5%
Whole state:
4.2%
65%Guatemala
11%Honduras
9%El Salvador
9%Afghanistan
8%Uruguay
4%Ireland
2%Costa Rica
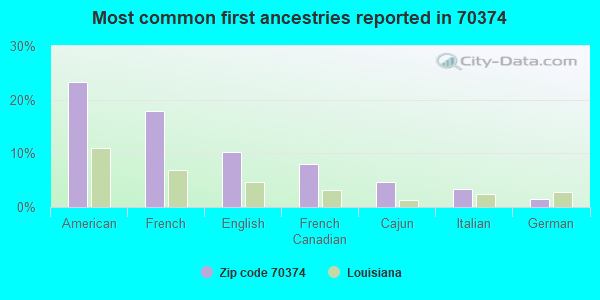
23%American
18%French
10%English
8%French Canadian
5%Cajun
3%Italian
1%German
Year of entry for the foreign-born population
2212010 or later
1112000 to 2009
261990 to 1999
45Before 1990
Major facilities with environmental interests located in this zip code:
HALTER MARINE, PLANT #84 (6130 HIGHWAY 308 in LOCKPORT, LA)
AIR MINOR (AIRS/AFS) CRITERIA AND HAZARDOUS AIR POLLUTANT INVENTORY (Inventory of air pollution sources) HAZARDOUS WASTE BIENNIAL REPORTER (Resource Conservation and Recovery Act (tracking hazardous waste)) Large Quantity Generators, more that 1000 kg of hazardous waste/month (Resource Conservation and Recovery Act (tracking hazardous waste)) - notification TRI REPORTER (Tracking of toxic chemicals releasing facilities) Business SIC and NAICS classification: SHIP BUILDING AND REPAIRING Organizations: FRIEDE GOLDMEN HALTER (CONTACT/OWNER)
Alternative names: BURLINGTON - GI 24/25 TB, HALTER LOCKPORT, HALTER MARINE CO, HALTER MARINE GRP INC, HALTER MARINE - LOCKPORT, HALTER MARINE LOCKPORT #84, P J LOUPE, VT HALTER MARINE INCORPORATED LOCKPORT OPERATIONS
NICOLAUS PAPER INC (LOCKPORT/2.5MSE H308 in LOCKPORT, LA)
(Integrated Compliance Information System) - ICIS-06-1979-0009, FORMAL ENFORCEMENT ACTION CRITERIA AND HAZARDOUS AIR POLLUTANT INVENTORY (Inventory of air pollution sources) Business SIC classification: PAPER MILLS
PAUL VERDIN (NO5 COMEAUX DR in LOCKPORT, LA)
Large Quantity Generators, more that 1000 kg of hazardous waste/month (Resource Conservation and Recovery Act (tracking hazardous waste)) - notification
AMERICAN BIOCHEMICAL CORP (8240 HIGHWAY 308, in LOCKPORT, LA)
National Pollutant Discharge Elimination System NON-MAJOR (Tracking pollutant discharge elimination systems) - permit Business SIC classification: SEWERAGE SYSTEMS
MR. B'S AARTMENTS (210 CRESCENT AVE. in LOCKPORT, LA)
National Pollutant Discharge Elimination System NON-MAJOR (Tracking pollutant discharge elimination systems) - permit Alternative names: MR. B'S APARTMENTS
HELIS OIL & GAS (EXXON FEE D W#1 in LOCKPORT, LA)
National Pollutant Discharge Elimination System NON-MAJOR (Tracking pollutant discharge elimination systems) - permit
HELIS OIL & GAS CO (EXXON FEE "C" WELL #1 in LOCKPORT, LA)
National Pollutant Discharge Elimination System NON-MAJOR (Tracking pollutant discharge elimination systems) - permit Business SIC classification: CRUDE PETROLEUM AND NATURAL GAS
CITY PLACE II HOUSING CORP (164 CITY PLACE DR in LOCKPORT, LA)
National Pollutant Discharge Elimination System NON-MAJOR (Tracking pollutant discharge elimination systems) - permit Business SIC classification: REAL ESTATE AGENTS AND MANAGERS Alternative names: MILLER & ASSOCIATES
ECONOMY INN (5656 NORTH HIGHWAY 1 in LOCKPORT, LA)
National Pollutant Discharge Elimination System NON-MAJOR (Tracking pollutant discharge elimination systems) - permit Business SIC classification: SEWERAGE SYSTEMS
ENTERGY LA INC MAIN ST (110 MAIN ST in LOCKPORT, LA)
Conditionally Exempt Small Quantity Generators, less than 100 kg/month of hazardous waste (Resource Conservation and Recovery Act (tracking hazardous waste))
EXXON FEE D WELL #1 - WILDCAT FIELD CO C (4.2 MI W OF in LOCKPORT, LA)
AIR MINOR (AIRS/AFS) Business SIC classification: CRUDE PETROLEUM AND NATURAL GAS Alternative names: EXXON FEE "D" WELL #1 - WILDCAT FIELD CO
EXXONMOBIL PIPELINE CO (LAROSE CRUDE OIL STATION in LOCKPORT, LA)
National Pollutant Discharge Elimination System NON-MAJOR (Tracking pollutant discharge elimination systems) - permit Business SIC classification: SEWERAGE SYSTEMS
AUTIN MTRS (HWY 1 N 2 M N LOCKPORT in LOCKPORT, LA) . Tribal Land
Small Quantity Generators, between 100 kg and 1000 kg of hazardous waste/month (Resource Conservation and Recovery Act (tracking hazardous waste)) - notification Organizations: AUTIN MOTORS INC (CONTACT/OWNER)
Housing units lacking complete plumbing facilities: 2.2% Housing units lacking complete kitchen facilities: 2.3%
57.9%Electricity
40.9%Utility gas
1.2%No fuel used
Population in 1990: 10,863.
Place of birth for U.S.-born residents:
This state: 5,692
Northeast: 8
Midwest: 53
South: 194
West: 67
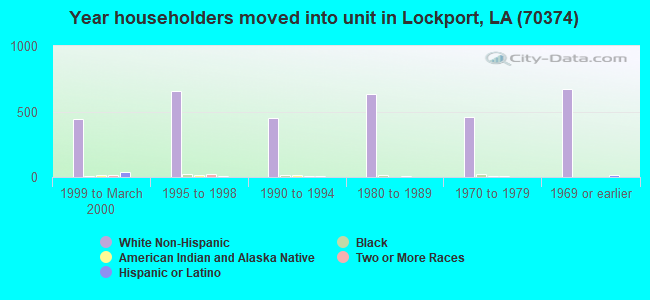
73% of the 70374 zip code residents lived in the same house 5 years ago. Out of people who lived in different houses, 78% lived in this county. Out of people who lived in different counties, 50% lived in Louisiana.
91% of the 70374 zip code residents lived in the same house 1 year ago. Out of people who lived in different houses, 96% moved from this county. Out of people who lived in different houses, 1% moved from different state.
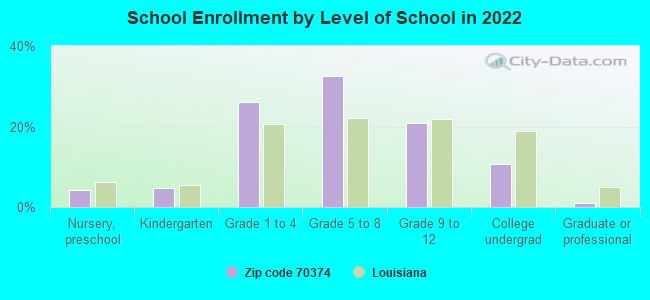
Private vs. public school enrollment:
Students in private schools in grades 1 to 8 (elementary and middle school): 151
Here:
21.1%
Louisiana:
19.6%
Students in private schools in grades 9 to 12 (high school): 23
Here:
9.2%
Louisiana:
18.3%
Students in private undergraduate colleges: 16
Here:
13.0%
Louisiana:
17.4%
Occupation by median earnings in the past 12 months ($)
107,419Architecture and engineering occupations
93,170Health diagnosing and treating practitioners and other technical occupations
85,252Management occupations
73,382Installation, maintenance, and repair occupations
56,248Construction and extraction occupations
46,291Transportation occupations
Companies with federal contracts located in this zip code (LOCKPORT, LA):
BOLLINGER INCAT USA, L L C (8365 HIGHWAY 308) : $174,404,202 in 207 contractsfrom 2001 to 2006
Contracts for Miscellaneous Vessels, Transport Vessels-Passenger And Troop, Trucks and Truck Tractors, Wheeled, Training Aids by Navy, Army Signed by year:2000: $0; 2001: $5,423,037; 2002: $41,876,653; 2003: $44,266,445; 2004: $34,805,527; 2005: $30,684,476; 2006: $17,348,064.
Biggest contracts:
$13,623,829 with Navy for Miscellaneous Vessels. Signed on 2002-10-22. Completion date: 2004-06-30.
$11,866,212 with Army for Transport Vessels-Passenger And Troop. Signed on 2002-11-20. Completion date: 2005-11-15.
$11,789,888, same as above.Signed on 2003-11-07. Completion date: 2005-11-15.
$10,292,599 with Navy for Miscellaneous Vessels. Signed on 2006-02-03. Completion date: 2005-08-14.
BORDELON MARINE INC (127 WAGUESPACK ST; small business)
$133,590 with Navy for Marine Charter for Things. Taking place in FL. Signed on 2005-05-02. Completion date: 2005-05-22.
WELCH SALES & SERVICE INC (11905 HIGHWAY 308) : $26,863 in 5 contractsfrom 2005 to 2006
Contracts for Hardware, Commercial, Lease or Rental of Equipment -- Electric Wire, and Power and Distribution Equipment by Army Signed by year:2000: $0; 2001: $0; 2002: $0; 2003: $0; 2004: $0; 2005: $25,319; 2006: $1,544.
Biggest contracts:
$23,189 with Army for Hardware, Commercial. Signed on 2005-11-10. Completion date: 2005-11-30.
$3,920 with Army for Lease or Rental of Equipment -- Electric Wire, and Power and Distribution Equipment. Signed on 2005-12-16. Completion date: 2006-02-08.
$936, same as above.Signed on 2006-05-18. Completion date: 2006-02-08.
$608 with Army for Hardware, Commercial. Signed on 2006-05-03. Completion date: 2005-11-30.
BREAUX PETROLEUM PRODUCTS INC (237 N BARRIOS ST; small business)
$17,215 with U.S. Army Corps of Engineers - civil program financing only for Fuel Oils. Signed on 2003-07-01. Completion date: 2003-07-07.
Top industries in this zip code by the number of employees in 2005:
Administrative and Support and Waste Management and Remediation Services: Temporary Help Services (100-249 employees: 1 establishment)
Real Estate and Rental and Leasing: Other Commercial and Industrial Machinery and Equipment Rental and Leasing (100-249: 1)
Professional, Scientific, and Technical Services: Payroll Services (50-99: 1)
Finance and Insurance: Insurance Agencies and Brokerages (10-19: 4, 1-4: 2)
People in group quarters in 2010:
7 people in group homes intended for adults
4 people in other noninstitutional facilities
People in group quarters in 2000:
8 people in religious group quarters
6 people in other noninstitutional group quarters
Fatal accident statistics in 2014:
Fatal accident count: 3
Vehicles involved in fatal accidents: 5
Fatal accidents caused by drunken drivers: 1
Fatalities: 3
Persons involved in fatal accidents: 7
Pedestrians involved in fatal accidents: 0
Fatal accident statistics in 2013:
Fatal accident count: 1
Vehicles involved in fatal accidents: 2
Fatal accidents caused by drunken drivers: 0
Fatalities: 1
Persons involved in fatal accidents: 4
Pedestrians involved in fatal accidents: 0
Home Mortgage Disclosure Act Aggregated Statistics For Year 2009 (Based on 2 full and 10 partial tracts)
A) FHA, FSA/RHS & VA Home Purchase Loans
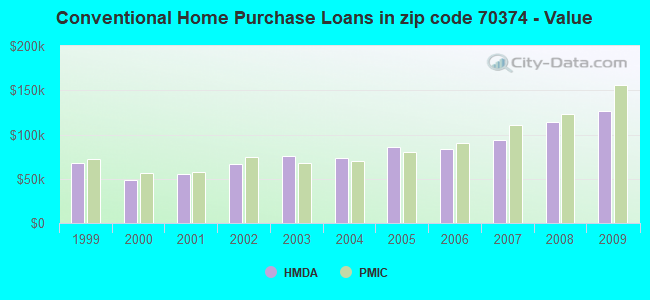
B) Conventional Home Purchase Loans
C) Refinancings
D) Home Improvement Loans
E) Loans on Dwellings For 5+ Families
F) Non-occupant Loans on < 5 Family Dwellings (A B C & D)
G) Loans On Manufactured Home Dwelling (A B C & D)
Number
Average Value
Number
Average Value
Number
Average Value
Number
Average Value
Number
Average Value
Number
Average Value
Number
Average Value
LOANS ORIGINATED
41
$121,484
68
$126,701
203
$108,252
48
$56,494
1
$181,860
27
$127,097
25
$48,712
APPLICATIONS APPROVED, NOT ACCEPTED
5
$96,090
7
$75,887
30
$115,419
3
$23,767
0
$0
3
$43,340
4
$46,442
APPLICATIONS DENIED
13
$138,605
26
$62,583
86
$99,651
33
$23,922
0
$0
9
$48,213
30
$54,842
APPLICATIONS WITHDRAWN
2
$114,940
10
$94,273
36
$132,432
4
$118,352
0
$0
0
$0
3
$50,893
FILES CLOSED FOR INCOMPLETENESS
1
$90,560
0
$0
20
$100,385
1
$87,530
0
$0
0
$0
3
$55,070
Aggregated Statistics For Year 2008 (Based on 2 full and 10 partial tracts)
A) FHA, FSA/RHS & VA Home Purchase Loans
B) Conventional Home Purchase Loans
C) Refinancings
D) Home Improvement Loans
E) Loans on Dwellings For 5+ Families
F) Non-occupant Loans on < 5 Family Dwellings (A B C & D)
G) Loans On Manufactured Home Dwelling (A B C & D)
Number
Average Value
Number
Average Value
Number
Average Value
Number
Average Value
Number
Average Value
Number
Average Value
Number
Average Value
LOANS ORIGINATED
33
$129,248
79
$114,123
151
$87,813
62
$38,913
3
$120,550
15
$139,075
36
$46,559
APPLICATIONS APPROVED, NOT ACCEPTED
5
$146,362
12
$77,586
18
$89,925
4
$20,835
0
$0
3
$47,907
7
$55,500
APPLICATIONS DENIED
3
$142,510
42
$63,572
98
$102,114
42
$54,932
0
$0
6
$31,648
39
$54,694
APPLICATIONS WITHDRAWN
2
$161,990
11
$110,290
37
$118,696
4
$80,252
0
$0
4
$80,650
5
$80,608
FILES CLOSED FOR INCOMPLETENESS
1
$183,560
3
$115,697
6
$110,958
4
$54,065
0
$0
0
$0
0
$0
Aggregated Statistics For Year 2007 (Based on 2 full and 10 partial tracts)
A) FHA, FSA/RHS & VA Home Purchase Loans
B) Conventional Home Purchase Loans
C) Refinancings
D) Home Improvement Loans
E) Loans on Dwellings For 5+ Families
F) Non-occupant Loans on < 5 Family Dwellings (A B C & D)
G) Loans On Manufactured Home Dwelling (A B C & D)
Number
Average Value
Number
Average Value
Number
Average Value
Number
Average Value
Number
Average Value
Number
Average Value
Number
Average Value
LOANS ORIGINATED
15
$111,921
118
$94,151
189
$84,787
92
$40,677
1
$259,180
34
$64,705
44
$42,641
APPLICATIONS APPROVED, NOT ACCEPTED
4
$55,275
35
$93,953
31
$93,107
11
$25,193
0
$0
2
$54,495
21
$58,837
APPLICATIONS DENIED
6
$71,838
37
$77,288
121
$101,352
79
$52,452
0
$0
19
$69,627
42
$53,253
APPLICATIONS WITHDRAWN
1
$128,320
14
$90,460
43
$99,141
16
$70,722
0
$0
2
$73,600
8
$50,554
FILES CLOSED FOR INCOMPLETENESS
1
$64,260
3
$145,787
8
$121,106
1
$53,550
0
$0
1
$297,430
1
$110,470
Aggregated Statistics For Year 2006 (Based on 2 full and 10 partial tracts)
A) FHA, FSA/RHS & VA Home Purchase Loans
B) Conventional Home Purchase Loans
C) Refinancings
D) Home Improvement Loans
E) Loans on Dwellings For 5+ Families
F) Non-occupant Loans on < 5 Family Dwellings (A B C & D)
G) Loans On Manufactured Home Dwelling (A B C & D)
Number
Average Value
Number
Average Value
Number
Average Value
Number
Average Value
Number
Average Value
Number
Average Value
Number
Average Value
LOANS ORIGINATED
11
$81,907
163
$83,995
188
$75,805
71
$33,547
3
$92,063
32
$64,020
45
$45,235
APPLICATIONS APPROVED, NOT ACCEPTED
9
$82,751
29
$72,776
34
$80,164
6
$30,477
0
$0
2
$59,230
15
$59,674
APPLICATIONS DENIED
7
$55,069
67
$71,177
102
$96,065
48
$35,101
0
$0
6
$51,605
52
$49,390
APPLICATIONS WITHDRAWN
0
$0
15
$74,785
60
$96,029
7
$54,089
0
$0
2
$134,785
5
$27,326
FILES CLOSED FOR INCOMPLETENESS
0
$0
5
$127,190
11
$124,336
2
$29,065
0
$0
0
$0
0
$0
Aggregated Statistics For Year 2005 (Based on 2 full and 10 partial tracts)
A) FHA, FSA/RHS & VA Home Purchase Loans
B) Conventional Home Purchase Loans
C) Refinancings
D) Home Improvement Loans
E) Loans on Dwellings For 5+ Families
F) Non-occupant Loans on < 5 Family Dwellings (A B C & D)
G) Loans On Manufactured Home Dwelling (A B C & D)
Number
Average Value
Number
Average Value
Number
Average Value
Number
Average Value
Number
Average Value
Number
Average Value
Number
Average Value
LOANS ORIGINATED
27
$99,953
127
$86,209
211
$71,819
64
$38,746
2
$172,445
22
$86,422
34
$39,319
APPLICATIONS APPROVED, NOT ACCEPTED
2
$84,130
24
$74,129
41
$72,092
22
$29,323
0
$0
2
$51,010
12
$63,253
APPLICATIONS DENIED
2
$82,530
44
$62,181
165
$77,280
33
$27,545
0
$0
11
$43,883
39
$40,819
APPLICATIONS WITHDRAWN
1
$31,440
12
$68,647
61
$95,249
6
$54,232
0
$0
3
$79,313
4
$37,300
FILES CLOSED FOR INCOMPLETENESS
2
$75,565
3
$54,027
25
$106,657
1
$73,080
0
$0
0
$0
0
$0
Aggregated Statistics For Year 2004 (Based on 2 full and 10 partial tracts)
A) FHA, FSA/RHS & VA Home Purchase Loans
B) Conventional Home Purchase Loans
C) Refinancings
D) Home Improvement Loans
E) Loans on Dwellings For 5+ Families
F) Non-occupant Loans on < 5 Family Dwellings (A B C & D)
G) Loans On Manufactured Home Dwelling (A B C & D)
Number
Average Value
Number
Average Value
Number
Average Value
Number
Average Value
Number
Average Value
Number
Average Value
Number
Average Value
LOANS ORIGINATED
23
$102,672
131
$73,865
301
$73,038
68
$36,735
4
$133,548
43
$46,399
31
$49,158
APPLICATIONS APPROVED, NOT ACCEPTED
3
$95,177
19
$63,056
72
$82,998
14
$25,953
2
$138,095
1
$117,660
20
$40,984
APPLICATIONS DENIED
7
$70,850
51
$47,958
175
$74,224
45
$43,937
0
$0
14
$52,144
63
$44,008
APPLICATIONS WITHDRAWN
0
$0
12
$65,684
69
$99,307
4
$49,340
1
$76,480
1
$53,550
8
$46,985
FILES CLOSED FOR INCOMPLETENESS
0
$0
3
$70,337
29
$102,833
0
$0
0
$0
2
$50,140
2
$79,465
Aggregated Statistics For Year 2003 (Based on 2 full and 10 partial tracts)
A) FHA, FSA/RHS & VA Home Purchase Loans
B) Conventional Home Purchase Loans
C) Refinancings
D) Home Improvement Loans
E) Loans on Dwellings For 5+ Families
F) Non-occupant Loans on < 5 Family Dwellings (A B C & D)
Number
Average Value
Number
Average Value
Number
Average Value
Number
Average Value
Number
Average Value
Number
Average Value
LOANS ORIGINATED
20
$73,928
125
$75,224
388
$73,034
75
$24,650
2
$42,915
33
$45,201
APPLICATIONS APPROVED, NOT ACCEPTED
6
$65,223
30
$65,768
79
$71,977
12
$20,021
2
$242,200
2
$45,240
APPLICATIONS DENIED
4
$64,892
53
$53,587
188
$70,758
35
$24,610
0
$0
6
$77,058
APPLICATIONS WITHDRAWN
2
$50,380
8
$42,156
38
$81,324
1
$5,950
0
$0
2
$20,345
FILES CLOSED FOR INCOMPLETENESS
0
$0
2
$24,805
7
$120,297
0
$0
0
$0
0
$0
Aggregated Statistics For Year 2002 (Based on 2 full and 6 partial tracts)
A) FHA, FSA/RHS & VA Home Purchase Loans
B) Conventional Home Purchase Loans
C) Refinancings
D) Home Improvement Loans
E) Loans on Dwellings For 5+ Families
F) Non-occupant Loans on < 5 Family Dwellings (A B C & D)
Number
Average Value
Number
Average Value
Number
Average Value
Number
Average Value
Number
Average Value
Number
Average Value
LOANS ORIGINATED
17
$69,414
91
$66,840
256
$61,369
88
$29,727
2
$77,505
26
$51,060
APPLICATIONS APPROVED, NOT ACCEPTED
6
$71,003
22
$48,967
50
$71,442
14
$15,807
0
$0
0
$0
APPLICATIONS DENIED
6
$71,378
36
$41,978
82
$58,042
40
$17,588
0
$0
1
$20,460
APPLICATIONS WITHDRAWN
2
$82,630
9
$71,707
39
$66,102
4
$7,885
0
$0
3
$78,160
FILES CLOSED FOR INCOMPLETENESS
0
$0
0
$0
10
$64,287
0
$0
0
$0
0
$0
Aggregated Statistics For Year 2001 (Based on 2 full and 6 partial tracts)
A) FHA, FSA/RHS & VA Home Purchase Loans
B) Conventional Home Purchase Loans
C) Refinancings
D) Home Improvement Loans
E) Loans on Dwellings For 5+ Families
F) Non-occupant Loans on < 5 Family Dwellings (A B C & D)
Number
Average Value
Number
Average Value
Number
Average Value
Number
Average Value
Number
Average Value
Number
Average Value
LOANS ORIGINATED
23
$70,842
90
$54,839
245
$61,017
75
$23,478
1
$84,980
13
$59,348
APPLICATIONS APPROVED, NOT ACCEPTED
0
$0
20
$41,481
38
$55,123
7
$21,213
0
$0
6
$72,810
APPLICATIONS DENIED
0
$0
59
$37,621
111
$51,638
20
$30,140
2
$216,040
8
$38,286
APPLICATIONS WITHDRAWN
0
$0
21
$53,435
42
$56,610
1
$37,340
0
$0
0
$0
FILES CLOSED FOR INCOMPLETENESS
0
$0
0
$0
13
$73,348
0
$0
0
$0
0
$0
Aggregated Statistics For Year 2000 (Based on 2 full and 6 partial tracts)
A) FHA, FSA/RHS & VA Home Purchase Loans
B) Conventional Home Purchase Loans
C) Refinancings
D) Home Improvement Loans
E) Loans on Dwellings For 5+ Families
F) Non-occupant Loans on < 5 Family Dwellings (A B C & D)
Number
Average Value
Number
Average Value
Number
Average Value
Number
Average Value
Number
Average Value
Number
Average Value
LOANS ORIGINATED
10
$54,104
88
$48,910
149
$39,677
53
$23,286
2
$82,350
11
$23,066
APPLICATIONS APPROVED, NOT ACCEPTED
2
$36,115
24
$46,145
37
$38,472
24
$24,237
0
$0
2
$5,815
APPLICATIONS DENIED
0
$0
46
$44,424
111
$44,695
14
$19,161
0
$0
13
$43,295
APPLICATIONS WITHDRAWN
2
$42,625
8
$48,896
52
$63,726
3
$15,320
0
$0
0
$0
FILES CLOSED FOR INCOMPLETENESS
2
$62,885
1
$78,530
26
$42,375
2
$435,960
0
$0
2
$435,960
Aggregated Statistics For Year 1999 (Based on 1 full and 5 partial tracts)
A) FHA, FSA/RHS & VA Home Purchase Loans
B) Conventional Home Purchase Loans
C) Refinancings
D) Home Improvement Loans
F) Non-occupant Loans on < 5 Family Dwellings (A B C & D)
2002 - 2018 National Fire Incident Reporting System (NFIRS) incidents
According to the data from the years 2002 - 2018 the average number of fires per year is 12. The highest number of reported fires - 48 took place in 2018, and the least - 0 in 2004. The data has a growing trend.
When looking into fire subcategories, the most incidents belonged to: Outside Fires (51.0%), and Structure Fires (33.3%).
Fire incident types reported to NFIRS in Zip Code 70374
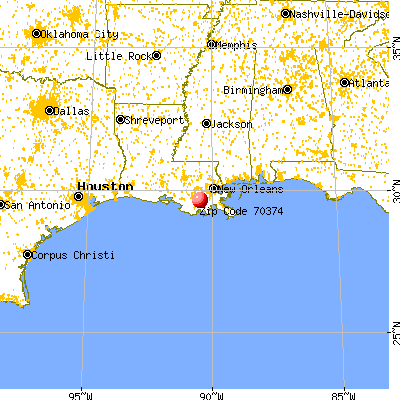


 Nearest zip codes: 70343, 70375, 70355, 70394, 70364, 70373.


 According to the data from the years 2002 - 2018 the average number of fires per year is 12. The highest number of reported fires - 48 took place in 2018, and the least - 0 in 2004. The data has a growing trend.
 When looking into fire subcategories, the most incidents belonged to: Outside Fires (51.0%), and Structure Fires (33.3%).