Estimated zip code population in 2022: 378 Zip code population in 2010: 343 Zip code population in 2000: 384
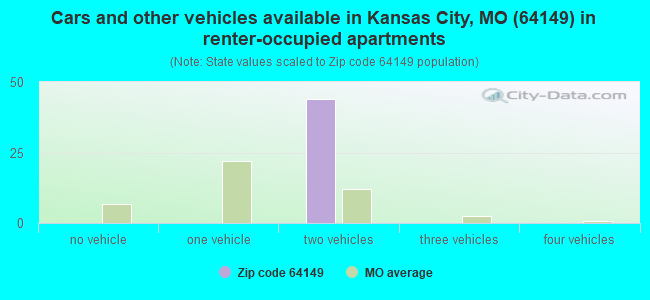
Houses and condos: 136 Renter-occupied apartments: 44
% of renters here:
32%
State:
32%
March 2022 cost of living index in zip code 64149: 78.0 (low, U.S. average is 100)
Land area: 8.5 sq. mi. Water area: 0.3 sq. mi.
Population density: 44 people per square mile
(very low).
OSM Map
General Map
Google Map
MSN Map
OSM Map
General Map
Google Map
MSN Map
OSM Map
General Map
Google Map
MSN Map
OSM Map
General Map
Google Map
MSN Map
Please wait while loading the map...
Real estate property taxes paid for housing units in 2022:
This zip code:
1.0% ($4,066)
Missouri:
0.8% ($1,810)
Median real estate property taxes paid for housing units with mortgages in 2022: $4,307 (1.7%) Median real estate property taxes paid for housing units with no mortgage in 2022: $3,818 (2.1%)
Business Search- 14 Million verified businesses
Males: 179
(47.4%)
Females: 199
(52.6%)
For population 25 years and over in 64149:
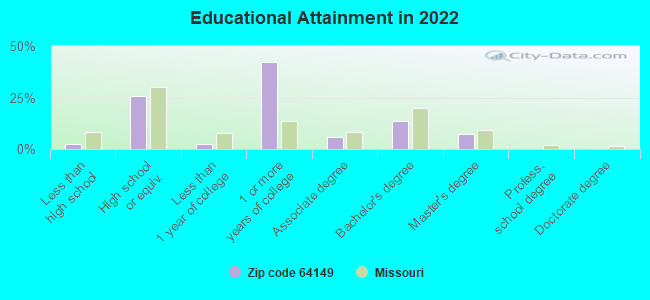
High school or higher: 95.3%
Bachelor's degree or higher: 20.9%
Graduate or professional degree: 7.3%
Unemployed: 2.9%
Mean travel time to work (commute): 58.2 minutes
For population 15 years and over in 64149:
Never married: 9.2%
Now married: 72.7%
Separated: 0.0%
Widowed: 7.1%
Divorced: 11.0%
Zip code 64149 compared to state average:
Median house value above state average.
Black race population percentage significantly below state average.
Foreign-born population percentage significantly below state average.
Length of stay since moving in significantly above state average.
Number of college students significantly below state average.
Percentage of population with a bachelor's degree or higher below state average.
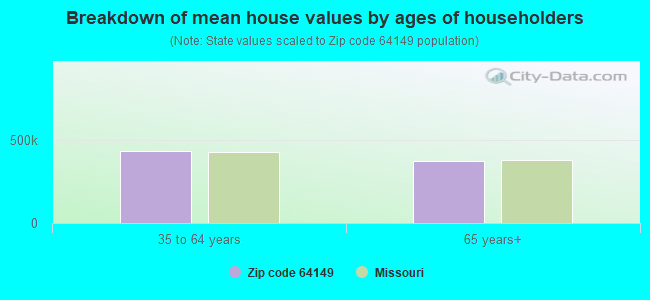
Estimated median house/condo value in 2022: $406,791
64149:
$406,791
Missouri:
$221,200
Median resident age:
This zip code:
37.4 years
Missouri median age:
39.1 years
Average household size:
This zip code:
2.7 people
Missouri:
2.4 people
Averages for the 2020 tax year for zip code 64149, filed in 2021:
Average Adjusted Gross Income (AGI) in 2020: $119,105 (Individual Income Tax Returns)
Here:
$119,105
State:
$68,151
Salary/wage: $80,917 (reported on 60.0% of returns)
Here:
$80,917
State:
$56,131
(% of AGI for various income ranges: 1608.0% for AGIs below $25k, 6846.7% for AGIs $50k-75k, 14060.0% for AGIs $100k-200k)
Taxable interest for individuals: $778 (reported on 45.0% of returns)
This zip code:
$778
Missouri:
$1,586
(% of AGI for various income ranges: 103.3% for AGIs $50k-75k, 135.0% for AGIs $100k-200k)
Ordinary dividends: $4,917 (reported on 30.0% of returns)
Here:
$4,917
State:
$10,947
(% of AGI for various income ranges: 90.0% for AGIs below $25k, 1250.0% for AGIs $100k-200k)
Net capital gain/loss in AGI: +$20,320 (reported on 25.0% of returns)
Here:
+$20,320
State:
+$18,453
(% of AGI for various income ranges: 5080.0% for AGIs $100k-200k)
Profit/loss from business: +$22,367 (reported on 15.0% of returns)
Here:
+$22,367
State:
+$12,260
(% of AGI for various income ranges: 2236.7% for AGIs $50k-75k)
Taxable individual retirement arrangement distribution: $23,300 (reported on 10.0% of returns)
64149:
$23,300
Missouri:
$19,719
(% of AGI for various income ranges: )
Total itemized deductions: $42,000 (reported on 10.0% of returns)
Here:
$42,000
State:
$36,651
(% of AGI for various income ranges: )
Taxes paid: $9,500 (reported on 10.0% of returns)
64149:
$9,500
State:
$7,608
(% of AGI for various income ranges: )
Percentage of individuals using paid preparers for their 2020 taxes: 90.0%
Here:
90%
State:
93%
(% for various income ranges: 80.0% for AGIs below $25k, 100.0% for AGIs $25k-50k, 133.3% for AGIs $50k-75k, 0.0% for AGIs $75k-100k, 100.0% for AGIs $100k-200k, 100.0% for AGIs over 200k)
Averages for the 2012 tax year for zip code 64149, filed in 2013:
Average Adjusted Gross Income (AGI) in 2012: $79,690 (Individual Income Tax Returns)
Here:
$79,690
State:
$55,896
Salary/wage: $70,267 (reported on 75.0% of returns)
Here:
$70,267
State:
$46,205
(% of AGI for various income ranges: 62.2% for AGIs below $25k, 68.1% for AGIs $25k-50k, 119.8% for AGIs $50k-75k, 69.1% for AGIs $100k-200k)
Taxable interest for individuals: $873 (reported on 55.0% of returns)
This zip code:
$873
Missouri:
$1,559
(% of AGI for various income ranges: 2.7% for AGIs below $25k, 0.2% for AGIs $50k-75k, 0.7% for AGIs $100k-200k)
Ordinary dividends: $1,233 (reported on 30.0% of returns)
Here:
$1,233
State:
$7,410
Profit/loss from business: +$25,000 (reported on 10.0% of returns)
Here:
+$25,000
State:
+$11,688
Taxable individual retirement arrangement distribution: $13,900 (reported on 10.0% of returns)
64149:
$13,900
Missouri:
$14,773
Total itemized deductions: $24,944 (18% of AGI, reported on 45.0% of returns)
Here:
$24,944
State:
$22,730
Here:
17.6% of AGI
State:
19.2% of AGI
Charity contributions: $3,425 (reported on 40.0% of returns)
Here:
$3,425
State:
$4,745
Taxes paid: $12,756 (reported on 45.0% of returns)
64149:
$12,756
State:
$8,399
Percentage of individuals using paid preparers for their 2012 taxes: 60.0%
Here:
60%
State:
55%
(% for various income ranges: 80.0% for AGIs below $25k, 133.3% for AGIs $50k-75k, 66.7% for AGIs $100k-200k)
Averages for the 2004 tax year for zip code 64149, filed in 2005:
Average Adjusted Gross Income (AGI) in 2004: $63,547 (Individual Income Tax Returns)
Here:
$63,547
State:
$44,591
Salary/wage: $49,890 (reported on 80.1% of returns)
Here:
$49,890
State:
$38,941
(% of AGI for various income ranges: 88.0% for AGIs below $10k, 66.1% for AGIs $10k-25k, 66.4% for AGIs $25k-50k, 55.1% for AGIs $50k-75k, 81.2% for AGIs $75k-100k, 54.3% for AGIs over 100k)
Taxable interest for individuals: $1,121 (reported on 72.9% of returns)
This zip code:
$1,121
Missouri:
$1,801
(% of AGI for various income ranges: 3.9% for AGIs $10k-25k, 1.1% for AGIs $25k-50k, 2.9% for AGIs $50k-75k, 0.4% for AGIs $75k-100k, 1.0% for AGIs over 100k)
Taxable dividends: $974 (reported on 43.1% of returns)
Here:
$974
State:
$3,677
(% of AGI for various income ranges: 6.4% for AGIs below $10k, 0.6% for AGIs $25k-50k, 0.5% for AGIs $50k-75k, 0.3% for AGIs $75k-100k, 0.8% for AGIs over 100k)
Net capital gain/loss: +$8,415 (reported on 35.9% of returns)
Here:
+$8,415
State:
+$8,915
(% of AGI for various income ranges: -1.6% for AGIs below $10k, -0.5% for AGIs $25k-50k, 4.0% for AGIs $50k-75k, 0.9% for AGIs $75k-100k, 9.2% for AGIs over 100k)
Total itemized deductions: $20,040 (22% of AGI, reported on 55.2% of returns)
Here:
$20,040
State:
$18,261
Here:
21.9% of AGI
State:
20.5% of AGI
(% of AGI for various income ranges: 22.7% for AGIs $25k-50k, 23.8% for AGIs $50k-75k, 18.5% for AGIs $75k-100k, 14.7% for AGIs over 100k)
Charity contributions deductions: $3,404 (4% of AGI, reported on 49.2% of returns)
Here:
$3,404
State:
$3,665
Here:
3.5% of AGI
State:
3.9% of AGI
(% of AGI for various income ranges: 1.7% for AGIs $25k-50k, 2.1% for AGIs $50k-75k, 2.4% for AGIs $75k-100k, 3.5% for AGIs over 100k)
Total tax: $8,513 (reported on 85.1% of returns)
64149:
$8,513
State:
$6,999
(% of AGI for various income ranges: 5.5% for AGIs $10k-25k, 7.8% for AGIs $25k-50k, 8.1% for AGIs $50k-75k, 9.2% for AGIs $75k-100k, 15.5% for AGIs over 100k)
Percentage of individuals using paid preparers for their 2004 taxes: 64.6%
Here:
65%
State:
62%
(% for various income ranges: 42.3% for AGIs below $10k, 68.2% for AGIs $10k-25k, 62.2% for AGIs $25k-50k, 78.6% for AGIs $50k-75k, 62.1% for AGIs $75k-100k, 74.2% for AGIs over 100k)
Household received Food Stamps/SNAP in the past 12 months: 44 Household did not receive Food Stamps/SNAP in the past 12 months: 94
Women who did not have a birth in the past 12 months: 49 (43 now married, 5 unmarried)
Housing units in zip code 64149 with a mortgage: 65 (28 second mortgage, 20 both second mortgage and home equity loan) Median monthly owner costs for units with a mortgage: $1,823 Median monthly owner costs for units without a mortgage: $1,366
Residents with income below the poverty level in 2022:
This zip code:
3.3%
Whole state:
13.2%
Residents with income below 50% of the poverty level in 2022:
This zip code:
3.3%
Whole state:
6.8%
Median number of rooms in houses and condos:
Here:
7.4
State:
6.4
Notable locations in this zip code not listed on our city pages
Facilities with environmental interests located in this zip code:
PATRICIA W FOWLER TRUST (10000 E 137TH ST in KANSAS CITY, MO)
STATE MASTER (Missouri monitoring and compilance) - RCRAINFO-MOP000503805, NOT IN A UNIVERSE (Resource Conservation and Recovery Act (tracking hazardous waste))
REORGANIZED SCHOOL DISTRI (HORRIDGE RD & HWY 150 in KANSAS CITY, MO)
National Pollutant Discharge Elimination System NON-MAJOR (Tracking pollutant discharge elimination systems) - permit Business SIC classification: HEAVY CONSTRUCTION Alternative names: LEE'S SUMMIT ELEMENTARY #
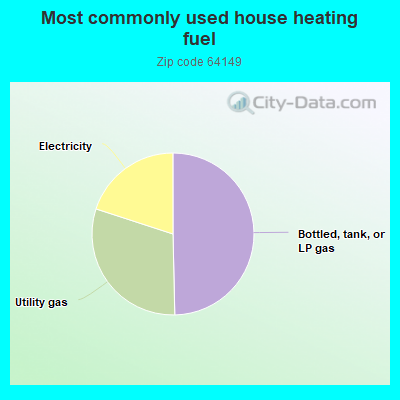
50.2%Bottled, tank, or LP gas
30.7%Utility gas
20.2%Electricity
Population in 1990: 314. Population change in the 1990s: +70 (+22.3%).
Place of birth for U.S.-born residents:
This state: 210
Midwest: 20
South: 17
West: 135
88% of the 64149 zip code residents lived in the same house 5 years ago. Out of people who lived in different houses, 55% lived in this county. Out of people who lived in different counties, 50% lived in Missouri.
96% of the 64149 zip code residents lived in the same house 1 year ago. Out of people who lived in different houses, 111% moved from different county within same state.
Private vs. public school enrollment:
Students in private schools in grades 1 to 8 (elementary and middle school):
Here:
0.0%
Missouri:
15.4%
Students in private schools in grades 9 to 12 (high school):
Here:
0.0%
Missouri:
13.9%
Top industries in this zip code by the number of employees in 2005:
Construction: Plumbing, Heating, and Air-Conditioning Contractors (20-49 employees: 1 establishment)
Construction: Poured Concrete Foundation and Structure Contractors (10-19: 1, 5-9: 1, 1-4: 1)
Construction: Roofing Contractors (10-19: 1)
Construction: Glass and Glazing Contractors (5-9: 1)
Construction: Commercial and Institutional Building Construction (5-9: 1)
Administrative and Support and Waste Management and Remediation Services: Landscaping Services (1-4: 2)
Other Services (except Public Administration): Funeral Homes and Funeral Services (1-4: 2)
Real Estate and Rental and Leasing: Offices of Real Estate Appraisers (1-4: 1)
Educational Services: Professional and Management Development Training (1-4: 1)
Other Services (except Public Administration): Computer and Office Machine Repair and Maintenance (1-4: 1)
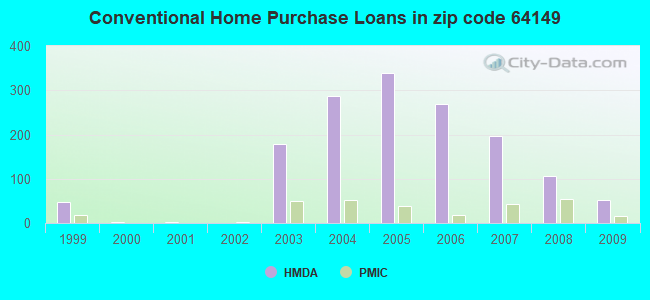
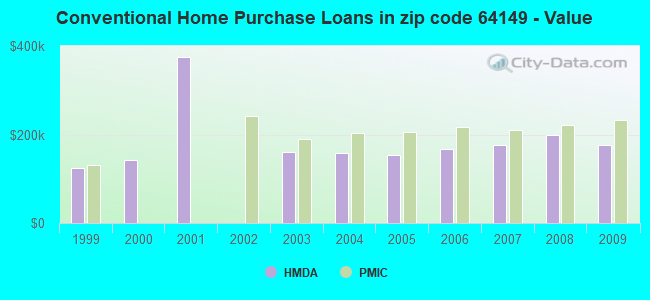
Home Mortgage Disclosure Act Aggregated Statistics For Year 2009 (Based on 2 full and 2 partial tracts)
A) FHA, FSA/RHS & VA Home Purchase Loans
B) Conventional Home Purchase Loans
C) Refinancings
D) Home Improvement Loans
F) Non-occupant Loans on < 5 Family Dwellings (A B C & D)
Number
Average Value
Number
Average Value
Number
Average Value
Number
Average Value
Number
Average Value
LOANS ORIGINATED
54
$203,803
52
$177,378
278
$188,158
4
$37,235
11
$226,694
APPLICATIONS APPROVED, NOT ACCEPTED
2
$241,020
4
$172,885
30
$185,924
1
$182,310
1
$123,600
APPLICATIONS DENIED
2
$197,450
6
$226,703
75
$210,323
6
$60,048
4
$183,082
APPLICATIONS WITHDRAWN
6
$168,097
4
$222,325
70
$217,486
2
$151,720
2
$240,400
FILES CLOSED FOR INCOMPLETENESS
1
$147,080
1
$66,130
9
$200,438
1
$30,900
0
$0
Aggregated Statistics For Year 2008 (Based on 2 full and 2 partial tracts)
A) FHA, FSA/RHS & VA Home Purchase Loans
B) Conventional Home Purchase Loans
C) Refinancings
D) Home Improvement Loans
F) Non-occupant Loans on < 5 Family Dwellings (A B C & D)
G) Loans On Manufactured Home Dwelling (A B C & D)
Number
Average Value
Number
Average Value
Number
Average Value
Number
Average Value
Number
Average Value
Number
Average Value
LOANS ORIGINATED
33
$203,940
106
$199,202
127
$206,239
3
$15,450
14
$226,585
1
$16,690
APPLICATIONS APPROVED, NOT ACCEPTED
1
$117,420
7
$209,590
14
$202,792
1
$26,570
0
$0
0
$0
APPLICATIONS DENIED
3
$200,850
13
$232,796
65
$236,599
9
$129,024
2
$187,255
0
$0
APPLICATIONS WITHDRAWN
3
$221,037
12
$205,897
43
$206,369
2
$146,465
1
$276,860
0
$0
FILES CLOSED FOR INCOMPLETENESS
1
$247,200
1
$185,400
11
$201,345
1
$52,530
0
$0
0
$0
Aggregated Statistics For Year 2007 (Based on 2 full and 2 partial tracts)
A) FHA, FSA/RHS & VA Home Purchase Loans
B) Conventional Home Purchase Loans
C) Refinancings
D) Home Improvement Loans
F) Non-occupant Loans on < 5 Family Dwellings (A B C & D)
G) Loans On Manufactured Home Dwelling (A B C & D)
Number
Average Value
Number
Average Value
Number
Average Value
Number
Average Value
Number
Average Value
Number
Average Value
LOANS ORIGINATED
10
$183,793
197
$175,744
137
$181,667
22
$48,429
18
$220,901
0
$0
APPLICATIONS APPROVED, NOT ACCEPTED
2
$206,410
41
$199,427
32
$171,437
4
$53,920
6
$192,918
0
$0
APPLICATIONS DENIED
4
$160,062
40
$254,894
109
$210,273
14
$82,326
11
$233,773
1
$16,690
APPLICATIONS WITHDRAWN
1
$220,010
25
$177,934
44
$207,220
7
$85,549
4
$333,410
0
$0
FILES CLOSED FOR INCOMPLETENESS
0
$0
4
$213,365
16
$216,764
1
$46,350
1
$74,160
0
$0
Aggregated Statistics For Year 2006 (Based on 2 full and 2 partial tracts)
A) FHA, FSA/RHS & VA Home Purchase Loans
B) Conventional Home Purchase Loans
C) Refinancings
D) Home Improvement Loans
E) Loans on Dwellings For 5+ Families
F) Non-occupant Loans on < 5 Family Dwellings (A B C & D)
G) Loans On Manufactured Home Dwelling (A B C & D)
Number
Average Value
Number
Average Value
Number
Average Value
Number
Average Value
Number
Average Value
Number
Average Value
Number
Average Value
LOANS ORIGINATED
13
$192,483
268
$167,547
150
$156,973
21
$79,516
1
$14,215,850
18
$163,793
0
$0
APPLICATIONS APPROVED, NOT ACCEPTED
1
$80,960
25
$187,204
37
$224,818
6
$38,522
0
$0
4
$184,010
1
$23,480
APPLICATIONS DENIED
2
$81,265
62
$233,581
101
$251,306
10
$45,176
0
$0
8
$217,098
1
$56,240
APPLICATIONS WITHDRAWN
2
$118,040
27
$148,297
74
$189,551
4
$89,920
0
$0
6
$171,702
0
$0
FILES CLOSED FOR INCOMPLETENESS
0
$0
10
$250,228
14
$171,671
2
$104,750
0
$0
0
$0
0
$0
Aggregated Statistics For Year 2005 (Based on 2 full and 2 partial tracts)
A) FHA, FSA/RHS & VA Home Purchase Loans
B) Conventional Home Purchase Loans
C) Refinancings
D) Home Improvement Loans
F) Non-occupant Loans on < 5 Family Dwellings (A B C & D)
G) Loans On Manufactured Home Dwelling (A B C & D)
Number
Average Value
Number
Average Value
Number
Average Value
Number
Average Value
Number
Average Value
Number
Average Value
LOANS ORIGINATED
15
$158,949
339
$154,207
185
$164,475
11
$43,541
19
$118,818
1
$121,130
APPLICATIONS APPROVED, NOT ACCEPTED
1
$114,950
40
$158,788
33
$153,227
3
$75,190
4
$107,378
0
$0
APPLICATIONS DENIED
2
$178,295
48
$145,075
89
$180,947
11
$90,509
9
$117,077
0
$0
APPLICATIONS WITHDRAWN
2
$150,175
38
$167,738
59
$162,445
4
$149,402
6
$172,113
0
$0
FILES CLOSED FOR INCOMPLETENESS
0
$0
11
$141,746
13
$160,775
1
$35,840
1
$55,620
0
$0
Aggregated Statistics For Year 2004 (Based on 2 full and 2 partial tracts)
A) FHA, FSA/RHS & VA Home Purchase Loans
B) Conventional Home Purchase Loans
C) Refinancings
D) Home Improvement Loans
E) Loans on Dwellings For 5+ Families
F) Non-occupant Loans on < 5 Family Dwellings (A B C & D)
G) Loans On Manufactured Home Dwelling (A B C & D)
Number
Average Value
Number
Average Value
Number
Average Value
Number
Average Value
Number
Average Value
Number
Average Value
Number
Average Value
LOANS ORIGINATED
11
$177,310
286
$157,488
207
$159,148
17
$64,786
1
$228,660
19
$158,241
0
$0
APPLICATIONS APPROVED, NOT ACCEPTED
2
$189,415
29
$146,125
27
$147,977
3
$53,147
0
$0
2
$164,390
1
$74,160
APPLICATIONS DENIED
2
$156,355
30
$142,840
66
$163,536
9
$67,568
0
$0
6
$120,202
0
$0
APPLICATIONS WITHDRAWN
1
$211,360
27
$194,967
65
$177,626
3
$71,483
0
$0
4
$133,332
0
$0
FILES CLOSED FOR INCOMPLETENESS
1
$101,350
9
$174,482
15
$161,545
1
$30,900
0
$0
1
$134,720
0
$0
Aggregated Statistics For Year 2003 (Based on 2 full and 2 partial tracts)
A) FHA, FSA/RHS & VA Home Purchase Loans
B) Conventional Home Purchase Loans
C) Refinancings
D) Home Improvement Loans
F) Non-occupant Loans on < 5 Family Dwellings (A B C & D)
Number
Average Value
Number
Average Value
Number
Average Value
Number
Average Value
Number
Average Value
LOANS ORIGINATED
15
$163,811
179
$159,340
397
$145,307
7
$23,131
14
$134,326
APPLICATIONS APPROVED, NOT ACCEPTED
1
$98,880
12
$154,552
34
$189,290
2
$33,370
2
$142,760
APPLICATIONS DENIED
2
$148,010
23
$239,435
80
$166,942
3
$20,600
3
$118,243
APPLICATIONS WITHDRAWN
0
$0
18
$149,076
53
$153,549
1
$14,210
1
$103,210
FILES CLOSED FOR INCOMPLETENESS
1
$207,030
3
$153,883
19
$261,896
1
$37,080
1
$278,100
Aggregated Statistics For Year 2002 (Based on 2 full tracts)
C) Refinancings
Number
Average Value
LOANS ORIGINATED
16
$226,926
APPLICATIONS APPROVED, NOT ACCEPTED
0
$0
APPLICATIONS DENIED
2
$380,315
APPLICATIONS WITHDRAWN
2
$277,310
FILES CLOSED FOR INCOMPLETENESS
6
$169,688
Aggregated Statistics For Year 2001 (Based on 2 full tracts)
B) Conventional Home Purchase Loans
Number
Average Value
LOANS ORIGINATED
2
$375,360
APPLICATIONS APPROVED, NOT ACCEPTED
0
$0
APPLICATIONS DENIED
0
$0
APPLICATIONS WITHDRAWN
0
$0
FILES CLOSED FOR INCOMPLETENESS
0
$0
Aggregated Statistics For Year 2000 (Based on 2 full tracts)
B) Conventional Home Purchase Loans
C) Refinancings
D) Home Improvement Loans
Number
Average Value
Number
Average Value
Number
Average Value
LOANS ORIGINATED
2
$141,625
0
$0
2
$41,595
APPLICATIONS APPROVED, NOT ACCEPTED
0
$0
0
$0
0
$0
APPLICATIONS DENIED
0
$0
0
$0
0
$0
APPLICATIONS WITHDRAWN
0
$0
2
$297,120
0
$0
FILES CLOSED FOR INCOMPLETENESS
0
$0
0
$0
0
$0
Aggregated Statistics For Year 1999 (Based on 1 full and 1 partial tracts)
A) FHA, FSA/RHS & VA Home Purchase Loans
B) Conventional Home Purchase Loans
C) Refinancings
D) Home Improvement Loans
F) Non-occupant Loans on < 5 Family Dwellings (A B C & D)


 Nearest zip codes: 64030, 64082, 64134, 64083, 64081, 64147.