Estimated zip code population in 2022: 7,912 Zip code population in 2010: 7,366 Zip code population in 2000: 7,328
Houses and condos: 2,733 Renter-occupied apartments: 956
% of renters here:
38%
State:
31%
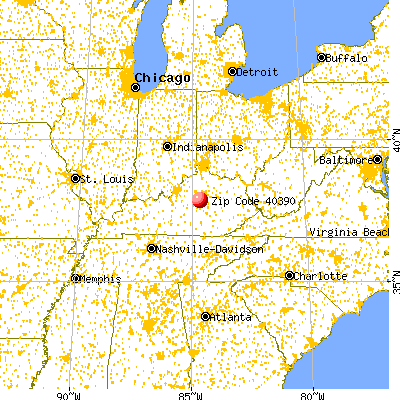
March 2022 cost of living index in zip code 40390: 88.8 (less than average, U.S. average is 100)
Land area: 25.4 sq. mi. Water area: 0.7 sq. mi.
Population density: 312 people per square mile
(very low).
OSM Map
General Map
Google Map
MSN Map
OSM Map
General Map
Google Map
MSN Map
OSM Map
General Map
Google Map
MSN Map
OSM Map
General Map
Google Map
MSN Map
Please wait while loading the map...
Real estate property taxes paid for housing units in 2022:
This zip code:
0.7% ($1,793)
Kentucky:
0.7% ($1,456)
Median real estate property taxes paid for housing units with mortgages in 2022: $1,841 (0.7%) Median real estate property taxes paid for housing units with no mortgage in 2022: $1,646 (0.8%)
Estimated median house/condo value in 2022: $243,989
40390:
$243,989
Kentucky:
$196,300
According to our research of Kentucky and other state lists, there were 4 registered sex offenders living in 40390 zip code as of June 01, 2024. The ratio of all residents to sex offenders in zip code 40390 is 1,888 to 1. The ratio of registered sex offenders to all residents in this zip code is much lower than the state average.
Median resident age:
This zip code:
29.5 years
Kentucky median age:
39.4 years
Average household size:
This zip code:
2.7 people
Kentucky:
2.4 people
Averages for the 2020 tax year for zip code 40390, filed in 2021:
Average Adjusted Gross Income (AGI) in 2020: $59,843 (Individual Income Tax Returns)
Here:
$59,843
State:
$61,342
Salary/wage: $45,885 (reported on 80.6% of returns)
Here:
$45,885
State:
$50,827
(% of AGI for various income ranges: 1127.1% for AGIs below $25k, 3682.5% for AGIs $25k-50k, 6701.9% for AGIs $50k-75k, 10810.0% for AGIs $75k-100k, 18190.0% for AGIs $100k-200k, 64835.0% for AGIs over 200k)
Taxable interest for individuals: $1,244 (reported on 31.1% of returns)
This zip code:
$1,244
Kentucky:
$1,441
(% of AGI for various income ranges: 19.9% for AGIs below $25k, 22.2% for AGIs $25k-50k, 57.4% for AGIs $50k-75k, 57.1% for AGIs $75k-100k, 156.2% for AGIs $100k-200k, 1765.0% for AGIs over 200k)
Ordinary dividends: $5,660 (reported on 19.7% of returns)
Here:
$5,660
State:
$7,388
(% of AGI for various income ranges: 31.8% for AGIs below $25k, 22.5% for AGIs $25k-50k, 111.1% for AGIs $50k-75k, 197.6% for AGIs $75k-100k, 627.5% for AGIs $100k-200k, 6165.0% for AGIs over 200k)
Net capital gain/loss in AGI: +$12,417 (reported on 18.3% of returns)
Here:
+$12,417
State:
+$19,475
(% of AGI for various income ranges: 12.9% for AGIs below $25k, 44.7% for AGIs $25k-50k, 228.5% for AGIs $50k-75k, 338.8% for AGIs $75k-100k, 1051.2% for AGIs $100k-200k, 16835.0% for AGIs over 200k)
Profit/loss from business: +$9,025 (reported on 20.4% of returns)
Here:
+$9,025
State:
+$11,386
(% of AGI for various income ranges: 145.1% for AGIs below $25k, 162.7% for AGIs $25k-50k, 474.8% for AGIs $50k-75k, 344.1% for AGIs $75k-100k, 499.4% for AGIs $100k-200k, 3595.0% for AGIs over 200k)
Taxable individual retirement arrangement distribution: $17,477 (reported on 10.4% of returns)
40390:
$17,477
Kentucky:
$18,941
(% of AGI for various income ranges: 43.3% for AGIs below $25k, 118.0% for AGIs $25k-50k, 250.0% for AGIs $50k-75k, 398.2% for AGIs $75k-100k, 1831.2% for AGIs $100k-200k)
Total itemized deductions: $39,711 (reported on 9.3% of returns)
Here:
$39,711
State:
$32,473
(% of AGI for various income ranges: 88.2% for AGIs below $25k, 186.2% for AGIs $25k-50k, 390.7% for AGIs $50k-75k, 508.2% for AGIs $75k-100k, 2402.5% for AGIs $100k-200k, 16500.0% for AGIs over 200k)
Charity contributions: $18,279 (reported on 8.3% of returns)
Here:
$18,279
State:
$13,472
(% of AGI for various income ranges: 33.9% for AGIs below $25k, 165.6% for AGIs $50k-75k, 162.9% for AGIs $75k-100k, 942.5% for AGIs $100k-200k, 9555.0% for AGIs over 200k)
Taxes paid: $6,333 (reported on 9.3% of returns)
40390:
$6,333
State:
$7,830
(% of AGI for various income ranges: 23.3% for AGIs $25k-50k, 46.3% for AGIs $50k-75k, 120.6% for AGIs $75k-100k, 515.0% for AGIs $100k-200k, 2140.0% for AGIs over 200k)
Earned income credit: $2,252 (reported on 16.6% of returns)
Here:
$2,252
State:
$2,336
(% of AGI for various income ranges: 89.3% for AGIs below $25k, 79.6% for AGIs $25k-50k)
Percentage of individuals using paid preparers for their 2020 taxes: 92.7%
Here:
93%
State:
94%
(% for various income ranges: 92.1% for AGIs below $25k, 93.1% for AGIs $25k-50k, 93.0% for AGIs $50k-75k, 96.7% for AGIs $75k-100k, 91.4% for AGIs $100k-200k, 87.5% for AGIs over 200k)
Averages for the 2012 tax year for zip code 40390, filed in 2013:
Average Adjusted Gross Income (AGI) in 2012: $43,254 (Individual Income Tax Returns)
Here:
$43,254
State:
$50,814
Salary/wage: $36,896 (reported on 83.7% of returns)
Here:
$36,896
State:
$42,723
(% of AGI for various income ranges: 75.5% for AGIs below $25k, 78.4% for AGIs $25k-50k, 76.9% for AGIs $50k-75k, 71.9% for AGIs $75k-100k, 69.6% for AGIs $100k-200k, 41.8% for AGIs over 200k)
Taxable interest for individuals: $889 (reported on 35.7% of returns)
This zip code:
$889
Kentucky:
$1,381
(% of AGI for various income ranges: 1.0% for AGIs below $25k, 0.8% for AGIs $25k-50k, 0.8% for AGIs $50k-75k, 0.6% for AGIs $75k-100k, 0.7% for AGIs $100k-200k, 0.5% for AGIs over 200k)
Ordinary dividends: $3,971 (reported on 17.1% of returns)
Here:
$3,971
State:
$6,239
(% of AGI for various income ranges: 1.8% for AGIs below $25k, 0.6% for AGIs $25k-50k, 1.0% for AGIs $50k-75k, 1.2% for AGIs $75k-100k, 3.9% for AGIs $100k-200k)
Net capital gain/loss in AGI: +$3,289 (reported on 13.7% of returns)
Here:
+$3,289
State:
+$11,336
(% of AGI for various income ranges: 0.1% for AGIs below $25k, 0.2% for AGIs $25k-50k, 0.8% for AGIs $50k-75k, 1.0% for AGIs $75k-100k, 3.0% for AGIs $100k-200k)
Profit/loss from business: +$6,358 (reported on 20.9% of returns)
Here:
+$6,358
State:
+$10,862
(% of AGI for various income ranges: 9.7% for AGIs below $25k, 2.7% for AGIs $25k-50k, 2.1% for AGIs $50k-75k, 1.9% for AGIs $75k-100k, 3.0% for AGIs $100k-200k)
Taxable individual retirement arrangement distribution: $13,900 (reported on 8.7% of returns)
40390:
$13,900
Kentucky:
$14,296
(% of AGI for various income ranges: 2.8% for AGIs below $25k, 2.2% for AGIs $25k-50k, 1.4% for AGIs $50k-75k, 3.8% for AGIs $75k-100k, 5.1% for AGIs $100k-200k)
Total itemized deductions: $20,899 (26% of AGI, reported on 31.9% of returns)
Here:
$20,899
State:
$21,160
Here:
26.3% of AGI
State:
20.0% of AGI
(% of AGI for various income ranges: 9.0% for AGIs below $25k, 12.1% for AGIs $25k-50k, 16.0% for AGIs $50k-75k, 18.1% for AGIs $75k-100k, 18.8% for AGIs $100k-200k, 17.3% for AGIs over 200k)
Charity contributions: $6,405 (reported on 27.8% of returns)
Here:
$6,405
State:
$4,303
(% of AGI for various income ranges: 1.5% for AGIs below $25k, 2.8% for AGIs $25k-50k, 3.8% for AGIs $50k-75k, 4.5% for AGIs $75k-100k, 5.9% for AGIs $100k-200k, 6.0% for AGIs over 200k)
Taxes paid: $6,902 (reported on 31.2% of returns)
40390:
$6,902
State:
$8,496
(% of AGI for various income ranges: 1.1% for AGIs below $25k, 2.6% for AGIs $25k-50k, 4.7% for AGIs $50k-75k, 6.3% for AGIs $75k-100k, 6.9% for AGIs $100k-200k, 8.8% for AGIs over 200k)
Earned income credit: $2,154 (reported on 20.5% of returns)
Here:
$2,154
State:
$2,273
(% of AGI for various income ranges: 6.5% for AGIs below $25k, 1.3% for AGIs $25k-50k)
Percentage of individuals using paid preparers for their 2012 taxes: 53.2%
Here:
53%
State:
60%
(% for various income ranges: 48.3% for AGIs below $25k, 54.5% for AGIs $25k-50k, 56.8% for AGIs $50k-75k, 61.9% for AGIs $75k-100k, 60.0% for AGIs $100k-200k, 66.7% for AGIs over 200k)
Averages for the 2004 tax year for zip code 40390, filed in 2005:
Average Adjusted Gross Income (AGI) in 2004: $35,467 (Individual Income Tax Returns)
Here:
$35,467
State:
$41,540
Salary/wage: $32,106 (reported on 84.8% of returns)
Here:
$32,106
State:
$36,432
(% of AGI for various income ranges: 116.2% for AGIs below $10k, 77.1% for AGIs $10k-25k, 78.6% for AGIs $25k-50k, 85.6% for AGIs $50k-75k, 82.0% for AGIs $75k-100k, 55.0% for AGIs over 100k)
Taxable interest for individuals: $1,360 (reported on 46.4% of returns)
This zip code:
$1,360
Kentucky:
$1,571
(% of AGI for various income ranges: 4.0% for AGIs below $10k, 2.5% for AGIs $10k-25k, 1.4% for AGIs $25k-50k, 1.0% for AGIs $50k-75k, 0.7% for AGIs $75k-100k, 3.2% for AGIs over 100k)
Taxable dividends: $2,128 (reported on 20.2% of returns)
Here:
$2,128
State:
$3,453
(% of AGI for various income ranges: 2.8% for AGIs below $10k, 1.2% for AGIs $10k-25k, 0.8% for AGIs $25k-50k, 0.8% for AGIs $50k-75k, 0.9% for AGIs $75k-100k, 2.3% for AGIs over 100k)
Net capital gain/loss: +$7,930 (reported on 15.2% of returns)
Here:
+$7,930
State:
+$9,663
(% of AGI for various income ranges: -0.8% for AGIs below $10k, 0.9% for AGIs $10k-25k, 1.0% for AGIs $25k-50k, 1.3% for AGIs $50k-75k, 0.2% for AGIs $75k-100k, 13.3% for AGIs over 100k)
Profit/loss from business: +$4,797 (reported on 20.2% of returns)
Here:
+$4,797
State:
+$9,233
(% of AGI for various income ranges: 9.3% for AGIs below $10k, 5.0% for AGIs $10k-25k, 3.5% for AGIs $25k-50k, 1.6% for AGIs $50k-75k, 1.5% for AGIs $75k-100k, 1.7% for AGIs over 100k)
IRA payment deduction: $2,625 (reported on 1.3% of returns)
40390:
$2,625
Kentucky:
$2,955
Total itemized deductions: $17,848 (29% of AGI, reported on 36.1% of returns)
Here:
$17,848
State:
$17,474
Here:
28.5% of AGI
State:
21.0% of AGI
(% of AGI for various income ranges: 12.9% for AGIs below $10k, 13.9% for AGIs $10k-25k, 15.1% for AGIs $25k-50k, 20.4% for AGIs $50k-75k, 20.8% for AGIs $75k-100k, 21.0% for AGIs over 100k)
Charity contributions deductions: $5,635 (9% of AGI, reported on 31.9% of returns)
Here:
$5,635
State:
$3,494
Here:
8.6% of AGI
State:
4.0% of AGI
(% of AGI for various income ranges: 1.4% for AGIs below $10k, 2.7% for AGIs $10k-25k, 3.7% for AGIs $25k-50k, 5.0% for AGIs $50k-75k, 5.5% for AGIs $75k-100k, 8.5% for AGIs over 100k)
Total tax: $4,033 (reported on 70.5% of returns)
40390:
$4,033
State:
$6,162
(% of AGI for various income ranges: 3.0% for AGIs below $10k, 4.2% for AGIs $10k-25k, 5.7% for AGIs $25k-50k, 7.3% for AGIs $50k-75k, 9.3% for AGIs $75k-100k, 14.0% for AGIs over 100k)
Earned income credit: $1,613 (reported on 16.7% of returns)
Here:
$1,613
State:
$1,723
Percentage of individuals using paid preparers for their 2004 taxes: 52.5%
Here:
53%
State:
66%
(% for various income ranges: 43.4% for AGIs below $10k, 55.8% for AGIs $10k-25k, 54.5% for AGIs $25k-50k, 54.8% for AGIs $50k-75k, 52.6% for AGIs $75k-100k, 65.5% for AGIs over 100k)
Household received Food Stamps/SNAP in the past 12 months: 308 Household did not receive Food Stamps/SNAP in the past 12 months: 2,184
Women who had a birth in the past 12 months: 79 (68 now married, 9 unmarried) Women who did not have a birth in the past 12 months: 2,468 (829 now married, 1,633 unmarried)
Housing units in zip code 40390 with a mortgage: 854 (113 second mortgage, 114 both second mortgage and home equity loan) Median monthly owner costs for units with a mortgage: $1,303 Median monthly owner costs for units without a mortgage: $399
Residents with income below the poverty level in 2022:
This zip code:
13.8%
Whole state:
16.5%
Residents with income below 50% of the poverty level in 2022:
This zip code:
5.6%
Whole state:
9.0%
Median number of rooms in houses and condos:
Here:
6.5
State:
6.4
Median number of rooms in apartments:
Here:
4.3
State:
4.4
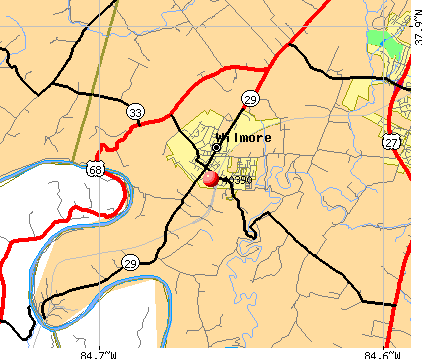
Notable locations in this zip code not listed on our city pages
Notable locations in zip code 40390: High Bridge Fire Department (A), New Jessamine County Fire Station (B), Wilmore City Fire Department (C). Display/hide their locations on the map
In group quarters: 1,170 (-1 institutionalized population)
Size of family households: 728 2-persons, 587 3-persons, 148 4-persons, 183 5-persons, 26 6-persons, 5 7-or-more-persons
Size of nonfamily households: 596 1-person, 84 2-persons, 118 3-persons
830 married couples with children.
340 single-parent households (170 men, 170 women).
92.9% of residents of 40390 zip code speak English at home.
1.2% of residents speak Spanish at home (84% very well, 16% well).
2.8% of residents speak other Indo-European language at home (73% very well, 24% well, 3% not well).
2.7% of residents speak Asian or Pacific Island language at home (81% very well, 19% well).
0.1% of residents speak other language at home (100% very well).
Foreign born population: 570 (7.2%) (52.5% of them are naturalized citizens)
This zip code:
7.2%
Whole state:
4.0%
34%Zimbabwe
6%Poland
5%Iran
4%Bolivia
4%Chile
4%Romania
3%Sweden
30%American
17%English
8%German
3%European
2%Irish
2%Italian
2%Romanian
Year of entry for the foreign-born population
3122010 or later
2222000 to 2009
811990 to 1999
0Before 1990
Facilities with environmental interests located in this zip code:
ASBURY COLLEGE (1 MACKLEM DRIVE in WILMORE, KY)
COMPLIANCE ACTIVITY (Tracking inspections of insecticide, fungicide, and rodenticide, and toxic substances) Conditionally Exempt Small Quantity Generators, less than 100 kg/month of hazardous waste (Resource Conservation and Recovery Act (tracking hazardous waste)) - notification
(Resource Conservation and Recovery Act (tracking hazardous waste)) Organizations: ASHLAND BRANDED MARKETING INC. (CONTACT/OWNER)
BETHEL POINT (312 WALTERS LN in WILMORE, KY)
National Pollutant Discharge Elimination System NON-MAJOR (Tracking pollutant discharge elimination systems) - permit Business SIC classification: MANAGEMENT SERVICES
CITY OF WILMORE (335 E. MAIN STREET in WILMORE, KY)
(Resource Conservation and Recovery Act (tracking hazardous waste))
L & S FOODS (404 N LEXINGTON AVE in WILMORE, KY)
(Resource Conservation and Recovery Act (tracking hazardous waste)) Organizations: SAM RILEY (CONTACT/OWNER)
Housing units lacking complete plumbing facilities: 0.2% Housing units lacking complete kitchen facilities: 0.2%
66.8%Electricity
29.7%Utility gas
2.0%Bottled, tank, or LP gas
1.5%Other fuel
Population in 1990: 5,600. Population change in the 1990s: +1,728 (+30.9%).
Place of birth for U.S.-born residents:
This state: 4,114
Northeast: 371
Midwest: 1,182
South: 1,309
West: 373
35% of the 40390 zip code residents lived in the same house 5 years ago. Out of people who lived in different houses, 24% lived in this county. Out of people who lived in different counties, 50% lived in Kentucky.
91% of the 40390 zip code residents lived in the same house 1 year ago. Out of people who lived in different houses, 53% moved from this county. Out of people who lived in different houses, 20% moved from different county within same state. Out of people who lived in different houses, 24% moved from different state. Out of people who lived in different houses, 3% moved from abroad.
Private vs. public school enrollment:
Students in private schools in grades 1 to 8 (elementary and middle school): 49
Here:
9.3%
Kentucky:
17.2%
Students in private schools in grades 9 to 12 (high school):
Here:
0.0%
Kentucky:
15.2%
Students in private undergraduate colleges: 816
Here:
66.1%
Kentucky:
19.6%
Occupation by median earnings in the past 12 months ($)
71,847Architecture and engineering occupations
67,811Computer and mathematical occupations
66,074Arts, design, entertainment, sports, and media occupations
57,161Education, training, and library occupations
56,142Health diagnosing and treating practitioners and other technical occupations
45,721Material moving occupations
Companies with federal contracts located in this zip code:
ASBURY THEOLOGICAL SEMINARY (204 N LEXINGTON AVE in WILMORE, KY) : $10,750 in 4 contractsfrom 2003 to 2004
$4,639 with Navy for Tuition, Registration, and Membership Fees. Signed on 2003-12-17. Completion date: 2004-05-31.
$4,220, same as above.Signed on 2003-08-30. Completion date: 2003-12-31.
$1,472, same as above.Signed on 2004-04-29. Completion date: 2004-05-31.
$419, same as above.Signed on 2003-11-10. Completion date: 2003-12-31.
KENTUCKY ASA SOFTBALL (575 PEKIN PIKE in WILMORE, KY; small business) : $410 in 2 contractsin 2005
$210 with Bureau of Prisoners/Federal Prison System for Recreational Services. Signed on 2005-02-16. Completion date: 2005-02-28.
$200 with Bureau of Prisoners/Federal Prison System for . Signed on 2005-07-28. Completion date: 2005-08-31.
Top industries in this zip code by the number of employees in 2005:
Educational Services: Colleges, Universities, and Professional Schools (500-999 employees: 1 establishment, 250-499 employees: 1 establishment)
Other Services (except Public Administration): Religious Organizations (20-49: 3, 10-19: 2, 5-9: 3, 1-4: 6)
Accommodation and Food Services: Food Service Contractors (50-99: 1, 5-9: 1)
Health Care and Social Assistance: Continuing Care Retirement Communities (50-99: 1)
Health Care and Social Assistance: Child Day Care Services (20-49: 1, 5-9: 1)
Information: Data Processing, Hosting, and Related Services (20-49: 1)
Accommodation and Food Services: Full-Service Restaurants (10-19: 2)
People in group quarters in 2010:
1,109 people in college/university student housing
305 people in nursing facilities/skilled-nursing facilities
People in group quarters in 2000:
1,190 people in college dormitories (includes college quarters off campus)
303 people in nursing homes
18 people in agriculture workers' dormitories on farms
Fatal accident statistics in 2012:
Fatal accident count: 1
Vehicles involved in fatal accidents: 1
Fatal accidents caused by drunken drivers: 1
Fatalities: 1
Persons involved in fatal accidents: 3
Pedestrians involved in fatal accidents: 0
Home Mortgage Disclosure Act Aggregated Statistics For Year 2009 (Based on 2 partial tracts)
A) FHA, FSA/RHS & VA Home Purchase Loans
B) Conventional Home Purchase Loans
C) Refinancings
D) Home Improvement Loans
E) Loans on Dwellings For 5+ Families
F) Non-occupant Loans on < 5 Family Dwellings (A B C & D)
Number
Average Value
Number
Average Value
Number
Average Value
Number
Average Value
Number
Average Value
Number
Average Value
LOANS ORIGINATED
33
$143,675
92
$141,534
235
$158,914
15
$35,109
5
$196,472
42
$112,924
APPLICATIONS APPROVED, NOT ACCEPTED
3
$70,420
5
$159,048
12
$135,432
3
$70,420
0
$0
0
$0
APPLICATIONS DENIED
2
$15,845
17
$128,442
80
$191,549
2
$1,510
0
$0
2
$67,150
APPLICATIONS WITHDRAWN
2
$76,960
3
$100,097
48
$155,207
0
$0
0
$0
0
$0
FILES CLOSED FOR INCOMPLETENESS
3
$79,977
2
$150,900
20
$156,257
0
$0
0
$0
0
$0
Aggregated Statistics For Year 2008 (Based on 2 partial tracts)
A) FHA, FSA/RHS & VA Home Purchase Loans
B) Conventional Home Purchase Loans
C) Refinancings
D) Home Improvement Loans
F) Non-occupant Loans on < 5 Family Dwellings (A B C & D)
Number
Average Value
Number
Average Value
Number
Average Value
Number
Average Value
Number
Average Value
LOANS ORIGINATED
30
$152,308
78
$138,228
89
$178,282
14
$30,180
18
$156,433
APPLICATIONS APPROVED, NOT ACCEPTED
2
$175,045
3
$170,013
18
$117,953
6
$15,342
0
$0
APPLICATIONS DENIED
6
$155,175
11
$217,159
62
$149,367
11
$108,236
3
$128,767
APPLICATIONS WITHDRAWN
2
$88,275
5
$102,612
32
$149,344
3
$117,703
5
$54,928
FILES CLOSED FOR INCOMPLETENESS
0
$0
0
$0
9
$160,792
0
$0
0
$0
Aggregated Statistics For Year 2007 (Based on 2 partial tracts)
A) FHA, FSA/RHS & VA Home Purchase Loans
B) Conventional Home Purchase Loans
C) Refinancings
D) Home Improvement Loans
F) Non-occupant Loans on < 5 Family Dwellings (A B C & D)
G) Loans On Manufactured Home Dwelling (A B C & D)
Number
Average Value
Number
Average Value
Number
Average Value
Number
Average Value
Number
Average Value
Number
Average Value
LOANS ORIGINATED
24
$145,178
184
$122,180
101
$127,070
18
$35,629
45
$105,462
2
$21,880
APPLICATIONS APPROVED, NOT ACCEPTED
0
$0
8
$95,632
30
$138,627
2
$30,180
0
$0
0
$0
APPLICATIONS DENIED
6
$134,553
20
$127,963
86
$132,353
17
$49,176
6
$75,450
2
$18,865
APPLICATIONS WITHDRAWN
0
$0
18
$196,924
26
$146,895
2
$37,725
2
$60,360
2
$60,360
FILES CLOSED FOR INCOMPLETENESS
0
$0
6
$108,900
14
$147,559
0
$0
0
$0
0
$0
Aggregated Statistics For Year 2006 (Based on 2 partial tracts)
A) FHA, FSA/RHS & VA Home Purchase Loans
B) Conventional Home Purchase Loans
C) Refinancings
D) Home Improvement Loans
F) Non-occupant Loans on < 5 Family Dwellings (A B C & D)
G) Loans On Manufactured Home Dwelling (A B C & D)
Number
Average Value
Number
Average Value
Number
Average Value
Number
Average Value
Number
Average Value
Number
Average Value
LOANS ORIGINATED
17
$120,720
189
$110,069
148
$139,858
30
$31,337
48
$165,141
8
$85,259
APPLICATIONS APPROVED, NOT ACCEPTED
2
$137,320
21
$147,307
18
$99,426
2
$21,880
0
$0
0
$0
APPLICATIONS DENIED
3
$94,060
33
$103,984
106
$125,404
15
$28,771
15
$62,171
3
$38,730
APPLICATIONS WITHDRAWN
2
$91,295
21
$96,432
77
$142,630
6
$27,162
2
$15,845
3
$73,940
FILES CLOSED FOR INCOMPLETENESS
0
$0
6
$105,630
14
$104,984
0
$0
0
$0
0
$0
Aggregated Statistics For Year 2005 (Based on 2 partial tracts)
A) FHA, FSA/RHS & VA Home Purchase Loans
B) Conventional Home Purchase Loans
C) Refinancings
D) Home Improvement Loans
F) Non-occupant Loans on < 5 Family Dwellings (A B C & D)
G) Loans On Manufactured Home Dwelling (A B C & D)
Number
Average Value
Number
Average Value
Number
Average Value
Number
Average Value
Number
Average Value
Number
Average Value
LOANS ORIGINATED
17
$109,536
169
$97,826
133
$116,431
26
$31,747
18
$118,037
6
$54,827
APPLICATIONS APPROVED, NOT ACCEPTED
2
$85,260
36
$114,852
26
$57,748
2
$21,125
8
$37,725
2
$58,850
APPLICATIONS DENIED
2
$94,315
23
$110,682
109
$114,573
20
$41,875
6
$57,593
3
$57,847
APPLICATIONS WITHDRAWN
3
$126,757
30
$100,600
63
$130,109
14
$138,074
14
$77,714
0
$0
FILES CLOSED FOR INCOMPLETENESS
0
$0
5
$88,730
15
$153,315
0
$0
0
$0
0
$0
Aggregated Statistics For Year 2004 (Based on 2 partial tracts)
A) FHA, FSA/RHS & VA Home Purchase Loans
B) Conventional Home Purchase Loans
C) Refinancings
D) Home Improvement Loans
E) Loans on Dwellings For 5+ Families
F) Non-occupant Loans on < 5 Family Dwellings (A B C & D)
G) Loans On Manufactured Home Dwelling (A B C & D)
Number
Average Value
Number
Average Value
Number
Average Value
Number
Average Value
Number
Average Value
Number
Average Value
Number
Average Value
LOANS ORIGINATED
21
$113,965
121
$115,707
178
$111,869
15
$69,917
2
$448,930
32
$97,943
6
$69,413
APPLICATIONS APPROVED, NOT ACCEPTED
2
$89,785
14
$82,241
33
$99,914
2
$11,320
0
$0
2
$60,360
3
$54,827
APPLICATIONS DENIED
3
$93,557
21
$79,546
94
$110,847
15
$30,180
0
$0
5
$116,796
8
$58,662
APPLICATIONS WITHDRAWN
2
$104,875
11
$171,203
86
$109,139
2
$37,725
0
$0
3
$120,720
2
$72,430
FILES CLOSED FOR INCOMPLETENESS
2
$70,925
8
$102,046
15
$103,920
5
$28,672
0
$0
0
$0
0
$0
Aggregated Statistics For Year 2002 (Based on 2 partial tracts)
A) FHA, FSA/RHS & VA Home Purchase Loans
B) Conventional Home Purchase Loans
C) Refinancings
D) Home Improvement Loans
F) Non-occupant Loans on < 5 Family Dwellings (A B C & D)
Number
Average Value
Number
Average Value
Number
Average Value
Number
Average Value
Number
Average Value
LOANS ORIGINATED
23
$103,006
110
$104,478
267
$110,236
12
$23,012
27
$100,935
APPLICATIONS APPROVED, NOT ACCEPTED
3
$91,043
15
$98,890
45
$95,771
2
$13,580
3
$60,863
APPLICATIONS DENIED
2
$105,630
23
$85,947
100
$85,274
6
$31,187
3
$60,360
APPLICATIONS WITHDRAWN
0
$0
9
$110,828
42
$112,636
6
$10,312
5
$64,284
FILES CLOSED FOR INCOMPLETENESS
0
$0
6
$78,468
11
$77,371
0
$0
5
$68,206
Aggregated Statistics For Year 2001 (Based on 2 partial tracts)
A) FHA, FSA/RHS & VA Home Purchase Loans
B) Conventional Home Purchase Loans
C) Refinancings
D) Home Improvement Loans
E) Loans on Dwellings For 5+ Families
F) Non-occupant Loans on < 5 Family Dwellings (A B C & D)
Number
Average Value
Number
Average Value
Number
Average Value
Number
Average Value
Number
Average Value
Number
Average Value
LOANS ORIGINATED
26
$105,514
131
$98,569
241
$101,873
18
$24,731
3
$43,257
38
$85,814
APPLICATIONS APPROVED, NOT ACCEPTED
0
$0
11
$75,175
35
$98,732
8
$19,806
0
$0
0
$0
APPLICATIONS DENIED
0
$0
23
$84,242
97
$95,005
15
$24,747
0
$0
5
$60,360
APPLICATIONS WITHDRAWN
2
$52,815
5
$82,996
44
$83,167
9
$37,892
0
$0
2
$30,935
FILES CLOSED FOR INCOMPLETENESS
2
$92,805
5
$55,532
12
$96,953
0
$0
0
$0
0
$0
Aggregated Statistics For Year 2000 (Based on 2 partial tracts)
A) FHA, FSA/RHS & VA Home Purchase Loans
B) Conventional Home Purchase Loans
C) Refinancings
D) Home Improvement Loans
F) Non-occupant Loans on < 5 Family Dwellings (A B C & D)
Number
Average Value
Number
Average Value
Number
Average Value
Number
Average Value
Number
Average Value
LOANS ORIGINATED
24
$86,579
113
$97,057
128
$103,237
23
$15,483
11
$90,677
APPLICATIONS APPROVED, NOT ACCEPTED
6
$56,838
30
$69,615
27
$77,127
14
$15,090
0
$0
APPLICATIONS DENIED
12
$67,905
36
$61,534
74
$69,679
5
$8,450
8
$47,156
APPLICATIONS WITHDRAWN
8
$62,058
24
$127,636
45
$79,373
3
$38,730
5
$85,712
FILES CLOSED FOR INCOMPLETENESS
0
$0
3
$100,600
2
$69,415
3
$26,157
0
$0
Aggregated Statistics For Year 1999 (Based on 1 partial tract)
A) FHA, FSA/RHS & VA Home Purchase Loans
B) Conventional Home Purchase Loans
C) Refinancings
D) Home Improvement Loans
E) Loans on Dwellings For 5+ Families
F) Non-occupant Loans on < 5 Family Dwellings (A B C & D)
Detailed PMIC statistics for the following Tracts:0604.00
2004 - 2018 National Fire Incident Reporting System (NFIRS) incidents
Based on the data from the years 2004 - 2018 the average number of fires per year is 12. The highest number of reported fire incidents - 25 took place in 2011, and the least - 0 in 2007. The data has a growing trend.
When looking into fire subcategories, the most incidents belonged to: Outside Fires (43.5%), and Structure Fires (42.9%).
Fire incident types reported to NFIRS in Zip Code 40390


 Nearest zip codes: 40339, 40356, 40310, 40514, 40383, 40513.


 Based on the data from the years 2004 - 2018 the average number of fires per year is 12. The highest number of reported fire incidents - 25 took place in 2011, and the least - 0 in 2007. The data has a growing trend.
 When looking into fire subcategories, the most incidents belonged to: Outside Fires (43.5%), and Structure Fires (42.9%).