Estimated zip code population in 2022: 9,455 Zip code population in 2010: 6,312 Zip code population in 2000: 4,191
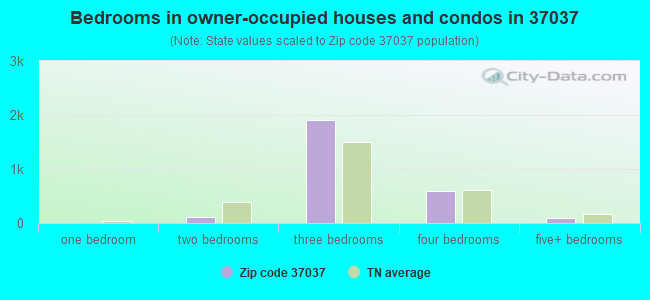
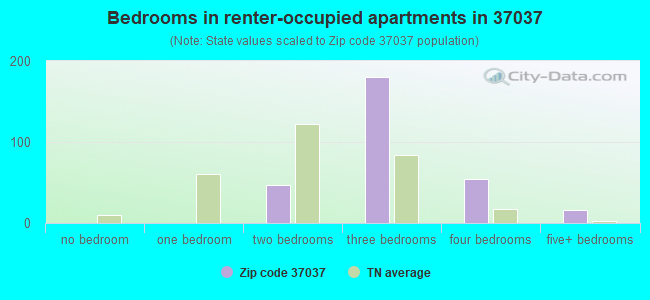
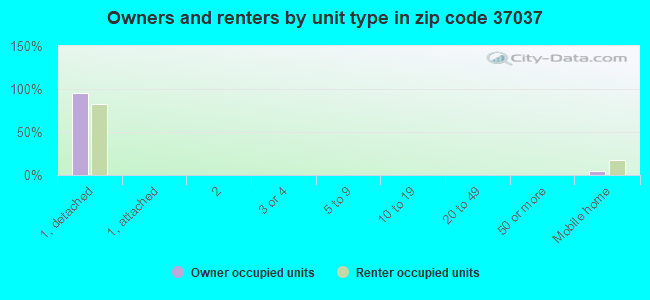
Houses and condos: 3,409 Renter-occupied apartments: 302
% of renters here:
10%
State:
33%
March 2022 cost of living index in zip code 37037: 83.4 (less than average, U.S. average is 100)
Land area: 74.1 sq. mi. Water area: 0.0 sq. mi.
Population density: 128 people per square mile
(very low).
OSM Map
General Map
Google Map
MSN Map
OSM Map
General Map
Google Map
MSN Map
OSM Map
General Map
Google Map
MSN Map
OSM Map
General Map
Google Map
MSN Map
Please wait while loading the map...
Real estate property taxes paid for housing units in 2022:
This zip code:
0.4% ($1,534)
Tennessee:
0.5% ($1,376)
Median real estate property taxes paid for housing units with mortgages in 2022: $1,569 (0.4%) Median real estate property taxes paid for housing units with no mortgage in 2022: $1,349 (0.4%)
Business Search- 14 Million verified businesses
Males: 5,056
(53.5%)
Females: 4,398
(46.5%)
For population 25 years and over in 37037:
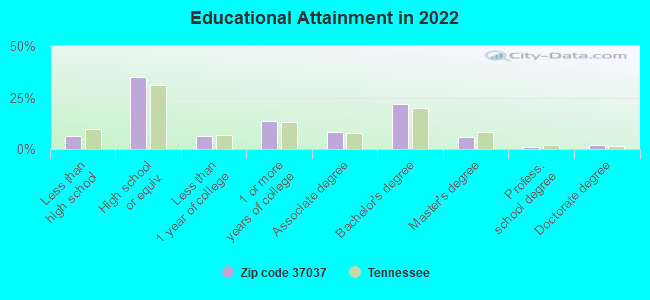
High school or higher: 94.1%
Bachelor's degree or higher: 30.7%
Graduate or professional degree: 8.6%
Unemployed: 1.8%
Mean travel time to work (commute): 28.7 minutes
For population 15 years and over in 37037:
Never married: 25.5%
Now married: 63.6%
Separated: 0.9%
Widowed: 4.2%
Divorced: 5.8%
Zip code 37037 compared to state average:
Median household income above state average.
Unemployed percentage below state average.
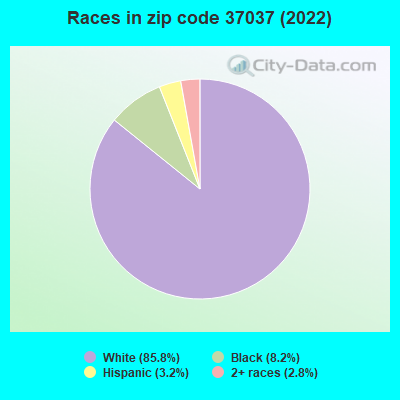
Black race population percentage below state average.
Hispanic race population percentage below state average.
Foreign-born population percentage significantly below state average.
Renting percentage significantly below state average.
Length of stay since moving in above state average.
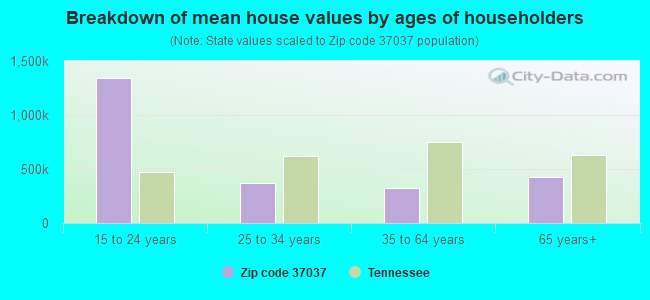
Estimated median house/condo value in 2022: $400,757
37037:
$400,757
Tennessee:
$284,800
According to our research of Tennessee and other state lists, there were 14 registered sex offenders living in 37037 zip code as of June 07, 2024. The ratio of all residents to sex offenders in zip code 37037 is 530 to 1. The ratio of registered sex offenders to all residents in this zip code is lower than the state average.
Median resident age:
This zip code:
36.8 years
Tennessee median age:
39.2 years
Average household size:
This zip code:
3.1 people
Tennessee:
2.4 people
Averages for the 2020 tax year for zip code 37037, filed in 2021:
Average Adjusted Gross Income (AGI) in 2020: $72,022 (Individual Income Tax Returns)
Here:
$72,022
State:
$69,014
Salary/wage: $62,953 (reported on 87.6% of returns)
Here:
$62,953
State:
$55,872
(% of AGI for various income ranges: 1158.6% for AGIs below $25k, 3698.9% for AGIs $25k-50k, 6790.8% for AGIs $50k-75k, 9663.3% for AGIs $75k-100k, 17205.9% for AGIs $100k-200k, 57728.3% for AGIs over 200k)
Taxable interest for individuals: $762 (reported on 24.7% of returns)
This zip code:
$762
Tennessee:
$1,945
(% of AGI for various income ranges: 14.8% for AGIs below $25k, 16.5% for AGIs $25k-50k, 18.0% for AGIs $50k-75k, 15.6% for AGIs $75k-100k, 45.3% for AGIs $100k-200k, 276.7% for AGIs over 200k)
Ordinary dividends: $2,980 (reported on 11.3% of returns)
Here:
$2,980
State:
$8,105
(% of AGI for various income ranges: 8.6% for AGIs below $25k, 15.1% for AGIs $25k-50k, 28.3% for AGIs $50k-75k, 48.1% for AGIs $75k-100k, 60.2% for AGIs $100k-200k, 1018.3% for AGIs over 200k)
Net capital gain/loss in AGI: +$24,050 (reported on 10.9% of returns)
Here:
+$24,050
State:
+$33,664
(% of AGI for various income ranges: 9.9% for AGIs below $25k, 14.5% for AGIs $25k-50k, 40.5% for AGIs $50k-75k, 61.4% for AGIs $75k-100k, 205.1% for AGIs $100k-200k, 16356.7% for AGIs over 200k)
Profit/loss from business: +$24,091 (reported on 18.3% of returns)
Here:
+$24,091
State:
+$18,991
(% of AGI for various income ranges: 111.6% for AGIs below $25k, 172.8% for AGIs $25k-50k, 450.3% for AGIs $50k-75k, 512.3% for AGIs $75k-100k, 869.2% for AGIs $100k-200k, 13028.3% for AGIs over 200k)
Taxable individual retirement arrangement distribution: $21,844 (reported on 5.7% of returns)
37037:
$21,844
Tennessee:
$20,036
(% of AGI for various income ranges: 26.3% for AGIs below $25k, 66.2% for AGIs $25k-50k, 87.8% for AGIs $50k-75k, 151.2% for AGIs $75k-100k, 331.4% for AGIs $100k-200k, 3110.0% for AGIs over 200k)
Total itemized deductions: $31,600 (reported on 5.9% of returns)
Here:
$31,600
State:
$40,136
(% of AGI for various income ranges: 126.6% for AGIs $25k-50k, 224.5% for AGIs $50k-75k, 163.3% for AGIs $75k-100k, 438.0% for AGIs $100k-200k, 4863.3% for AGIs over 200k)
Charity contributions: $10,655 (reported on 4.5% of returns)
Here:
$10,655
State:
$19,852
(% of AGI for various income ranges: 9.5% for AGIs below $25k, 38.4% for AGIs $50k-75k, 29.5% for AGIs $75k-100k, 141.0% for AGIs $100k-200k, 1640.0% for AGIs over 200k)
Taxes paid: $5,029 (reported on 5.4% of returns)
37037:
$5,029
State:
$6,038
(% of AGI for various income ranges: 9.4% for AGIs $25k-50k, 28.4% for AGIs $50k-75k, 25.6% for AGIs $75k-100k, 74.7% for AGIs $100k-200k, 790.0% for AGIs over 200k)
Earned income credit: $2,127 (reported on 11.8% of returns)
Here:
$2,127
State:
$2,391
(% of AGI for various income ranges: 72.5% for AGIs below $25k, 59.4% for AGIs $25k-50k)
Percentage of individuals using paid preparers for their 2020 taxes: 95.5%
Here:
95%
State:
93%
(% for various income ranges: 93.8% for AGIs below $25k, 95.8% for AGIs $25k-50k, 96.5% for AGIs $50k-75k, 96.4% for AGIs $75k-100k, 96.1% for AGIs $100k-200k, 93.8% for AGIs over 200k)
Averages for the 2012 tax year for zip code 37037, filed in 2013:
Average Adjusted Gross Income (AGI) in 2012: $51,379 (Individual Income Tax Returns)
Here:
$51,379
State:
$53,767
Salary/wage: $48,061 (reported on 88.7% of returns)
Here:
$48,061
State:
$45,421
(% of AGI for various income ranges: 80.8% for AGIs below $25k, 87.8% for AGIs $25k-50k, 87.0% for AGIs $50k-75k, 86.7% for AGIs $75k-100k, 80.7% for AGIs $100k-200k, 65.2% for AGIs over 200k)
Taxable interest for individuals: $748 (reported on 25.7% of returns)
This zip code:
$748
Tennessee:
$1,732
(% of AGI for various income ranges: 1.0% for AGIs below $25k, 0.2% for AGIs $25k-50k, 0.3% for AGIs $50k-75k, 0.2% for AGIs $75k-100k, 0.6% for AGIs $100k-200k, 0.2% for AGIs over 200k)
Ordinary dividends: $2,103 (reported on 10.3% of returns)
Here:
$2,103
State:
$6,739
(% of AGI for various income ranges: 0.7% for AGIs below $25k, 0.3% for AGIs $50k-75k, 0.4% for AGIs $75k-100k, 1.0% for AGIs $100k-200k)
Net capital gain/loss in AGI: +$2,478 (reported on 7.7% of returns)
Here:
+$2,478
State:
+$19,082
(% of AGI for various income ranges: 0.2% for AGIs below $25k, 0.2% for AGIs $50k-75k, 0.1% for AGIs $75k-100k, 1.2% for AGIs $100k-200k, 0.4% for AGIs over 200k)
Profit/loss from business: +$12,810 (reported on 16.7% of returns)
Here:
+$12,810
State:
+$15,240
(% of AGI for various income ranges: 8.1% for AGIs below $25k, 4.8% for AGIs $25k-50k, 2.9% for AGIs $50k-75k, 3.0% for AGIs $75k-100k, 6.4% for AGIs $100k-200k)
Taxable individual retirement arrangement distribution: $14,011 (reported on 6.3% of returns)
37037:
$14,011
Tennessee:
$15,505
(% of AGI for various income ranges: 1.6% for AGIs below $25k, 1.0% for AGIs $25k-50k, 1.2% for AGIs $50k-75k, 1.9% for AGIs $75k-100k, 3.7% for AGIs $100k-200k)
Total itemized deductions: $17,134 (21% of AGI, reported on 27.7% of returns)
Here:
$17,134
State:
$21,976
Here:
21.1% of AGI
State:
17.8% of AGI
(% of AGI for various income ranges: 7.6% for AGIs below $25k, 9.3% for AGIs $25k-50k, 9.1% for AGIs $50k-75k, 9.8% for AGIs $75k-100k, 10.8% for AGIs $100k-200k, 6.5% for AGIs over 200k)
Charity contributions: $4,048 (reported on 20.0% of returns)
Here:
$4,048
State:
$6,709
(% of AGI for various income ranges: 0.5% for AGIs below $25k, 1.0% for AGIs $25k-50k, 1.2% for AGIs $50k-75k, 1.7% for AGIs $75k-100k, 2.3% for AGIs $100k-200k, 2.4% for AGIs over 200k)
Taxes paid: $3,623 (reported on 26.3% of returns)
37037:
$3,623
State:
$4,829
(% of AGI for various income ranges: 1.0% for AGIs below $25k, 1.5% for AGIs $25k-50k, 1.7% for AGIs $50k-75k, 2.1% for AGIs $75k-100k, 2.4% for AGIs $100k-200k, 1.8% for AGIs over 200k)
Earned income credit: $2,127 (reported on 18.7% of returns)
Here:
$2,127
State:
$2,404
(% of AGI for various income ranges: 6.8% for AGIs below $25k, 1.2% for AGIs $25k-50k)
Percentage of individuals using paid preparers for their 2012 taxes: 49.0%
Here:
49%
State:
52%
(% for various income ranges: 48.0% for AGIs below $25k, 48.1% for AGIs $25k-50k, 50.0% for AGIs $50k-75k, 48.5% for AGIs $75k-100k, 48.1% for AGIs $100k-200k, 80.0% for AGIs over 200k)
Averages for the 2004 tax year for zip code 37037, filed in 2005:
Average Adjusted Gross Income (AGI) in 2004: $43,238 (Individual Income Tax Returns)
Here:
$43,238
State:
$44,088
Salary/wage: $40,707 (reported on 89.1% of returns)
Here:
$40,707
State:
$38,825
(% of AGI for various income ranges: 140.5% for AGIs below $10k, 80.5% for AGIs $10k-25k, 89.3% for AGIs $25k-50k, 90.5% for AGIs $50k-75k, 91.9% for AGIs $75k-100k, 63.3% for AGIs over 100k)
Taxable interest for individuals: $1,100 (reported on 33.9% of returns)
This zip code:
$1,100
Tennessee:
$1,802
(% of AGI for various income ranges: 8.6% for AGIs below $10k, 1.3% for AGIs $10k-25k, 0.8% for AGIs $25k-50k, 0.8% for AGIs $50k-75k, 0.4% for AGIs $75k-100k, 0.8% for AGIs over 100k)
Taxable dividends: $859 (reported on 12.6% of returns)
Here:
$859
State:
$3,727
(% of AGI for various income ranges: 1.2% for AGIs below $10k, 0.2% for AGIs $10k-25k, 0.1% for AGIs $25k-50k, 0.1% for AGIs $50k-75k, 0.3% for AGIs $75k-100k, 0.5% for AGIs over 100k)
Net capital gain/loss: +$14,378 (reported on 10.5% of returns)
Here:
+$14,378
State:
+$15,776
(% of AGI for various income ranges: -3.2% for AGIs below $10k, 0.2% for AGIs $10k-25k, 0.0% for AGIs $25k-50k, 0.6% for AGIs $50k-75k, 0.4% for AGIs $75k-100k, 14.3% for AGIs over 100k)
Profit/loss from business: +$13,260 (reported on 18.3% of returns)
Here:
+$13,260
State:
+$12,882
(% of AGI for various income ranges: 13.5% for AGIs below $10k, 10.6% for AGIs $10k-25k, 4.2% for AGIs $25k-50k, 2.9% for AGIs $50k-75k, 4.4% for AGIs $75k-100k, 8.8% for AGIs over 100k)
IRA payment deduction: $2,441 (reported on 1.5% of returns)
37037:
$2,441
Tennessee:
$2,934
Total itemized deductions: $14,220 (21% of AGI, reported on 30.0% of returns)
Here:
$14,220
State:
$18,035
Here:
20.7% of AGI
State:
19.9% of AGI
(% of AGI for various income ranges: 10.4% for AGIs below $10k, 7.2% for AGIs $10k-25k, 9.4% for AGIs $25k-50k, 10.5% for AGIs $50k-75k, 12.6% for AGIs $75k-100k, 8.6% for AGIs over 100k)
Charity contributions deductions: $3,050 (4% of AGI, reported on 24.0% of returns)
Here:
$3,050
State:
$5,167
Here:
4.2% of AGI
State:
5.3% of AGI
(% of AGI for various income ranges: 0.9% for AGIs $10k-25k, 1.2% for AGIs $25k-50k, 1.5% for AGIs $50k-75k, 2.8% for AGIs $75k-100k, 2.0% for AGIs over 100k)
Total tax: $5,657 (reported on 78.9% of returns)
37037:
$5,657
State:
$7,482
(% of AGI for various income ranges: 7.0% for AGIs below $10k, 4.5% for AGIs $10k-25k, 7.0% for AGIs $25k-50k, 8.3% for AGIs $50k-75k, 10.2% for AGIs $75k-100k, 18.6% for AGIs over 100k)
Earned income credit: $1,679 (reported on 17.6% of returns)
Here:
$1,679
State:
$1,826
Percentage of individuals using paid preparers for their 2004 taxes: 60.0%
Here:
60%
State:
60%
(% for various income ranges: 51.5% for AGIs below $10k, 61.7% for AGIs $10k-25k, 61.5% for AGIs $25k-50k, 58.4% for AGIs $50k-75k, 61.7% for AGIs $75k-100k, 72.7% for AGIs over 100k)
Household received Food Stamps/SNAP in the past 12 months: 247 Household did not receive Food Stamps/SNAP in the past 12 months: 2,762
Women who had a birth in the past 12 months: 169 (111 now married, 57 unmarried) Women who did not have a birth in the past 12 months: 2,205 (1,325 now married, 880 unmarried)
Housing units in zip code 37037 with a mortgage: 2,157 (131 second mortgage, 133 both second mortgage and home equity loan) Houses without a mortgage: 25
Median monthly owner costs for units with a mortgage: $1,480 Median monthly owner costs for units without a mortgage: $535
Residents with income below the poverty level in 2022:
This zip code:
2.3%
Whole state:
13.3%
Residents with income below 50% of the poverty level in 2022:
This zip code:
0.8%
Whole state:
7.1%
Median number of rooms in houses and condos:
Here:
6.5
State:
6.5
Median number of rooms in apartments:
Here:
5.4
State:
4.4
Notable locations in this zip code not listed on our city pages
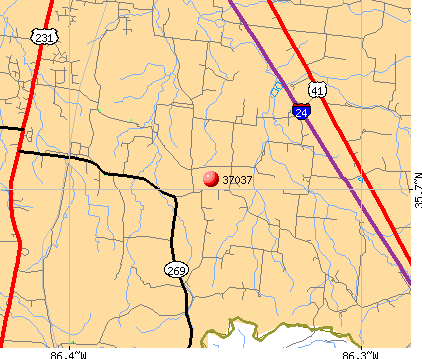
Notable locations in zip code 37037: Rock Springs (A), Hoovers Gap (B), Rockvale Volunteer Fire Department Station 2 (C), Christiana Volunteer Fire Department (D), Fosterville Midland Fire Department (E). Display/hide their locations on the map
Churches in zip code 37037 include: Big Creek Church (A), Donnel Chapel (B), Lebanon Church (C), Walnut Grove Church (D), Hatties Chapel Church (E), Beech Grove Church (F), Wayside Church (G), New Zion Church (H), New Hope Baptist Church (I). Display/hide their locations on the map
Cemeteries: Todd Cemetery (1), Kelton Cemetery (2), Wood-Adcock Cemetery (3), White Cemetery (4), Todd Cemetery (5), Taylor Cemetery (6), Sudberry Cemetery (7). Display/hide their locations on the map
Creeks: Big Springs Creek (A), Long Creek (B), Hurricane Creek (C), Henry Creek (D), Dry Fork Creek (E), Dry Creek (F), Short Creek (G). Display/hide their locations on the map
Size of family households: 1,113 2-persons, 359 3-persons, 713 4-persons, 139 5-persons, 187 6-persons, 168 7-or-more-persons
Size of nonfamily households: 271 1-person, 47 2-persons
1,773 married couples with children.
263 single-parent households (170 men, 93 women).
97.5% of residents of 37037 zip code speak English at home.
1.6% of residents speak Spanish at home (73% very well, 27% well).
0.4% of residents speak other Indo-European language at home (100% very well).
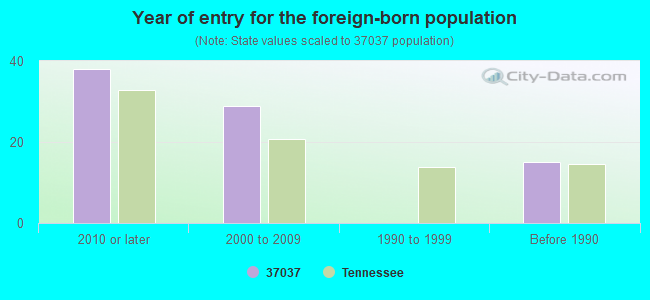
Foreign born population: 49 (0.5%) (68.4% of them are naturalized citizens)
This zip code:
0.5%
Whole state:
5.6%
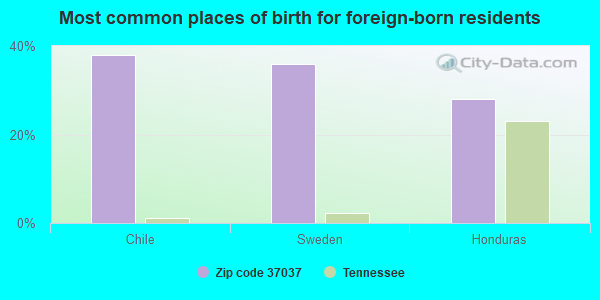
38%Chile
36%Sweden
28%Honduras
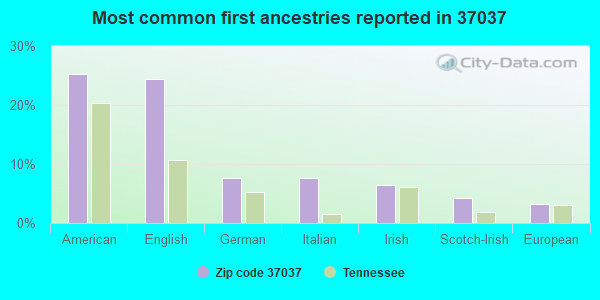
25%American
24%English
8%German
8%Italian
6%Irish
4%Scotch-Irish
3%European
Year of entry for the foreign-born population
382010 or later
292000 to 2009
01990 to 1999
15Before 1990
Facilities with environmental interests located in this zip code:
CHRISTIANA ELEMENTARY SCHOOL (4701 SHELBYVILLE HW in CHRISTIANA, TN)
(Geographic Names Information System) (National Center for Education Statistics) - STATE ID-0020 Organizations: RUTHERFORD COUNTY SCHOOL DIST (SCHOOL DISTRICT)
Housing units lacking complete plumbing facilities: 2.6% Housing units lacking complete kitchen facilities: 2.2%
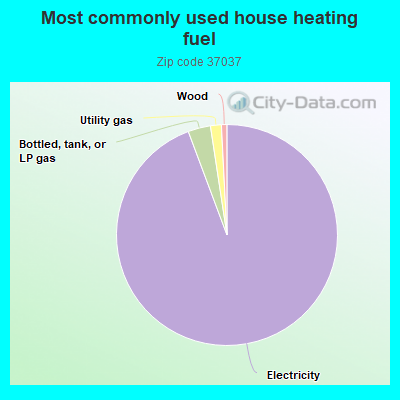
94.4%Electricity
3.3%Bottled, tank, or LP gas
1.6%Utility gas
0.8%Wood
Population in 1990: 3,173. Population change in the 1990s: +1,018 (+32.1%).
Place of birth for U.S.-born residents:
This state: 5,835
Northeast: 482
Midwest: 945
South: 1,558
West: 540
53% of the 37037 zip code residents lived in the same house 5 years ago. Out of people who lived in different houses, 67% lived in this county. Out of people who lived in different counties, 50% lived in Tennessee.
91% of the 37037 zip code residents lived in the same house 1 year ago. Out of people who lived in different houses, 45% moved from this county. Out of people who lived in different houses, 28% moved from different county within same state. Out of people who lived in different houses, 29% moved from different state.
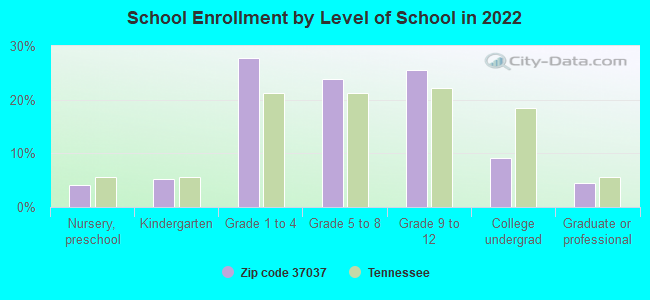
Private vs. public school enrollment:
Students in private schools in grades 1 to 8 (elementary and middle school): 263
Here:
21.5%
Tennessee:
15.0%
Students in private schools in grades 9 to 12 (high school): 185
Here:
30.6%
Tennessee:
16.2%
Students in private undergraduate colleges: 39
Here:
18.2%
Tennessee:
23.5%
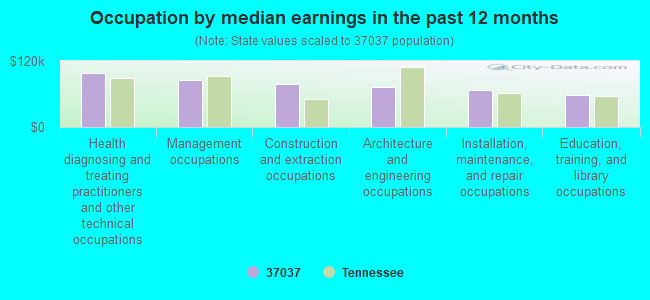
Occupation by median earnings in the past 12 months ($)
98,128Health diagnosing and treating practitioners and other technical occupations
85,787Management occupations
78,220Construction and extraction occupations
72,643Architecture and engineering occupations
67,190Installation, maintenance, and repair occupations
57,773Education, training, and library occupations
Top industries in this zip code by the number of employees in 2005:
Administrative and Support and Waste Management and Remediation Services: Professional Employer Organizations (250-499 employees: 1 establishment)
Construction: Water and Sewer Line and Related Structures Construction (50-99: 1)
Accommodation and Food Services: Limited-Service Restaurants (20-49: 1, 1-4: 1)
Accommodation and Food Services: Full-Service Restaurants (10-19: 1, 1-4: 1)
Construction: Site Preparation Contractors (5-9: 1, 1-4: 1)
Construction: Poured Concrete Foundation and Structure Contractors (5-9: 1, 1-4: 1)
Finance and Insurance: Direct Property and Casualty Insurance Carriers (5-9: 1)
Fatal accident statistics in 2014:
Fatal accident count: 4
Vehicles involved in fatal accidents: 6
Fatal accidents caused by drunken drivers: 2
Fatalities: 4
Persons involved in fatal accidents: 6
Pedestrians involved in fatal accidents: 0
Fatal accident statistics in 2013:
Fatal accident count: 1
Vehicles involved in fatal accidents: 2
Fatal accidents caused by drunken drivers: 0
Fatalities: 1
Persons involved in fatal accidents: 2
Pedestrians involved in fatal accidents: 0
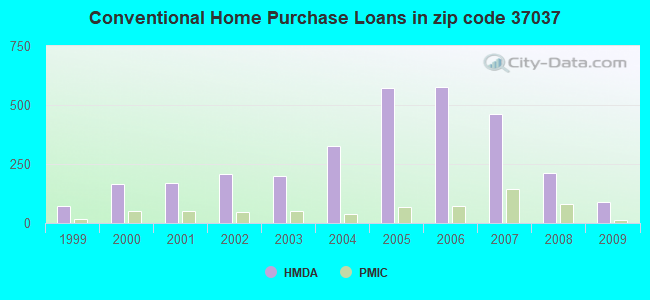
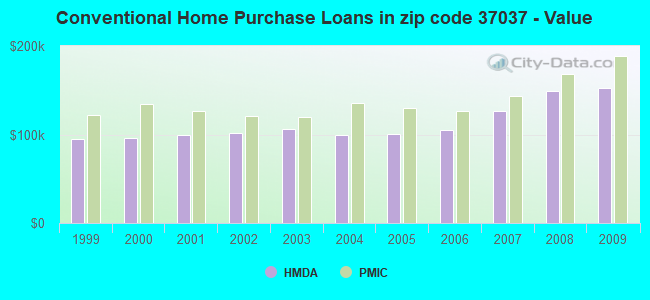
Home Mortgage Disclosure Act Aggregated Statistics For Year 2009 (Based on 4 partial tracts)
A) FHA, FSA/RHS & VA Home Purchase Loans
B) Conventional Home Purchase Loans
C) Refinancings
D) Home Improvement Loans
F) Non-occupant Loans on < 5 Family Dwellings (A B C & D)
G) Loans On Manufactured Home Dwelling (A B C & D)
Number
Average Value
Number
Average Value
Number
Average Value
Number
Average Value
Number
Average Value
Number
Average Value
LOANS ORIGINATED
249
$142,075
91
$152,570
508
$163,570
26
$49,592
36
$124,437
5
$64,060
APPLICATIONS APPROVED, NOT ACCEPTED
8
$135,006
6
$134,022
44
$172,973
7
$108,644
4
$145,455
2
$67,685
APPLICATIONS DENIED
20
$154,673
9
$192,147
171
$155,356
14
$51,355
4
$87,865
5
$90,206
APPLICATIONS WITHDRAWN
21
$147,341
21
$144,590
138
$156,940
4
$26,192
5
$76,090
4
$85,928
FILES CLOSED FOR INCOMPLETENESS
0
$0
2
$139,325
34
$159,384
3
$147,870
0
$0
0
$0
Aggregated Statistics For Year 2008 (Based on 4 partial tracts)
A) FHA, FSA/RHS & VA Home Purchase Loans
B) Conventional Home Purchase Loans
C) Refinancings
D) Home Improvement Loans
F) Non-occupant Loans on < 5 Family Dwellings (A B C & D)
G) Loans On Manufactured Home Dwelling (A B C & D)
Number
Average Value
Number
Average Value
Number
Average Value
Number
Average Value
Number
Average Value
Number
Average Value
LOANS ORIGINATED
171
$150,126
210
$149,258
337
$156,759
30
$45,086
56
$118,778
18
$78,458
APPLICATIONS APPROVED, NOT ACCEPTED
4
$133,368
14
$202,386
35
$160,829
12
$42,072
4
$205,908
1
$11,840
APPLICATIONS DENIED
12
$130,315
22
$141,957
244
$142,138
59
$58,550
11
$99,199
9
$108,781
APPLICATIONS WITHDRAWN
10
$130,044
31
$145,893
103
$145,124
6
$47,115
5
$85,474
2
$65,760
FILES CLOSED FOR INCOMPLETENESS
0
$0
2
$138,770
8
$149,250
0
$0
0
$0
0
$0
Aggregated Statistics For Year 2007 (Based on 4 partial tracts)
A) FHA, FSA/RHS & VA Home Purchase Loans
B) Conventional Home Purchase Loans
C) Refinancings
D) Home Improvement Loans
F) Non-occupant Loans on < 5 Family Dwellings (A B C & D)
G) Loans On Manufactured Home Dwelling (A B C & D)
Number
Average Value
Number
Average Value
Number
Average Value
Number
Average Value
Number
Average Value
Number
Average Value
LOANS ORIGINATED
140
$140,257
463
$126,373
286
$129,275
49
$40,350
82
$103,129
23
$91,822
APPLICATIONS APPROVED, NOT ACCEPTED
2
$128,180
30
$107,177
65
$126,911
15
$32,306
6
$89,915
8
$77,772
APPLICATIONS DENIED
6
$114,450
81
$118,514
245
$140,572
68
$53,119
18
$229,377
18
$77,953
APPLICATIONS WITHDRAWN
3
$125,493
64
$126,423
127
$136,642
9
$88,380
11
$98,925
2
$93,210
FILES CLOSED FOR INCOMPLETENESS
0
$0
8
$135,992
38
$151,512
3
$102,543
3
$130,037
0
$0
Aggregated Statistics For Year 2006 (Based on 4 partial tracts)
A) FHA, FSA/RHS & VA Home Purchase Loans
B) Conventional Home Purchase Loans
C) Refinancings
D) Home Improvement Loans
F) Non-occupant Loans on < 5 Family Dwellings (A B C & D)
G) Loans On Manufactured Home Dwelling (A B C & D)
Number
Average Value
Number
Average Value
Number
Average Value
Number
Average Value
Number
Average Value
Number
Average Value
LOANS ORIGINATED
161
$132,733
577
$104,748
327
$116,094
70
$38,307
103
$101,662
24
$89,672
APPLICATIONS APPROVED, NOT ACCEPTED
3
$138,880
54
$90,616
62
$117,752
12
$29,872
11
$77,175
5
$63,252
APPLICATIONS DENIED
8
$114,386
92
$114,783
259
$112,055
62
$40,967
23
$101,406
20
$76,301
APPLICATIONS WITHDRAWN
11
$145,561
53
$112,453
189
$129,591
9
$80,303
16
$121,144
3
$37,427
FILES CLOSED FOR INCOMPLETENESS
0
$0
13
$105,215
36
$129,495
0
$0
3
$72,077
0
$0
Aggregated Statistics For Year 2005 (Based on 4 partial tracts)
A) FHA, FSA/RHS & VA Home Purchase Loans
B) Conventional Home Purchase Loans
C) Refinancings
D) Home Improvement Loans
F) Non-occupant Loans on < 5 Family Dwellings (A B C & D)
G) Loans On Manufactured Home Dwelling (A B C & D)
Number
Average Value
Number
Average Value
Number
Average Value
Number
Average Value
Number
Average Value
Number
Average Value
LOANS ORIGINATED
228
$120,493
570
$101,120
307
$114,058
38
$39,598
60
$82,977
16
$79,347
APPLICATIONS APPROVED, NOT ACCEPTED
7
$119,580
49
$81,483
50
$93,804
2
$17,760
1
$125,400
7
$73,286
APPLICATIONS DENIED
16
$127,406
87
$89,357
263
$114,414
39
$33,061
7
$90,786
23
$65,632
APPLICATIONS WITHDRAWN
14
$105,390
52
$113,649
217
$115,604
16
$113,646
6
$91,583
9
$99,422
FILES CLOSED FOR INCOMPLETENESS
2
$153,815
11
$90,195
34
$113,611
1
$73,200
2
$70,220
2
$107,700
Aggregated Statistics For Year 2004 (Based on 4 partial tracts)
A) FHA, FSA/RHS & VA Home Purchase Loans
B) Conventional Home Purchase Loans
C) Refinancings
D) Home Improvement Loans
F) Non-occupant Loans on < 5 Family Dwellings (A B C & D)
G) Loans On Manufactured Home Dwelling (A B C & D)
Number
Average Value
Number
Average Value
Number
Average Value
Number
Average Value
Number
Average Value
Number
Average Value
LOANS ORIGINATED
161
$113,239
328
$99,762
338
$110,170
32
$50,124
39
$98,573
19
$79,928
APPLICATIONS APPROVED, NOT ACCEPTED
2
$110,905
29
$87,435
69
$109,308
5
$59,862
2
$69,160
10
$63,896
APPLICATIONS DENIED
20
$120,035
69
$80,816
247
$104,327
49
$40,743
11
$87,436
45
$65,002
APPLICATIONS WITHDRAWN
11
$104,367
39
$107,859
144
$115,703
5
$47,804
4
$75,098
4
$85,268
FILES CLOSED FOR INCOMPLETENESS
1
$167,190
17
$95,274
23
$127,453
2
$72,050
0
$0
0
$0
Aggregated Statistics For Year 2003 (Based on 4 partial tracts)
A) FHA, FSA/RHS & VA Home Purchase Loans
B) Conventional Home Purchase Loans
C) Refinancings
D) Home Improvement Loans
F) Non-occupant Loans on < 5 Family Dwellings (A B C & D)
Number
Average Value
Number
Average Value
Number
Average Value
Number
Average Value
Number
Average Value
LOANS ORIGINATED
191
$109,935
201
$105,923
588
$107,446
32
$16,039
33
$76,500
APPLICATIONS APPROVED, NOT ACCEPTED
1
$226,260
21
$93,572
105
$102,781
5
$28,496
2
$80,810
APPLICATIONS DENIED
23
$110,267
63
$74,640
223
$97,568
31
$26,767
6
$80,365
APPLICATIONS WITHDRAWN
14
$107,137
21
$134,775
163
$108,940
0
$0
2
$87,085
FILES CLOSED FOR INCOMPLETENESS
3
$104,773
12
$133,722
31
$106,541
0
$0
2
$124,835
Aggregated Statistics For Year 2002 (Based on 4 partial tracts)
A) FHA, FSA/RHS & VA Home Purchase Loans
B) Conventional Home Purchase Loans
C) Refinancings
D) Home Improvement Loans
F) Non-occupant Loans on < 5 Family Dwellings (A B C & D)
Number
Average Value
Number
Average Value
Number
Average Value
Number
Average Value
Number
Average Value
LOANS ORIGINATED
123
$105,167
206
$101,341
401
$102,781
28
$21,739
24
$95,613
APPLICATIONS APPROVED, NOT ACCEPTED
2
$83,040
28
$81,597
67
$98,639
19
$15,609
6
$99,682
APPLICATIONS DENIED
12
$105,656
63
$75,408
190
$102,396
24
$15,213
4
$565,660
APPLICATIONS WITHDRAWN
8
$102,719
23
$100,896
98
$104,101
3
$69,477
5
$64,818
FILES CLOSED FOR INCOMPLETENESS
0
$0
7
$90,614
18
$111,751
1
$32,290
0
$0
Aggregated Statistics For Year 2001 (Based on 4 partial tracts)
A) FHA, FSA/RHS & VA Home Purchase Loans
B) Conventional Home Purchase Loans
C) Refinancings
D) Home Improvement Loans
F) Non-occupant Loans on < 5 Family Dwellings (A B C & D)
Number
Average Value
Number
Average Value
Number
Average Value
Number
Average Value
Number
Average Value
LOANS ORIGINATED
131
$104,929
168
$99,460
373
$105,013
28
$13,459
43
$71,594
APPLICATIONS APPROVED, NOT ACCEPTED
1
$57,050
28
$75,909
44
$76,421
6
$16,572
1
$7,000
APPLICATIONS DENIED
14
$109,919
68
$59,856
172
$87,144
33
$11,892
2
$29,480
APPLICATIONS WITHDRAWN
6
$111,953
17
$98,727
116
$86,904
3
$10,723
2
$40,905
FILES CLOSED FOR INCOMPLETENESS
0
$0
13
$59,186
21
$83,414
0
$0
0
$0
Aggregated Statistics For Year 2000 (Based on 4 partial tracts)
A) FHA, FSA/RHS & VA Home Purchase Loans
B) Conventional Home Purchase Loans
C) Refinancings
D) Home Improvement Loans
F) Non-occupant Loans on < 5 Family Dwellings (A B C & D)
Number
Average Value
Number
Average Value
Number
Average Value
Number
Average Value
Number
Average Value
LOANS ORIGINATED
88
$105,825
164
$95,695
102
$92,488
36
$15,768
6
$81,865
APPLICATIONS APPROVED, NOT ACCEPTED
2
$105,330
28
$80,595
49
$78,963
16
$13,025
2
$181,610
APPLICATIONS DENIED
9
$92,048
85
$57,825
146
$72,593
46
$20,663
4
$93,075
APPLICATIONS WITHDRAWN
16
$99,289
14
$89,581
76
$76,688
5
$21,262
1
$239,640
FILES CLOSED FOR INCOMPLETENESS
1
$98,080
7
$87,894
24
$88,584
0
$0
1
$111,460
Aggregated Statistics For Year 1999 (Based on 2 partial tracts)
A) FHA, FSA/RHS & VA Home Purchase Loans
B) Conventional Home Purchase Loans
C) Refinancings
D) Home Improvement Loans
E) Loans on Dwellings For 5+ Families
F) Non-occupant Loans on < 5 Family Dwellings (A B C & D)
Detailed PMIC statistics for the following Tracts:0406.00
, 0407.00
2005 - 2018 National Fire Incident Reporting System (NFIRS) incidents
According to the data from the years 2005 - 2018 the average number of fire incidents per year is 39. The highest number of reported fires - 75 took place in 2012, and the least - 9 in 2005. The data has an increasing trend.
When looking into fire subcategories, the most reports belonged to: Outside Fires (47.1%), and Structure Fires (34.4%).
Fire incident types reported to NFIRS in Zip Code 37037

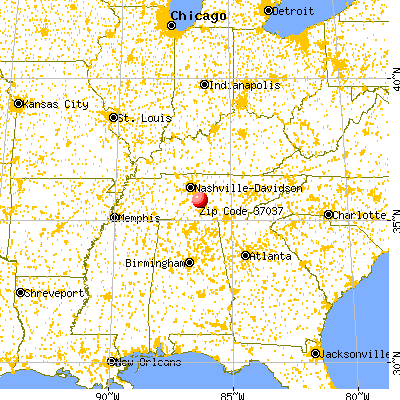


 Nearest zip codes: 37127, 37020, 37132, 37018, 37128, 37130.


 According to the data from the years 2005 - 2018 the average number of fire incidents per year is 39. The highest number of reported fires - 75 took place in 2012, and the least - 9 in 2005. The data has an increasing trend.
 When looking into fire subcategories, the most reports belonged to: Outside Fires (47.1%), and Structure Fires (34.4%).