Estimated zip code population in 2022: 3,695 Zip code population in 2010: 2,894 Zip code population in 2000: 2,672
Houses and condos: 1,671 Renter-occupied apartments: 247
% of renters here:
16%
State:
33%
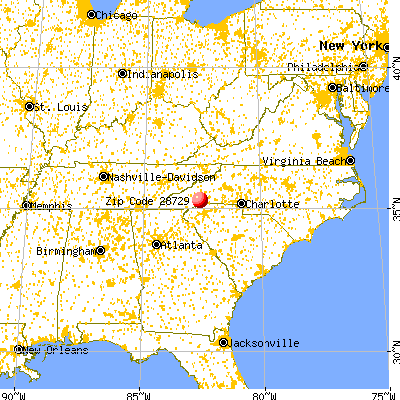
March 2022 cost of living index in zip code 28729: 92.5 (less than average, U.S. average is 100)
Land area: 4.4 sq. mi. Water area: 0.1 sq. mi.
Population density: 843 people per square mile
(low).
OSM Map
General Map
Google Map
MSN Map
OSM Map
General Map
Google Map
MSN Map
OSM Map
General Map
Google Map
MSN Map
OSM Map
General Map
Google Map
MSN Map
Please wait while loading the map...
Real estate property taxes paid for housing units in 2022:
This zip code:
0.5% ($1,826)
North Carolina:
0.6% ($1,769)
Median real estate property taxes paid for housing units with mortgages in 2022: $1,833 (0.5%) Median real estate property taxes paid for housing units with no mortgage in 2022: $1,838 (0.5%)
Estimated median house/condo value in 2022: $359,321
28729:
$359,321
North Carolina:
$280,600
According to our research of North Carolina and other state lists, there were 5 registered sex offenders living in 28729 zip code as of June 08, 2024. The ratio of all residents to sex offenders in zip code 28729 is 725 to 1. The ratio of registered sex offenders to all residents in this zip code is lower than the state average.
Median resident age:
This zip code:
47.0 years
North Carolina median age:
39.2 years
Average household size:
This zip code:
2.4 people
North Carolina:
2.4 people
Averages for the 2020 tax year for zip code 28729, filed in 2021:
Average Adjusted Gross Income (AGI) in 2020: $60,426 (Individual Income Tax Returns)
Here:
$60,426
State:
$70,020
Salary/wage: $51,039 (reported on 72.0% of returns)
Here:
$51,039
State:
$58,387
(% of AGI for various income ranges: 1172.2% for AGIs below $25k, 3381.5% for AGIs $25k-50k, 5531.9% for AGIs $50k-75k, 8418.0% for AGIs $75k-100k, 13656.0% for AGIs $100k-200k)
Taxable interest for individuals: $1,038 (reported on 39.2% of returns)
This zip code:
$1,038
North Carolina:
$1,479
(% of AGI for various income ranges: 31.9% for AGIs below $25k, 33.3% for AGIs $25k-50k, 81.9% for AGIs $50k-75k, 78.0% for AGIs $75k-100k, 117.3% for AGIs $100k-200k)
Ordinary dividends: $4,465 (reported on 22.8% of returns)
Here:
$4,465
State:
$7,888
(% of AGI for various income ranges: 58.9% for AGIs below $25k, 70.3% for AGIs $25k-50k, 105.7% for AGIs $50k-75k, 202.0% for AGIs $75k-100k, 378.7% for AGIs $100k-200k)
Net capital gain/loss in AGI: +$5,915 (reported on 21.2% of returns)
Here:
+$5,915
State:
+$23,652
(% of AGI for various income ranges: 8.9% for AGIs below $25k, 46.4% for AGIs $25k-50k, 101.0% for AGIs $50k-75k, 242.0% for AGIs $75k-100k, 576.0% for AGIs $100k-200k)
Profit/loss from business: +$11,190 (reported on 15.3% of returns)
Here:
+$11,190
State:
+$11,710
(% of AGI for various income ranges: 133.9% for AGIs below $25k, 280.6% for AGIs $25k-50k, 380.5% for AGIs $50k-75k, 128.7% for AGIs $75k-100k, 563.3% for AGIs $100k-200k)
Taxable individual retirement arrangement distribution: $17,376 (reported on 17.5% of returns)
28729:
$17,376
North Carolina:
$20,247
(% of AGI for various income ranges: 127.5% for AGIs below $25k, 226.7% for AGIs $25k-50k, 460.0% for AGIs $50k-75k, 846.7% for AGIs $75k-100k, 1527.3% for AGIs $100k-200k)
Total itemized deductions: $34,373 (reported on 5.8% of returns)
Here:
$34,373
State:
$34,549
(% of AGI for various income ranges: 120.8% for AGIs below $25k, 273.3% for AGIs $50k-75k, 424.7% for AGIs $75k-100k, 1423.3% for AGIs $100k-200k)
Charity contributions: $12,730 (reported on 5.3% of returns)
Here:
$12,730
State:
$13,360
(% of AGI for various income ranges: 141.4% for AGIs $50k-75k, 650.7% for AGIs $100k-200k)
Taxes paid: $6,855 (reported on 5.8% of returns)
28729:
$6,855
State:
$7,586
(% of AGI for various income ranges: 18.9% for AGIs below $25k, 52.4% for AGIs $50k-75k, 82.7% for AGIs $75k-100k, 301.3% for AGIs $100k-200k)
Earned income credit: $1,782 (reported on 11.6% of returns)
Here:
$1,782
State:
$2,337
(% of AGI for various income ranges: 65.0% for AGIs below $25k, 47.9% for AGIs $25k-50k)
Percentage of individuals using paid preparers for their 2020 taxes: 93.7%
Here:
94%
State:
93%
(% for various income ranges: 93.0% for AGIs below $25k, 93.6% for AGIs $25k-50k, 96.8% for AGIs $50k-75k, 91.7% for AGIs $75k-100k, 92.0% for AGIs $100k-200k, 100.0% for AGIs over 200k)
Averages for the 2012 tax year for zip code 28729, filed in 2013:
Average Adjusted Gross Income (AGI) in 2012: $45,680 (Individual Income Tax Returns)
Here:
$45,680
State:
$54,937
Salary/wage: $38,673 (reported on 68.2% of returns)
Here:
$38,673
State:
$46,336
(% of AGI for various income ranges: 56.0% for AGIs below $25k, 62.9% for AGIs $25k-50k, 62.0% for AGIs $50k-75k, 56.9% for AGIs $75k-100k, 73.0% for AGIs $100k-200k)
Taxable interest for individuals: $916 (reported on 45.7% of returns)
This zip code:
$916
North Carolina:
$1,298
(% of AGI for various income ranges: 2.2% for AGIs below $25k, 0.9% for AGIs $25k-50k, 0.9% for AGIs $50k-75k, 0.8% for AGIs $75k-100k, 0.7% for AGIs $100k-200k)
Ordinary dividends: $4,402 (reported on 24.3% of returns)
Here:
$4,402
State:
$6,213
(% of AGI for various income ranges: 3.8% for AGIs below $25k, 1.5% for AGIs $25k-50k, 1.5% for AGIs $50k-75k, 2.7% for AGIs $75k-100k, 4.0% for AGIs $100k-200k)
Net capital gain/loss in AGI: +$1,834 (reported on 18.5% of returns)
Here:
+$1,834
State:
+$12,740
(% of AGI for various income ranges: 0.5% for AGIs $75k-100k, 3.9% for AGIs $100k-200k)
Profit/loss from business: +$9,758 (reported on 17.9% of returns)
Here:
+$9,758
State:
+$10,311
(% of AGI for various income ranges: 9.6% for AGIs below $25k, 3.6% for AGIs $25k-50k, 2.3% for AGIs $50k-75k, 2.6% for AGIs $75k-100k, 5.4% for AGIs $100k-200k)
Taxable individual retirement arrangement distribution: $13,628 (reported on 18.5% of returns)
28729:
$13,628
North Carolina:
$15,575
(% of AGI for various income ranges: 6.5% for AGIs below $25k, 4.6% for AGIs $25k-50k, 4.8% for AGIs $50k-75k, 6.5% for AGIs $75k-100k, 8.1% for AGIs $100k-200k)
Total itemized deductions: $19,596 (25% of AGI, reported on 32.9% of returns)
Here:
$19,596
State:
$23,438
Here:
25.5% of AGI
State:
21.5% of AGI
(% of AGI for various income ranges: 13.1% for AGIs below $25k, 13.3% for AGIs $25k-50k, 13.8% for AGIs $50k-75k, 15.0% for AGIs $75k-100k, 15.8% for AGIs $100k-200k, 12.6% for AGIs over 200k)
Charity contributions: $3,782 (reported on 28.3% of returns)
Here:
$3,782
State:
$4,687
(% of AGI for various income ranges: 1.3% for AGIs below $25k, 1.8% for AGIs $25k-50k, 1.9% for AGIs $50k-75k, 2.3% for AGIs $75k-100k, 5.0% for AGIs $100k-200k)
Taxes paid: $5,668 (reported on 32.9% of returns)
28729:
$5,668
State:
$8,823
(% of AGI for various income ranges: 1.5% for AGIs below $25k, 2.6% for AGIs $25k-50k, 3.7% for AGIs $50k-75k, 4.6% for AGIs $75k-100k, 6.2% for AGIs $100k-200k, 6.0% for AGIs over 200k)
Earned income credit: $2,273 (reported on 15.0% of returns)
Here:
$2,273
State:
$2,376
(% of AGI for various income ranges: 5.1% for AGIs below $25k, 1.0% for AGIs $25k-50k)
Percentage of individuals using paid preparers for their 2012 taxes: 54.3%
Here:
54%
State:
53%
(% for various income ranges: 50.0% for AGIs below $25k, 52.3% for AGIs $25k-50k, 64.3% for AGIs $50k-75k, 55.6% for AGIs $75k-100k, 69.2% for AGIs $100k-200k)
Averages for the 2004 tax year for zip code 28729, filed in 2005:
Average Adjusted Gross Income (AGI) in 2004: $41,591 (Individual Income Tax Returns)
Here:
$41,591
State:
$45,376
Salary/wage: $32,619 (reported on 71.8% of returns)
Here:
$32,619
State:
$39,442
(% of AGI for various income ranges: 90.0% for AGIs below $10k, 60.4% for AGIs $10k-25k, 60.3% for AGIs $25k-50k, 61.7% for AGIs $50k-75k, 62.8% for AGIs $75k-100k, 39.1% for AGIs over 100k)
Taxable interest for individuals: $1,695 (reported on 53.5% of returns)
This zip code:
$1,695
North Carolina:
$1,515
(% of AGI for various income ranges: 7.7% for AGIs below $10k, 3.1% for AGIs $10k-25k, 2.2% for AGIs $25k-50k, 1.9% for AGIs $50k-75k, 1.5% for AGIs $75k-100k, 2.2% for AGIs over 100k)
Taxable dividends: $3,636 (reported on 30.3% of returns)
Here:
$3,636
State:
$4,016
(% of AGI for various income ranges: 7.9% for AGIs below $10k, 2.2% for AGIs $10k-25k, 2.9% for AGIs $25k-50k, 2.4% for AGIs $50k-75k, 2.5% for AGIs $75k-100k, 2.5% for AGIs over 100k)
Net capital gain/loss: +$8,249 (reported on 23.6% of returns)
Here:
+$8,249
State:
+$11,152
(% of AGI for various income ranges: -4.0% for AGIs below $10k, -0.8% for AGIs $10k-25k, 0.7% for AGIs $25k-50k, 1.6% for AGIs $50k-75k, 4.3% for AGIs $75k-100k, 15.0% for AGIs over 100k)
Profit/loss from business: +$9,394 (reported on 17.0% of returns)
Here:
+$9,394
State:
+$9,490
(% of AGI for various income ranges: -12.5% for AGIs below $10k, 5.6% for AGIs $10k-25k, 5.3% for AGIs $25k-50k, 2.8% for AGIs $50k-75k, 3.2% for AGIs $75k-100k, 4.1% for AGIs over 100k)
IRA payment deduction: $3,027 (reported on 2.2% of returns)
28729:
$3,027
North Carolina:
$2,967
(% of AGI for various income ranges: 0.4% for AGIs $10k-25k, 0.2% for AGIs $50k-75k, 0.5% for AGIs $75k-100k)
Total itemized deductions: $16,574 (25% of AGI, reported on 36.7% of returns)
Here:
$16,574
State:
$19,464
Here:
24.8% of AGI
State:
22.7% of AGI
(% of AGI for various income ranges: 14.6% for AGIs below $10k, 12.5% for AGIs $10k-25k, 14.6% for AGIs $25k-50k, 14.7% for AGIs $50k-75k, 18.3% for AGIs $75k-100k, 13.4% for AGIs over 100k)
Charity contributions deductions: $3,473 (5% of AGI, reported on 31.1% of returns)
Here:
$3,473
State:
$4,035
Here:
4.9% of AGI
State:
4.5% of AGI
(% of AGI for various income ranges: 2.0% for AGIs $10k-25k, 2.2% for AGIs $25k-50k, 2.5% for AGIs $50k-75k, 3.4% for AGIs $75k-100k, 3.0% for AGIs over 100k)
Total tax: $5,400 (reported on 78.2% of returns)
28729:
$5,400
State:
$7,257
(% of AGI for various income ranges: 3.4% for AGIs below $10k, 3.9% for AGIs $10k-25k, 6.8% for AGIs $25k-50k, 8.7% for AGIs $50k-75k, 10.2% for AGIs $75k-100k, 18.2% for AGIs over 100k)
Earned income credit: $1,816 (reported on 12.2% of returns)
Here:
$1,816
State:
$1,851
Percentage of individuals using paid preparers for their 2004 taxes: 63.3%
Here:
63%
State:
62%
(% for various income ranges: 62.5% for AGIs below $10k, 65.7% for AGIs $10k-25k, 60.3% for AGIs $25k-50k, 64.2% for AGIs $50k-75k, 58.3% for AGIs $75k-100k, 71.1% for AGIs over 100k)
Household received Food Stamps/SNAP in the past 12 months: 178 Household did not receive Food Stamps/SNAP in the past 12 months: 1,362
Women who had a birth in the past 12 months: 22 (23 now married, 0 unmarried) Women who did not have a birth in the past 12 months: 607 (212 now married, 393 unmarried)
Housing units in zip code 28729 with a mortgage: 705 (20 second mortgage, 21 both second mortgage and home equity loan) Houses without a mortgage: 9
Median monthly owner costs for units with a mortgage: $1,535 Median monthly owner costs for units without a mortgage: $416
Residents with income below the poverty level in 2022:
This zip code:
5.4%
Whole state:
12.8%
Residents with income below 50% of the poverty level in 2022:
This zip code:
0.8%
Whole state:
6.8%
Median number of rooms in houses and condos:
Here:
6.2
State:
6.4
Median number of rooms in apartments:
Here:
5.9
State:
4.4
Notable locations in this zip code not listed on our city pages
Size of family households: 720 2-persons, 185 3-persons, 241 4-persons, 62 7-or-more-persons
Size of nonfamily households: 233 1-person, 107 2-persons
421 married couples with children.
118 single-parent households (118 women).
93.0% of residents of 28729 zip code speak English at home.
2.3% of residents speak Spanish at home (85% very well, 15% well).
3.2% of residents speak other Indo-European language at home (87% very well, 13% well).
2.0% of residents speak other language at home (100% well).
Foreign born population: 188 (5.1%) (84.8% of them are naturalized citizens)
This zip code:
5.1%
Whole state:
8.6%
38%Barbados
31%France
13%Burma (Myanmar)
12%Sweden
7%Honduras
5%United Kingdom, excluding England and Scotland
1%Switzerland
22%English
18%French
14%American
6%Irish
6%German
5%Italian
5%Scottish
Year of entry for the foreign-born population
142010 or later
662000 to 2009
01990 to 1999
104Before 1990
Facilities with environmental interests located in this zip code:
CULLIGAN OPERATING SERVICES, INCORPORATED (U.S. HIGHWAY 64 in ETOWAH, NC)
STATE MASTER (North Carolina facility info) - -115DA4YG00SXYW64FBEQ8BVKH8, WASTEWATER FACILITY National Pollutant Discharge Elimination System NON-MAJOR (Tracking pollutant discharge elimination systems) - permit Business SIC classification: SEWERAGE SYSTEMS Alternative names: BLUE MTN UTILITIES/HUNTER GLEN, CULLIGAN OPERATING SERV INC HU, HUNTER'S GLEN WWTP
48.3%Electricity
43.8%Utility gas
6.9%Wood
1.1%Bottled, tank, or LP gas
Population in 1990: 2,461. Population change in the 1990s: +211 (+8.6%).
Place of birth for U.S.-born residents:
This state: 1,910
Northeast: 467
Midwest: 439
South: 603
West: 82
56% of the 28729 zip code residents lived in the same house 5 years ago. Out of people who lived in different houses, 33% lived in this county. Out of people who lived in different counties, 50% lived in North Carolina.
91% of the 28729 zip code residents lived in the same house 1 year ago. Out of people who lived in different houses, 43% moved from this county. Out of people who lived in different houses, 13% moved from different county within same state. Out of people who lived in different houses, 45% moved from different state.
Private vs. public school enrollment:
Students in private schools in grades 1 to 8 (elementary and middle school): 31
Here:
38.3%
North Carolina:
13.8%
Students in private schools in grades 9 to 12 (high school): 44
Here:
25.1%
North Carolina:
11.9%
Students in private undergraduate colleges:
Here:
0.0%
North Carolina:
19.3%
Occupation by median earnings in the past 12 months ($)
115,488Management occupations
91,653Production occupations
89,673Sales and related occupations
38,780Office and administrative support occupations
29,318Construction and extraction occupations
26,631Business and financial operations occupations
Top industries in this zip code by the number of employees in 2005:
Arts, Entertainment, and Recreation: Golf Courses and Country Clubs (50-99 employees: 1 establishment)
Other Services (except Public Administration): Religious Organizations (20-49: 1, 5-9: 1, 1-4: 2)
Accommodation and Food Services: Limited-Service Restaurants (10-19: 1, 1-4: 1)
Construction: All Other Specialty Trade Contractors (10-19: 1)
Other Services (except Public Administration): Commercial and Industrial Machinery and Equipment (except Automotive and Electronic) Repair and Maintenance (10-19: 1)
2002 - 2018 National Fire Incident Reporting System (NFIRS) incidents
Based on the data from the years 2002 - 2018 the average number of fires per year is 14. The highest number of reported fires - 41 took place in 2011, and the least - 0 in 2003. The data has a dropping trend.
When looking into fire subcategories, the most reports belonged to: Structure Fires (60.4%), and Outside Fires (29.0%).
Fire incident types reported to NFIRS in Zip Code 28729


 Nearest zip codes: 28759, 28766, 28742, 28739, 28791, 28768.


 Based on the data from the years 2002 - 2018 the average number of fires per year is 14. The highest number of reported fires - 41 took place in 2011, and the least - 0 in 2003. The data has a dropping trend.
 When looking into fire subcategories, the most reports belonged to: Structure Fires (60.4%), and Outside Fires (29.0%).