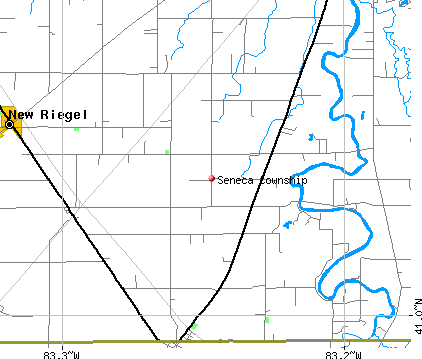
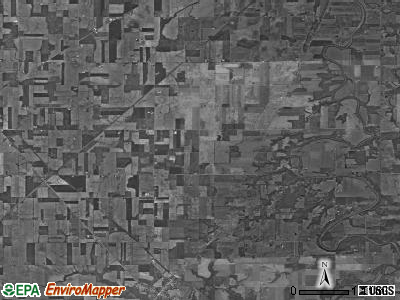
Seneca township, Seneca County, Ohio (OH) detailed profile
Number of foreign born residents: 0 (100% naturalized citizens)
| Seneca township: | 0.1% |
| Whole state: | 3.0% |
76% of Seneca township residents lived in the same house 5 years ago.
Out of people who lived in different houses, 70% lived in this county.
Out of people who lived in different counties, 83% lived in Ohio.
Place of birth for U.S.-born residents:
- This state: 1488
- Northeast: 14
- Midwest: 55
- South: 60
- West: 3
Median price asked for vacant for-sale houses in 2000: $112,500
Percentage of households with unmarried partners: 5.2%
Likely homosexual households (counted as self-reported same-sex unmarried-partner households)
- Lesbian couples: 0.4% of all households
- Gay men: 0.0% of all households
37 people in nursing homes
Housing units in structures:
- One, detached: 512
- Mobile homes: 42
Median worth of mobile homes: $38,600
Housing units in Seneca township with a mortgage: 198 (0 second mortgage, 44 home equity loan, 0 both second mortgage and home equity loan)
Houses without a mortgage: 114
- Construction (16%)
- Machinery (13%)
- Transportation equipment (10%)
- Metal and metal products (7%)
- Agriculture, forestry, fishing and hunting (6%)
- Nonmetallic mineral products (6%)
- Educational services (4%)
- Educational services (15%)
- Health care (14%)
- Social assistance (7%)
- Transportation equipment (6%)
- Food and beverage stores (6%)
- Accommodation and food services (6%)
- Metal and metal products (5%)
- Metal workers and plastic workers (12%)
- Driver/sales workers and truck drivers (8%)
- Electrical equipment mechanics and other installation, maintenance, and repair occupations including supervisors (8%)
- Construction trades workers except carpenters, electricians, painters, plumbers, and construction laborers (5%)
- Laborers and material movers, hand (5%)
- Engineers (5%)
- Other production occupations including supervisors (4%)
- Preschool, kindergarten, elementary and middle school teachers (10%)
- Secretaries and administrative assistants (8%)
- Nursing, psychiatric, and home health aides (7%)
- Cashiers (5%)
- Child care workers (5%)
- Other sales and related workers including supervisors (4%)
- Assemblers and fabricators (4%)
Most common first ancestries reported in Seneca township:
- German (67.0%)
- United States or American (16.8%)
- Irish (5.0%)
- Italian (2.0%)
- English (1.8%)
- French (except Basque) (1.2%)
- Polish (1.2%)
Most common places of birth for the foreign-born residents:
- Mexico (100%)
Means of transportation to work:
- Drove a car alone: 681 (86%)
- Carpooled: 50 (6%)
- Bus or trolley bus: 10 (1%)
- Walked: 4 (1%)
- Worked at home: 47 (6%)
Most commonly used house heating fuel:
- Bottled, tank, or LP gas (42%)
- Electricity (18%)
- Wood (16%)
- Utility gas (14%)
- Fuel oil, kerosene, etc. (11%)
37 people in nursing homes
98.3% of residents of Seneca township speak English at home.
1.0% of residents speak Spanish at home (88% speak English very well, 13% speak English well).
0.7% of residents speak other Indo-European language at home (18% speak English very well, 82% speak English well).
Household type by relationship:
Households: 1,591- In family households: 1,490 (399 male householders, 42 female householders)
385 spouses, 616 children (572 natural, 12 adopted, 32 stepchildren), 15 grandchildren, 0 brothers or sisters, 10 parents, 0 other relatives, 23 non-relatives
- In nonfamily households: 101 (48 male householders (37 living alone)), 42 female householders (41 living alone)), 11 nonrelatives
- In group quarters: 38 (all institutionalized)
Size of family households: 155 2-persons, 86 3-persons, 119 4-persons, 37 5-persons, 39 6-persons, 5 7-or-more-persons,
Size of nonfamily households: 78 1-person, 12 2-persons,
375 married couples with children.
63 single-parent households (26 men, 37 women).
Private vs. public school enrollment:
Students in private schools in grades 1 to 8 (elementary and middle school): 0
| Here: | 0.0% |
| Ohio: | 14.2% |
Students in private schools in grades 9 to 12 (high school): 14
| Here: | 9.7% |
| Ohio: | 10.9% |
Students in private undergraduate colleges: 30
| Here: | 60.0% |
| Ohio: | 23.4% |